. 2020 Feb 25;10(3):80.
doi: 10.3390/metabo10030080.

An Integrated Multi-Omics Analysis Defines Key Pathway Alterations in a Diet-Induced Obesity Mouse Model

Affiliations

An Integrated Multi-Omics Analysis Defines Key Pathway Alterations in a Diet-Induced Obesity Mouse Model

Ulrik K Sundekilde et al. Metabolites. .

Abstract

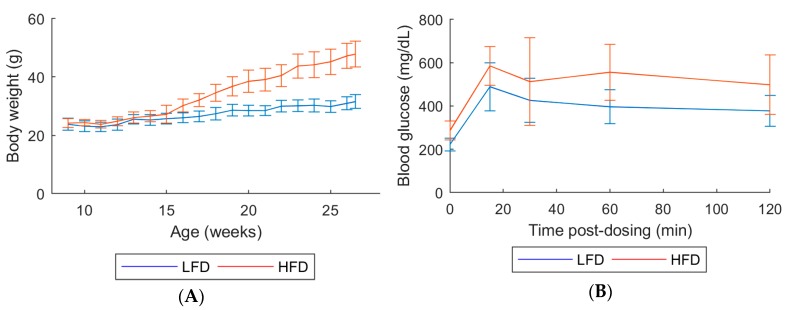
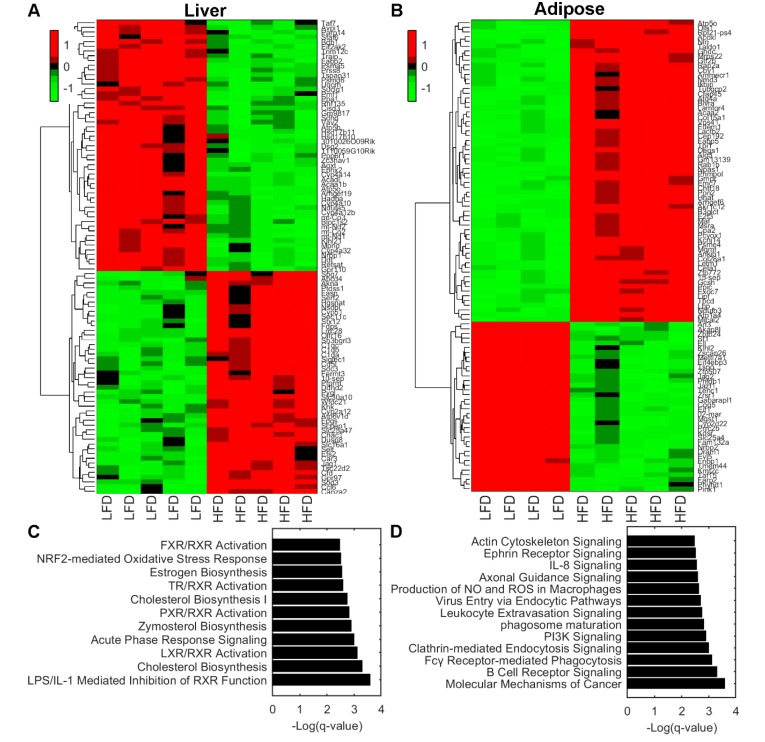
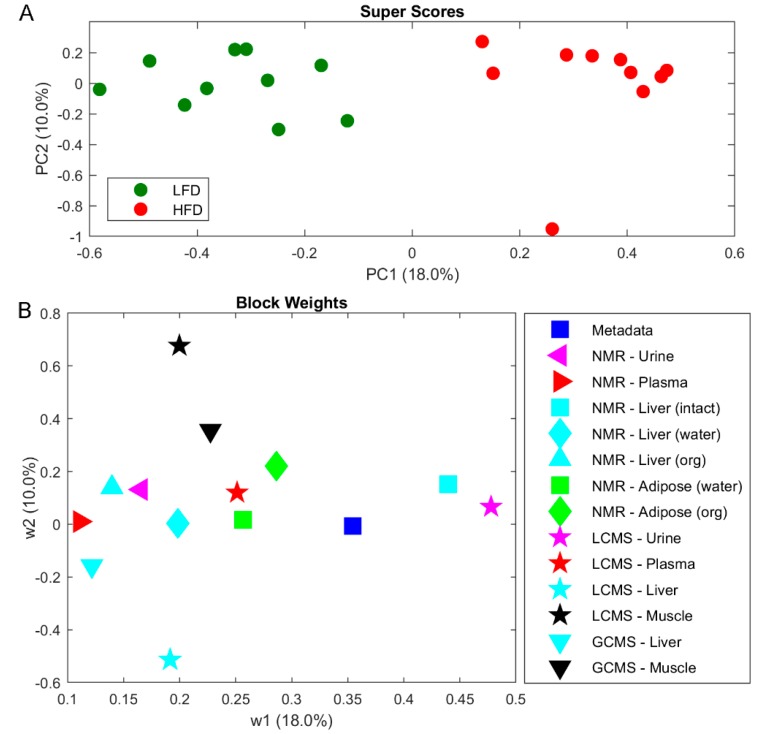
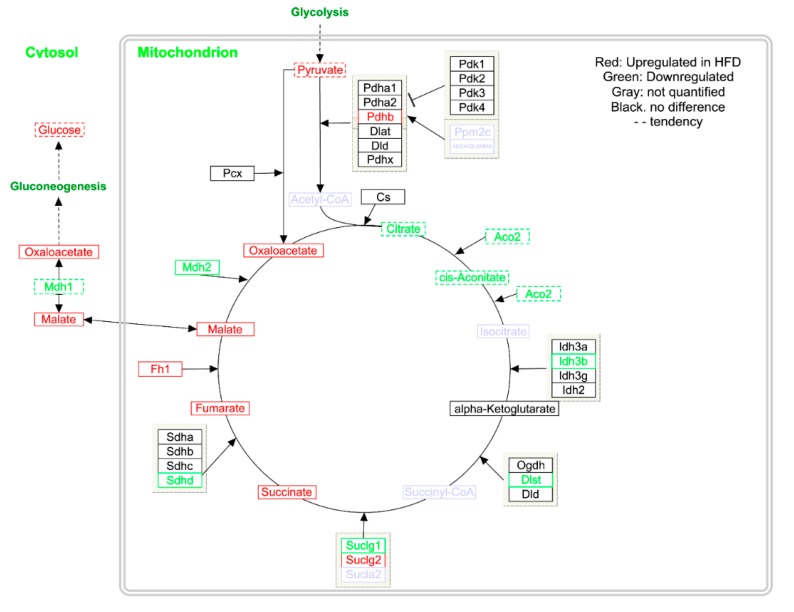
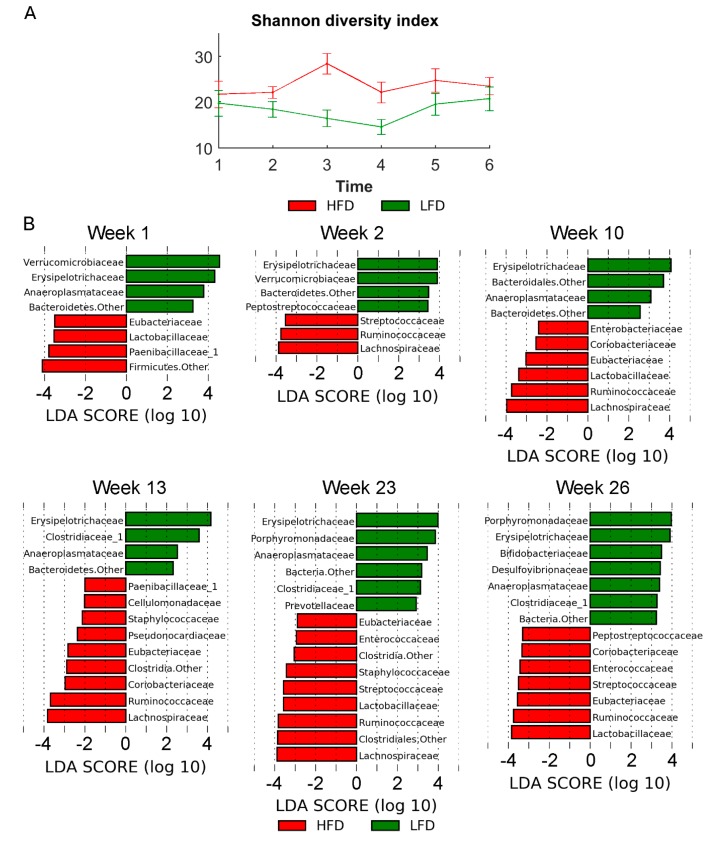
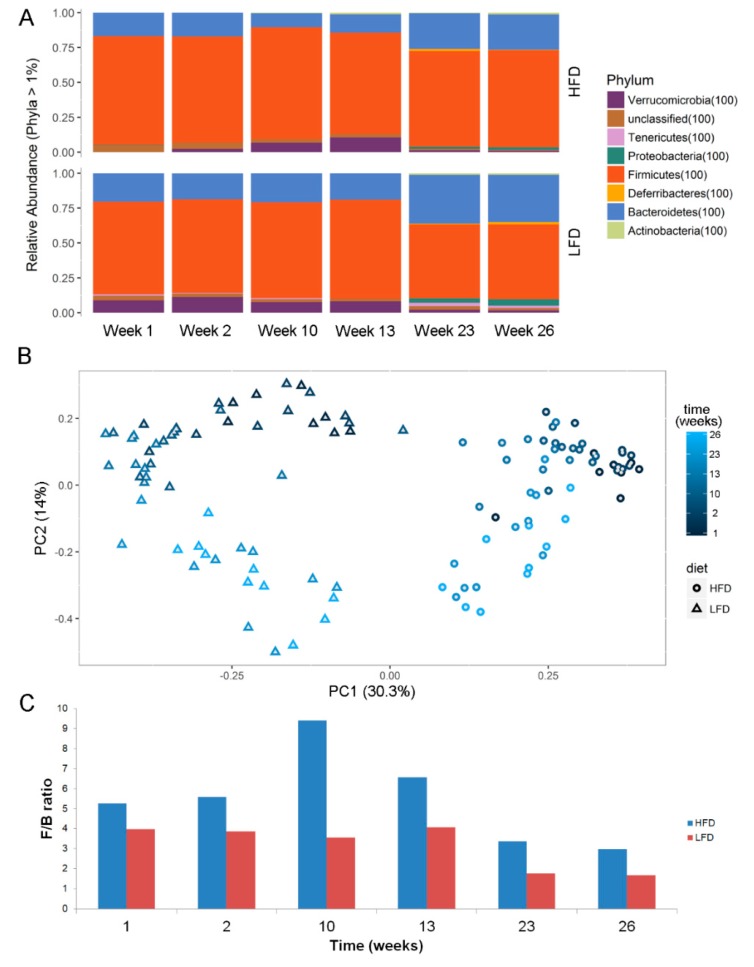
Obesity is a multifactorial disease with many complications and related diseases and has become a global epidemic. To thoroughly understand the impact of obesity on whole organism homeostasis, it is helpful to utilize a systems biological approach combining gene expression and metabolomics across tissues and biofluids together with metagenomics of gut microbial diversity. Here, we present a multi-omics study on liver, muscle, adipose tissue, urine, plasma, and feces on mice fed a high-fat diet (HFD). Gene expression analyses showed alterations in genes related to lipid and energy metabolism and inflammation in liver and adipose tissue. The integration of metabolomics data across tissues and biofluids identified major differences in liver TCA cycle, where malate, succinate and oxaloacetate were found to be increased in HFD mice. This finding was supported by gene expression analysis of TCA-related enzymes in liver, where expression of malate dehydrogenase was found to be decreased. Investigations of the microbiome showed enrichment of Lachnospiraceae, Ruminococcaceae, Streptococcaceae and Lactobacillaceae in the HFD group. Our findings help elucidate how the whole organism metabolome and transcriptome are integrated and regulated during obesity.

Keywords: metabolomics; metagenomics; multi-omics; obesity; pathway analysis; systems biology; transcriptomics.


Conflict of interest statement

All authors except U.K.S. are employees or former employees of DuPont. For former employees, their current employers had no role in funding this study. Neither the current employers nor the Innovation Fund Denmark funders had anyrole in the design of the study; in the collection, analyses, or interpretation of data; in the writing of the manuscript, or in the decision to publish the results.

Figures

Figure 1
Figure 1
(A) Body weight measured weekly. (B) Glucose tolerance test at age 18 weeks. Animals in each group: 10 males. Error bars indicate the standard deviation of biological replicates (n = 10). Abbreviations: LFD, low-fat diet; HFD, High-fat diet.
Figure 2
Figure 2
(A,B) Hierarchical clustering of top 100 significant differentially expressed genes in liver tissue (A) and adipose tissue (B). (C,D) Pathway enrichment analysis using Ingenuity Pathways Analysis software of liver tissue (C) and adipose tissue (D). Statistical significance is expressed as q values of a right-tailed Fisher’s Exact test with multiple hypothesis correction based on the Benjamini–Hochberg approach. Abbreviations: LFD, low-fat diet; HFD, High-fat diet.
Figure 3
Figure 3
Multi-block principal component analysis (PCA) on metabolomics data from biofluids and tissues as indicated. (A) Super scores scatter plot. (B) Block weights of biofluids and tissues. Abbreviations: LFD, low-fat diet; HFD, High-fat diet.
Figure 4
Figure 4
The tricarboxylic acid (TCA) cycle showing differences in gene expression and metabolite abundances in mouse liver. Upregulated in HFD are shown in red, and those that were downregulated are shown in green, genes and metabolites not quantified are shown in gray. Data is shown in Table 1 and Table S2.
Figure 5
Figure 5
(A) α-diversity (Shannon diversity index). (B) Histograms showing the log-transformed Linear discriminant analysis (LDA) scores computed with Linear discriminant analysis effect size (LEfSe) for significantly different bacterial taxa between diet groups at the different sampling time points. A positive LDA score indicates enrichment in LFD, whereas a negative LDA score indicates enrichment in HFD. The LDA score indicates the effect size and ranking of each bacterial taxon. Statistical significance was evaluated using the Kruskal–Wallis test (alpha < 0.05) and a log-transformed LDA score with a threshold of 2.0. Error bars indicate the standard deviation of biological replicates (n = 10). Abbreviations: LFD, low-fat diet; HFD, High-fat diet.
Figure 6
Figure 6
(A) Phyla abundance and (B) Unsupervised ordination using Bray–Curtis dissimilarity-based principal coordinates plot showing clusters of diets (PC1) and time (PC2). (C) ratios of relative abundance of firmicutes and bacteriodetes (F/B ratio) at different time-points. Abbreviations: LFD, low-fat diet; HFD, High-fat diet.

References

    1. World Health Organization Obesity and Overweight. [(accessed on 27 November 2019)]; Available online: https://www.who.int/en/news-room/fact-sheets/detail/obesity-and-overweight.
    1. Eckel R.H., Alberti K.G.M.M., Grundy S.M., Zimmet P.Z., Church T., Blair S. The metabolic syndrome. Lancet (Lond. Engl.) 2010;375:181–183. doi: 10.1016/S0140-6736(09)61794-3. - DOI - PubMed
    1. Hotamisligil G.S. Inflammation and metabolic disorders. Nature. 2006;444:860–867. doi: 10.1038/nature05485. - DOI - PubMed
    1. Stenman L.K., Lehtinen M.J., Meland N., Christensen J.E., Yeung N., Saarinen M.T., Courtney M., Burcelin R., Lähdeaho M.-L., Linros J., et al. Probiotic with or without fiber controls body fat mass, associated with serum zonulin, in overweight and obese adults—Randomized controlled trial. EBioMedicine. 2016;13:190–200. doi: 10.1016/j.ebiom.2016.10.036. - DOI - PMC - PubMed
    1. Cani P.D., Amar J., Iglesias M.A., Poggi M., Knauf C., Bastelica D., Neyrinck A.M., Fava F., Tuohy K.M., Chabo C., et al. Metabolic endotoxemia initiates obesity and insulin resistance. Diabetes. 2007;56:1761–1772. doi: 10.2337/db06-1491. - DOI - PubMed

LinkOut - more resources