. 2020 Apr 10;295(15):5124-5135.
doi: 10.1074/jbc.RA119.011952. Epub 2020 Feb 27.

The luminescent HiBiT peptide enables selective quantitation of G protein-coupled receptor ligand engagement and internalization in living cells

Affiliations

The luminescent HiBiT peptide enables selective quantitation of G protein-coupled receptor ligand engagement and internalization in living cells

Michelle E Boursier et al. J Biol Chem. .

Abstract

G protein-coupled receptors (GPCRs) are prominent targets to new therapeutics for a range of diseases. Comprehensive assessments of their cellular interactions with bioactive compounds, particularly in a kinetic format, are imperative to the development of drugs with improved efficacy. Hence, we developed complementary cellular assays that enable equilibrium and real-time analyses of GPCR ligand engagement and consequent activation, measured as receptor internalization. These assays utilize GPCRs genetically fused to an N-terminal HiBiT peptide (1.3 kDa), which produces bright luminescence upon high-affinity complementation with LgBiT, an 18-kDa subunit derived from NanoLuc. The cell impermeability of LgBiT limits signal detection to the cell surface and enables measurements of ligand-induced internalization through changes in cell-surface receptor density. In addition, bioluminescent resonance energy transfer is used to quantify dynamic interactions between ligands and their cognate HiBiT-tagged GPCRs through competitive binding with fluorescent tracers. The sensitivity and dynamic range of these assays benefit from the specificity of bioluminescent resonance energy transfer and the high signal intensity of HiBiT/LgBiT without background luminescence from receptors present in intracellular compartments. These features allow analyses of challenging interactions having low selectivity or affinity and enable studies using endogenously tagged receptors. Using the β-adrenergic receptor family as a model, we demonstrate the versatility of these assays by utilizing the same HiBiT construct in analyses of multiple aspects of GPCR pharmacology. We anticipate that this combination of target engagement and proximal functional readout will prove useful to the study of other GPCR families and the development of new therapeutics.

Keywords: G protein-coupled receptor (GPCR); HiBiT; NanoLuc; adrenergic receptor; bioluminescence; bioluminescence resonance energy transfer (BRET); endogenous tagging; kinetics; ligand engagement; receptor internalization.


Conflict of interest statement

All authors were Promega employees during manuscript preparation

Figures

Figure 1.
Figure 1.
Schematic of assays utilizing the HiBiT/LgBiT reporter for monitoring ligand-induced GPCR internalization (A) and ligand engagement via BRET (B).
Figure 2.
Figure 2.
Quantifying binding characteristics for β2-AR by BRET in different expression setups. A, structure of propranolol-NB590. B, imaging of binding and displacement of propranolol-NB590 to HiBiT–β2-AR expressed transiently in HeLa cells or endogenously in PC3 clones. Panels are pseudocolored for the donor (blue) and acceptor (red) channel. Scale bar, 30 μm. C and D, analysis of β2-AR expressed transiently in HEK293 and PC3 cells or endogenously in PC3 clones for saturation binding of propranolol-NB590 (C) and competitive displacement of propranolol-NB590 (D) by increasing concentrations of unmodified propranolol. To better illustrate the tested range of [propranolol-NB590], saturation binding analysis is displayed on a logarithmic scale. Error bars indicate S.E. of three independent experiments. E, propranolol-NB590 equilibrium dissociation constants (KD) ± S.E. or IC50 values with 95% confidence intervals.
Figure 3.
Figure 3.
Binding affinities for β2-AR. A–D, competitive displacement of propranolol-NB590 by increasing concentrations of unmodified ligands for β2-AR expressed transiently in HEK293 (A) and PC3 (B) or in endogenously tagged PC3 clones PC3 VS–HiBiT–β2-AR (C) and PC3 IL6-VS–HiBiT–β2-AR (D) cells. Error bars indicate S.E. E, unmodified ligand affinities (pKi) in all cell types tested. Ligands are ranked based on affinity in HEK293 cells, with darker coloring indicating higher affinity. The data represent the means ± S.E. of four independent experiments.
Figure 4.
Figure 4.
Binding characteristics of propranolol-NB590 for the β-AR family in equilibrium and kinetic assay formats. A, saturation binding analysis for all receptors. Error bars indicate S.E. B–D, representative kinetic binding analysis for β1-AR (B), β2-AR (C), and β3-AR (D). Error bars indicate S.D. E, binding characteristics for all receptors. The data represent the means ± S.E. of three independent experiments.
Figure 5.
Figure 5.
Binding characteristics of propranolol for β-AR family in equilibrium and kinetic assay formats. A, competitive displacement of propranolol-NB590 at EC60–EC80 concentration by increasing concentrations of propranolol. Error bars indicate S.E. B–D, representative kinetic binding analysis competing varying concentrations of propranolol with 25 nm propranolol-NB590 for β1-AR (B), 2 nm propranolol-NB590 for β2-AR (C), and 80 nm propranolol-NB590 for β3-AR (D). Error bars indicate S.D. E, binding characteristics for all receptors. The data represent the means ± S.E. of three independent experiments.
Figure 6.
Figure 6.
Heat map displaying kinetic binding characteristics of unmodified ligands for the β-adrenergic receptor family.
Figure 7.
Figure 7.
Influence of allosteric modulation on competitive binding of agonists to β2-AR. A and B, representative competitive displacement of a fixed concentration of propranolol-NB590 by increasing concentrations of agonists formoterol (A) or isoproterenol (B) in the presence of increasing concentration of a PAM modulator. Error bars indicate S.D. of an experimental quadruplicate. C, comparison of IC50 fold shift and equilibrium-derived pKi values for all agonists tested.
Figure 8.
Figure 8.
End-point internalization analyses for β2-AR. A, influence of transient expression level in HEK293 cells on formoterol-induced internalization. B and C, internalization induced by different agonists in transiently transfected HEK293 cells (B) and endogenously tagged PC3 clone (C). Concentrations of 50% maximal internalization (Int50) are shown in Table S4. Error bars indicate S.E. of three independent experiments.
Figure 9.
Figure 9.
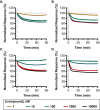
Representative agonist-induced internalization kinetics for β2-AR. A and B, internalization induced by varying concentrations of formoterol in transiently transfected HEK293 (A) and endogenously tagged PC3 clone (B). C and D, internalization induced by varying concentrations of isoproterenol in transiently transfected HEK293 (C) and endogenously tagged PC3 clone (D). Raw luminescence measurements were normalized as described under “Experimental procedures” and in Fig. S16. Internalization half-lives are shown in Table S5. Error bars indicate S.D. of an experimental triplicate.

Similar articles

Cited by

References

    1. Santos R., Ursu O., Gaulton A., Bento A. P., Donadi R. S., Bologa C. G., Karlsson A., Al-Lazikani B., Hersey A., Oprea T. I., and Overington J. P. (2017) A comprehensive map of molecular drug targets. Nat. Rev. Drug Discov. 16, 19–34 10.1038/nrd.2016.230 - DOI - PMC - PubMed
    1. Hulme E. C., and Trevethick M. A. (2010) Ligand binding assays at equilibrium: validation and interpretation. Br. J. Pharmacol. 161, 1219–1237 10.1111/j.1476-5381.2009.00604.x - DOI - PMC - PubMed
    1. Copeland R. A. (2016) The drug–target residence time model: a 10-year retrospective. Nat. Rev. Drug Discov. 15, 87–95 10.1038/nrd.2015.18 - DOI - PubMed
    1. Schuetz D. A., de Witte W. E. A., Wong Y. C., Knasmueller B., Richter L., Kokh D. B., Sadiq S. K., Bosma R., Nederpelt I., Heitman L. H., Segala E., Amaral M., Guo D., Andres D., Georgi V., et al. (2017) Kinetics for drug discovery: an industry driven effort to target drug residence time. Drug Discov. Today 22, 896–911 10.1016/j.drudis.2017.02.002 - DOI - PubMed
    1. Flanagan C. A. (2016) GPCR-radioligand binding assays. Methods Cell Biol. 132, 191–215 10.1016/bs.mcb.2015.11.004 - DOI - PubMed

LinkOut - more resources