. 2020 Feb 27;11(1):1105.
doi: 10.1038/s41467-020-14855-3.

Gene therapy conversion of striatal astrocytes into GABAergic neurons in mouse models of Huntington's disease

Affiliations

Gene therapy conversion of striatal astrocytes into GABAergic neurons in mouse models of Huntington's disease

Zheng Wu et al. Nat Commun. .

Abstract

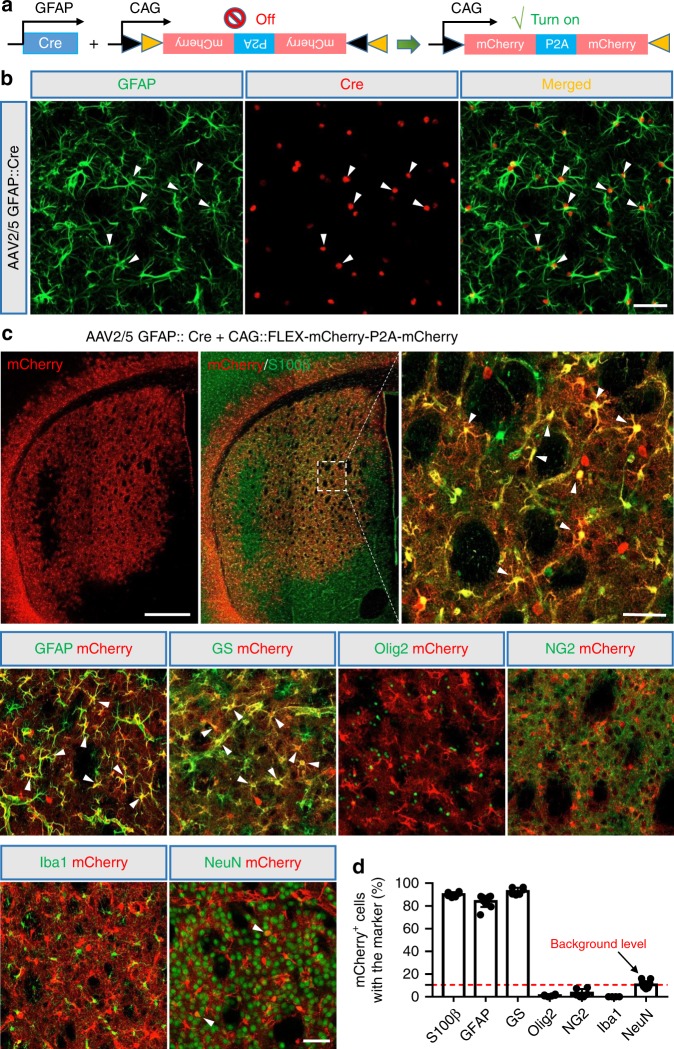
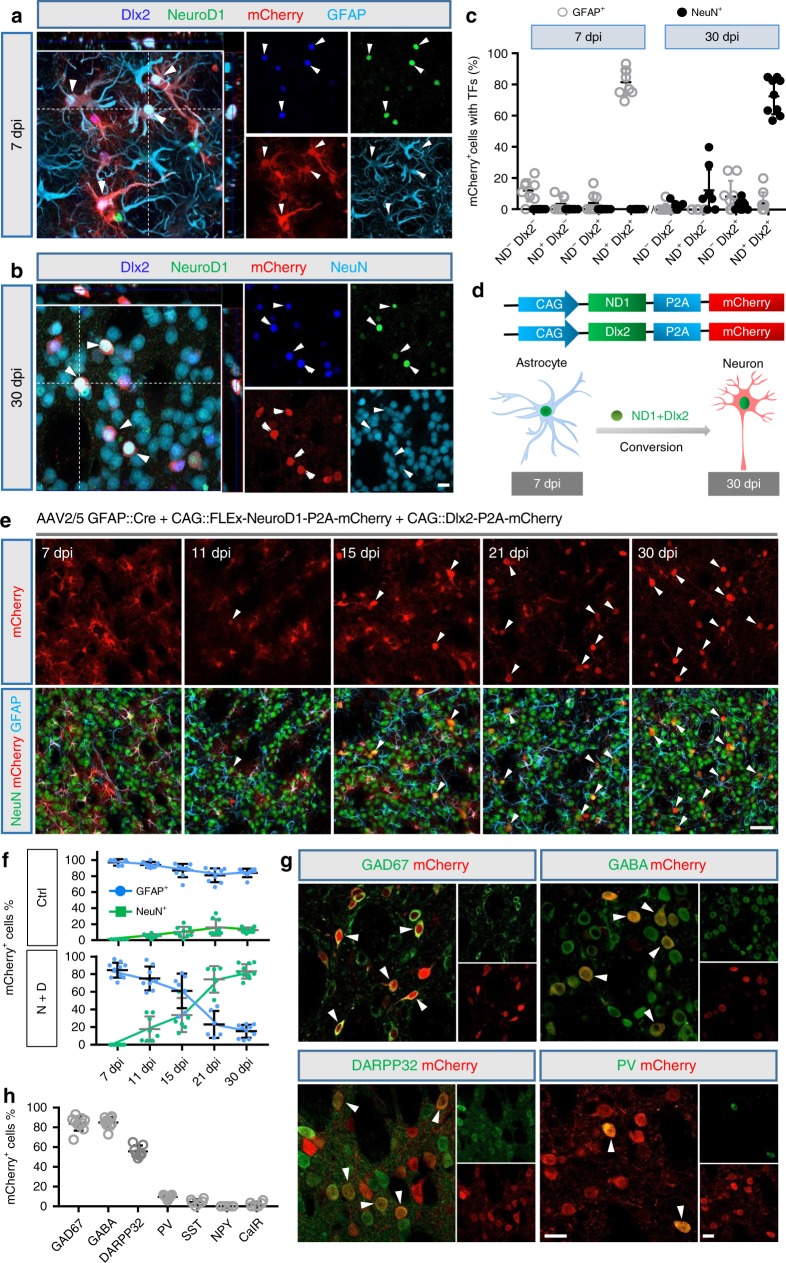
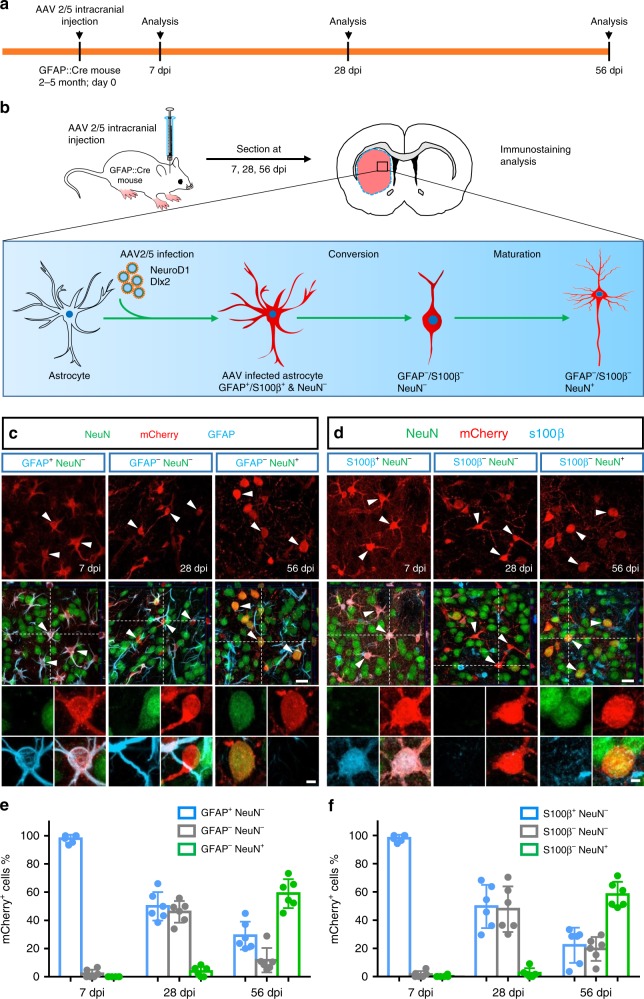
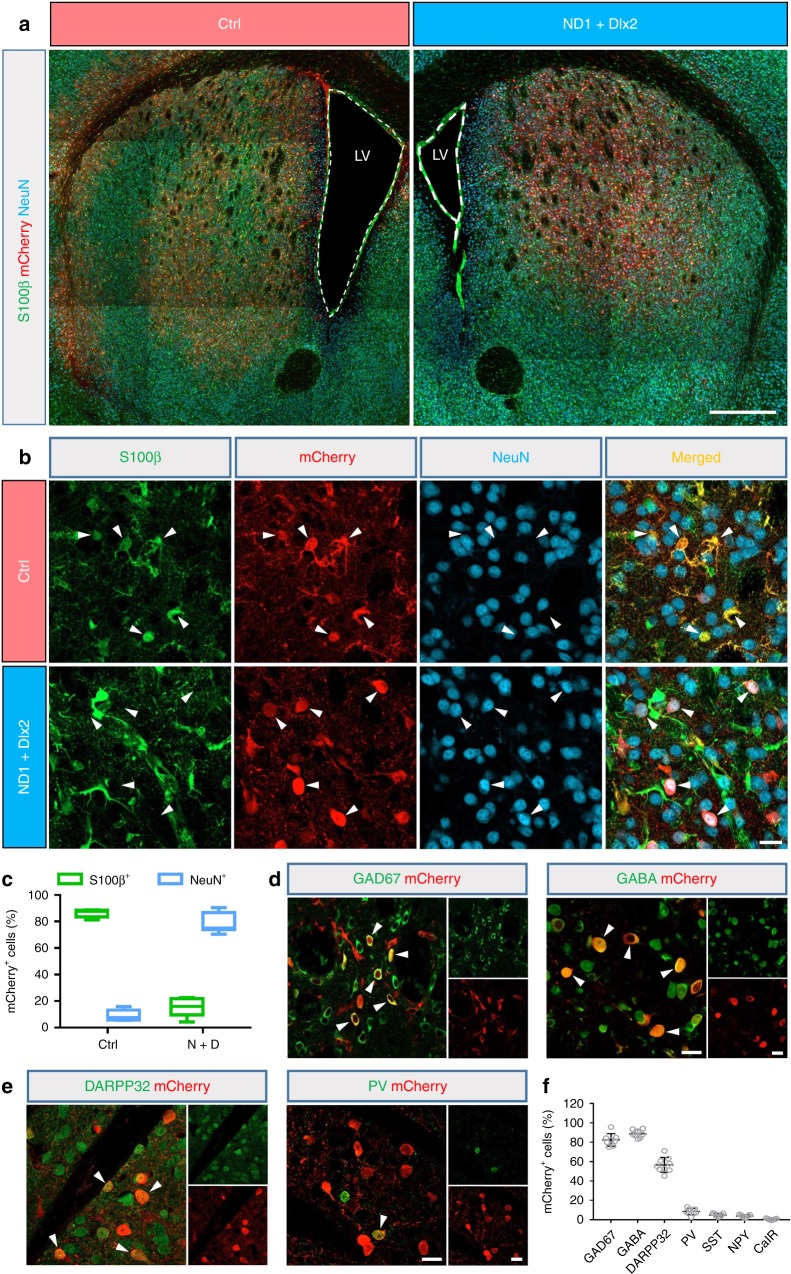
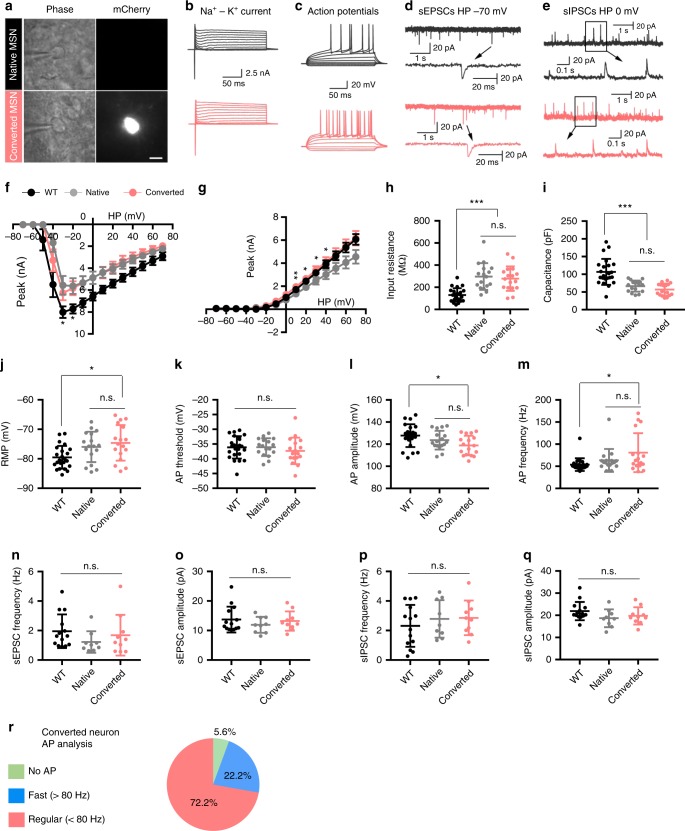
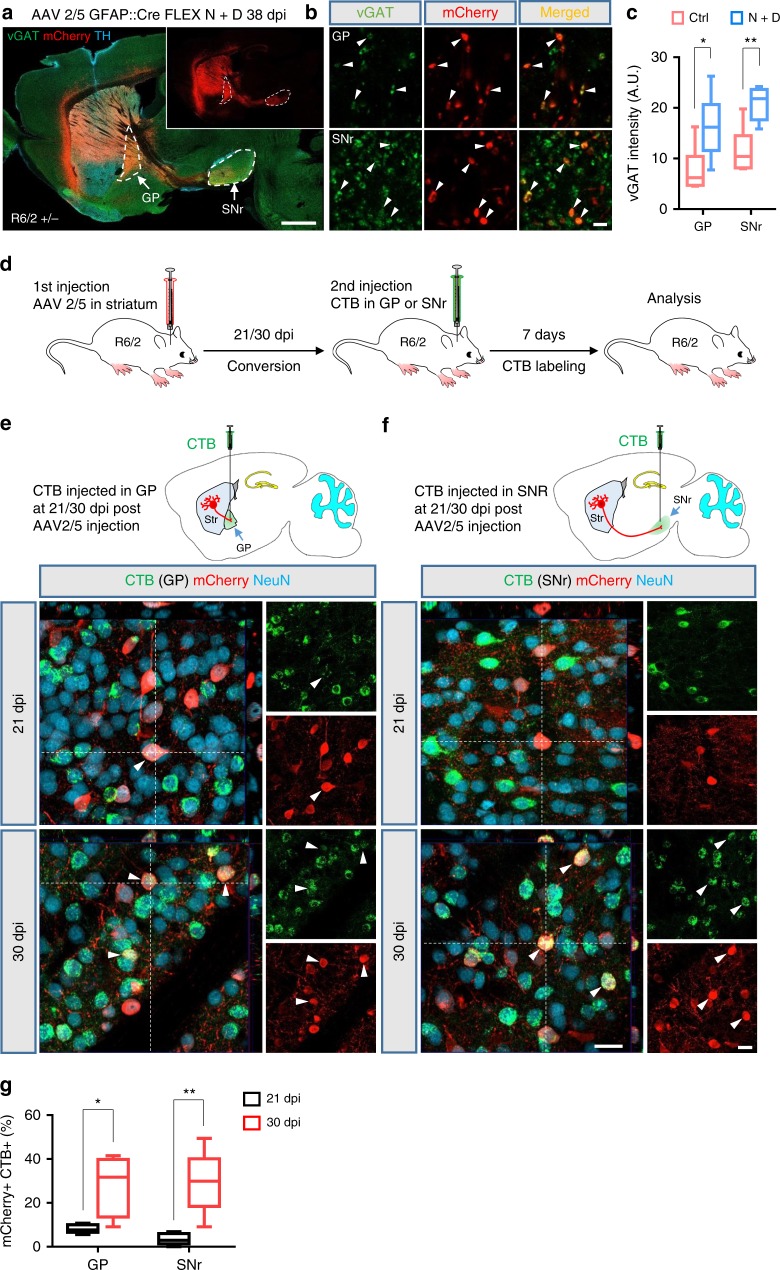
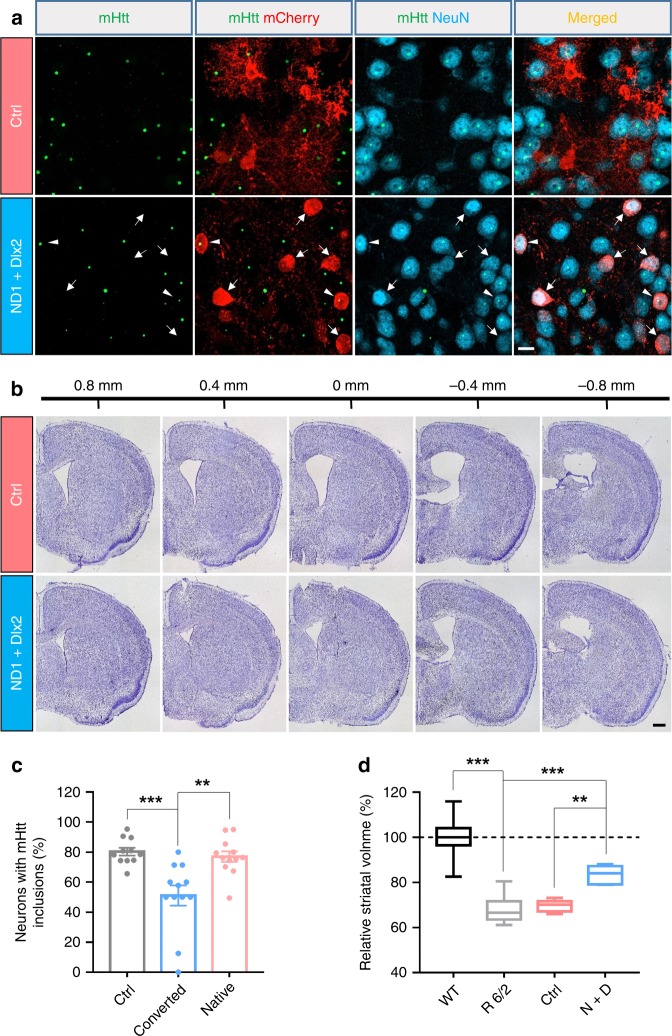
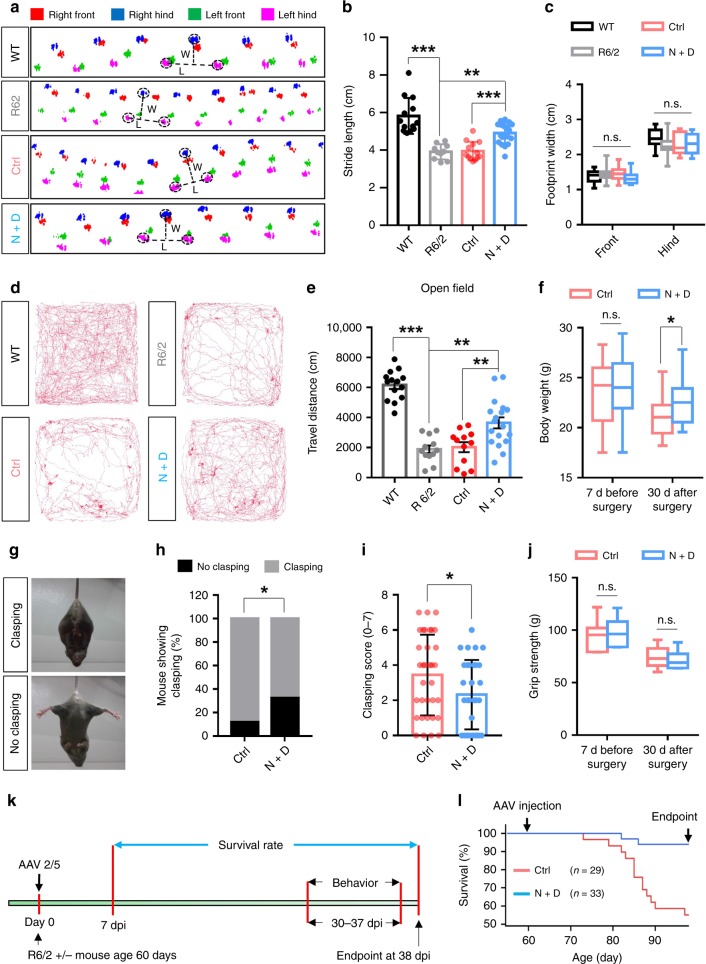
Huntington's disease (HD) is caused by Huntingtin (Htt) gene mutation resulting in the loss of striatal GABAergic neurons and motor functional deficits. We report here an in vivo cell conversion technology to reprogram striatal astrocytes into GABAergic neurons in both R6/2 and YAC128 HD mouse models through AAV-mediated ectopic expression of NeuroD1 and Dlx2 transcription factors. We found that the astrocyte-to-neuron (AtN) conversion rate reached 80% in the striatum and >50% of the converted neurons were DARPP32+ medium spiny neurons. The striatal astrocyte-converted neurons showed action potentials and synaptic events, and projected their axons to the targeted globus pallidus and substantia nigra in a time-dependent manner. Behavioral analyses found that NeuroD1 and Dlx2-treated R6/2 mice showed a significant extension of life span and improvement of motor functions. This study demonstrates that in vivo AtN conversion may be a disease-modifying gene therapy to treat HD and other neurodegenerative disorders.


Conflict of interest statement

Gong Chen is a co-founder of NeuExcell Therapeutics Inc.

Figures

Fig. 1
Fig. 1. Engineered AAV2/5 Cre-FLEx system infects striatal astrocytes specifically in the adult mouse brain.
a Schematic diagram of our engineered AAV2/5 constructs (GFAP::Cre and FLEx-CAG::mCherry-P2A-mCherry) used to target astrocytes specifically with GFAP promoter-controlled expression of Cre recombinase, which in turn will activate the expression of mCherry. b Cre recombinase (red) was detected specifically in GFAP+ astrocytes (green) at 7 days post viral injection (dpi) of AAV2/5-GFAP::Cre. White arrowheads indicate astrocytes with Cre expression. Scale bar: 50 µm. c Tiled confocal image of the striatum after control AAV mCherry injection (top left) (30 dpi), and the overlaid images of mCherry with a variety of glial markers or neuronal marker (NeuN). S100β, GFAP, and glutamine synthetase (GS) are markers for astrocytes; Olig2 for oligodendrocytes; NG2 for NG2 expressing cells; and Iba1 for microglia. Arrowheads indicate some colocalized cells. Scale bar: 0.5 mm for the top tiled low-magnification images, and 50 µm for the high magnification images. d Percentage of mCherry+ cells in colocalization with different cell markers in the striatum. Note that the majority of control mCherry virus-infected cells were astrocytes. Data are shown as mean ± SEM.
Fig. 2
Fig. 2. In vivo conversion of striatal astrocytes into GABAergic neurons in WT mouse brain.
a Coexpression of NeuroD1 (green) and Dlx2 (blue) together with mCherry (red, NeuroD1-p2A-mCherry and Dlx2-P2A-mCherry) in AAV-infected striatal astrocytes (GFAP, cyan) at 7 dpi. b At 30 dpi, NeuroD1 (green) and Dlx2 (blue) coexpressed cells became NeuN+ neurons (cyan). Scale bar for (a) and (b): 20 µm. c Summarized data showing coexpression of NeuroD1 and Dlx2 in striatal astrocytes at 7 dpi, which mostly converted into NeuN+ neurons by 30 dpi (n = 8 mice for 7 dpi, n = 9 mice for 30 dpi), data are shown as mean ± SEM. d Diagram illustrating the astrocyte-to-neuron conversion process induced by NeuroD1 and Dlx2 coexpression. e Representative images illustrating the gradual morphological change from astrocytes to neurons over a time window of 1 month. Note that most mCherry+ cells were co-labeled with GFAP (cyan) at early time points post AAV injection, but later lost GFAP signal and acquired NeuN signal (green). Arrowheads indicate mCherry+ cells that are co-labeled with NeuN. Scale bar: 50 µm. f Time course showing the cell identity (astrocyte vs neuron) among viral infected cells (mCherry+ cells) in the control group (mCherry+ alone, top graph, n = 5 for 7 dpi, n = 8 for 11 dpi, n = 9 for 15 dpi, n = 9 for 21 dpi, and n = 8 for 30 dpi) or NeuroD1 + Dlx2 group (bottom graph, n = 11 for 7 dpi, n = 8 for 11 dpi, n = 7 for 15 dpi, n = 6 for 21 dpi, and n = 10 for 30 dpi). Most of the viral infected cells in the control group were astrocytes, whereas the NeuroD1 + Dlx2-infected cells gradually shifted from mainly astrocytic population to a mixed population of astrocytes and neurons, and then to mostly neuronal population, data are shown as mean ± SD. g Confocal images showing converted neurons co-stained with GAD67, GABA, DARPP32, and parvalbumin (PV) after ectopic expression of NeuroD1 and Dlx2 in striatal astrocytes (30 dpi). Arrowheads indicate co-labeled cells. Scale bar: 20 µm. h Quantified data showing the composition of the astrocyte-converted neurons induced by NeuroD1 and Dlx2 in the striatum. Most of the converted neurons were GABAergic neurons (>80%) and a significant proportion were immunopositive for DARPP32 (55.7%), data are shown as mean ± SEM.
Fig. 3
Fig. 3. Converted neurons originate from astrocytes traced by GFAP::Cre 77.6 transgenic mice.
a, b Experimental timeline (a) and schematic diagram (b) illustrating the use of GFAP::Cre reporter mice to investigate the astrocyte-to-neuron conversion process in the striatum induced by NeuroD1 + Dlx2 (FLEx-NeuroD1-P2A-mCherry and FLEx-Dlx2-P2A-mCherry). c Typical confocal images showing the mCherry+ cells (NeuroD1 + Dlx2) co-stained with GFAP and NeuN at 7 dpi (left column), 28 dpi (middle column), and 56 dpi (right column). Scale bar: 20 µm. Insets show a typical cell with different markers. Scale bar: 4 µm. d Confocal images of mCherry+ cells (NeuroD1 + Dlx2) co-stained with S100β and NeuN at 7, 28, and 56 dpi. Scale bar: 20 µm. Inset scale bar: 4 µm. e, f Quantified data showing a gradual transition from astrocytes to neurons over the time course of 2 months in the GFAP::Cre mice after injection of NeuroD1 and Dlx2 viruses. Note that besides a decrease of astrocytes and an increase of neurons among NeuroD1 and Dlx2-infected cells, about 40% of the infected cells were caught at a transitional stage at 28 dpi, which showed both GFAP-negative and NeuN-negative (e, gray bar) or both S100β-negative and NeuN-negative (f, gray bar). Also note that the time course of astrocyte-to-neuron conversion is slower in GFAP::Cre mice compared with that induced by GFAP::Cre AAV2/5, both in combination with AAV2/5 FLEx-NeuroD1-P2A-mCherry and FLEx-Dlx2-P2A-mCherry. Data are shown as mean ± SD.
Fig. 4
Fig. 4. In vivo conversion of striatal astrocytes into GABAergic neurons in the R6/2 mouse brain.
a The low-magnification coronal sections of the striatum from a pair of littermates of R6/2 mice injected with either control mCherry AAV (left panel) or NeuroD1 plus Dlx2 AAV (right panel) at 30 dpi. Note that the lateral ventricle enlargement was detected clearly in the R6/2 mouse injected with control AAV. Scale bar: 0.5 mm. b Higher-magnification images of mCherry+ cells co-stained with S100β (green) and NeuN (cyan). Arrowheads indicate mCherry+ cells co-labeled with S100β in the control group (top row), but in NeuroD1 plus Dlx2 group became co-labeled with NeuN (bottom row). Scale bar: 20 µm. c Summary of data showing that by 30 dpi, the majority of mCherry+ cells in the control group were S100β+ astrocytes, while in the NeuroD1 plus Dlx2 group most of the mCherry+ cells were converted into NeuN+ neurons. Data are shown as box plot (boxes, 25-75%; whiskers, 10-90%; lines, median). d Most of the striatal astrocyte-converted neurons in the R6/2 mice were immunopositive for GAD67 and GABA. Scale bar: 20 µm. e Many of the converted neurons were co-stained by DARPP32 and a few also co-stained with parvalbumin (PV). Scale bar: 20 µm. f Quantified data showing that >80% of the converted neurons in the striatum of R6/2 mice were immunopositive for GAD67 and GABA, with a significant proportion also immunopositive for DARPP32 (56.6%) and a smaller percentage being PV+ (8.4%), but very few other GABAergic subtypes.
Fig. 5
Fig. 5. Functional characterization of the striatal astrocyte-converted neurons in the R6/2 mouse brain slices.
a Phase and fluorescent images of a native neuron (mCherry, top row) and a converted neuron (mCherry+, bottom row). Scale bar: 10 µm. b Representative traces of Na+-K+ currents recorded in native (gray) and converted neurons (red). c Repetitive action potentials (AP) evoked by step-wise current injections. Note a significant delay to the initial action potential firing upon depolarization stimulation in both native and converted neurons. Such delayed firing is a typical MSN electrophysiological property. d, e Typical traces of sEPSCs and sIPSCs recorded from native (gray traces, top row) and converted neurons (red traces, bottom row). f, g IV plot of Na+-K+ currents recorded from striatal neurons in the viral-injected R6/2 mice and non-treated WT mice. The Na+ currents in both converted (red) and non-converted striatal neurons (gray) in the R6/2 mice were smaller than that recorded from the striatal neurons in the WT mice (black). The K+ current in converted neurons was significantly larger than that in non-converted neurons in the R6/2 mouse striatum (unpaired Student’s t-test). *p < 0.05, **p < 0.01. Data are shown as mean ± SEM. hm Summary graphs in scatter-plot showing electrical properties among the converted (red dots) and non-converted neurons (gray dots) in the R6/2 mice, together with the wild-type neurons (black dots): input resistance (h), capacitance (i), resting membrane potential (j), AP threshold (k), AP amplitude (l), and AP frequency (m). There were no significantly differences between the converted and non-converted neurons in the R6/2 mice, but neurons from R6/2 mice showed some differences from the wild-type neurons. One-way ANOVA with Bonferroni’s post hoc test. nq Summary graphs in scatter-plot showing similar synaptic responses among the wild-type neurons (black dots), and the converted (red dots) and non-converted neurons (gray dots) in the R6/2 mice: sEPSC frequency (n), sEPSC amplitude (o), sIPSC frequency (p), and sIPSC (q). p > 0.4 for all groups, one-way ANOVA with Bonferroni’s post hoc test. r Pie chart showing the percentage of neurons with different firing pattern among the converted neurons.
Fig. 6
Fig. 6. Axonal projections of the striatal astrocyte-converted neurons in the R6/2 mouse brain.
a A sagittal view of a R6/2 mouse brain section immunostained for vGAT (green) and tyrosine hydroxylase (TH, cyan). TH positive cell bodies were present in the substantia nigra (above the SNr) and dense TH innervation was observed in the striatum. Inset shows the mCherry channel only to illustrate the axonal projections from the striatum to the GP and SNr. Scale bar: 1 mm. b High-resolution images showing mCherry+ puncta co-stained with vGAT (arrowhead) in GP and SNr (38 dpi). Scale bar: 2 µm. c Quantified data showing vGAT intensity in the GP and SNr significantly enhanced in NeuroD1 plus Dlx2-treated R6/2 mouse brains. d Experimental design of CTB retrograde tracing of converted neurons in the R6/2 mouse brain. Mice were sacrificed for immunohistochemistry analysis at 7 days after CTB injection. e Retrograde tracing of striatal astrocyte-converted neurons by injecting CTB into the GP at 21 or 30 days after AAV2/5 NeuroD1 + Dlx2 injection. Few CTB (green)-labeled converted neurons (red) were detected in the striatum at 21 dpi group (arrowhead), but many more CTB-labeled converted neurons were observed at 30 dpi group (arrowheads). f CTB injection into the SNr to trace striatal astrocyte-converted neurons. Even fewer converted neurons were labeled by CTB at 21 dpi group, but CTB labeling was clearly identified among the converted neurons in the striatum at 30 dpi group (arrowheads). Note that, in both GP (e) and SNr (f), many non-converted preexisting neurons were retrograde labeled by CTB, as expected. Scale bar for (e) and (f): 20 µm. g Bar graphs showing the percentage of CTB-labeled converted neurons in the R6/2 mouse striatum, which showed a significant increase from 21 dpi (black bars, immature neurons) to 30 dpi (red bars, more mature neurons). *p < 0.05, **p < 0.01, unpaired Student’s t-test. Data are shown as box plot (boxes, 25-75%; whiskers, 10-90%; lines, median).
Fig. 7
Fig. 7. Reducing striatum atrophy in the R6/2 mice after in vivo astrocyte-to-neuron conversion.
a Reduction of mHtt inclusions in the striatal astrocyte-converted neurons in the R6/2 mice. The mHtt aggregates (green dots) were detected in most of the striatal neurons (NeuN, cyan), but some NeuroD1 plus Dlx2-converted neurons (red, pointed by arrows) showed no mHtt aggregates. Arrowheads indicate two converted neurons (mCherry+) with mHtt inclusions. Scale bar: 10 µm. b Assessing striatum atrophy by Nissl staining of serial coronal sections of the R6/2 mouse brain, treated with control mCherry virus alone (top row) or with NeuroD1 plus Dlx2 AAV (bottom row). Scale bar: 0.5 mm. c Quantified data showing that the percentage of neurons with mHtt inclusions in converted neurons was significantly lower compared with their neighboring native neurons or the striatal neurons in the control virus-treated group. Data are shown as mean ± SEM. d Summary graphs of the relative striatum volume (normalized to the WT) among R6/2 mice (P90–97), R6/2 mice treated with control viruses, and R6/2 mice treated with NeuroD1 plus Dlx2 viruses. Striatal atrophy was clearly detected in the R6/2 mice (P90–97), but partially rescued by NeuroD1 plus Dlx2 treatment. Data are shown as box plot (boxes, 25-75%; whiskers, 10-90%; lines, median). **p < 0.01, ***p < 0.001, one-way ANOVA with Bonferroni’s post hoc test.
Fig. 8
Fig. 8. Functional improvement of the R6/2 mice following in vivo cell conversion.
a Representative footprint tracks among wild-type littermates, R6/2 mice, R6/2 mice treated with control viruses or NeuroD1 + Dlx2 viruses. Dashed lines indicate stride length (L) and width (W). b, c Quantified data of stride length (b) and width (c) among different groups. The stride length decreased in R6/2 mice, but partially rescued by NeuroD1 plus Dlx2 treatment (one-way ANOVA with Bonferroni’s post hoc test). d Representative tracks showing locomotor activity in the open field test (20 min) among different groups. e Quantified data showing the total travel distance reduced in R6/2 mice but partially improved by NeuroD1 plus Dlx2 treatment (one-way ANOVA with Bonferroni’s post hoc test). **p < 0.01, ***p < 0.001. f Average body weight of R6/2 mice at 7 days before surgery and 30 days after surgery (viral injection). NeuroD1 plus Dlx2-treated R6/2 mice showed less body weight loss than the control virus-treated mice at 30 dpi (*p < 0.05, unpaired Student’s t-test). Mouse number in each group is labeled in each bar. g Typical clasping (top) and non-clasping (bottom) phenotype in the R6/2 mice. h The percentage of mice showing clasping phenotype was decreased in NeuroD1 plus Dlx2-treated R6/2 mice (*p < 0.05, 2-sided Pearson Chi-square test). i The average clasping score was also significantly reduced by NeuroD1 plus Dlx2 treatment (*p < 0.05, unpaired Student’s t-test). Mouse number in each group is labeled in the bar. j The grip strength of R6/2 mice did not change following NeuroD1 plus Dlx2 treatment. k Experimental diagram showing survival rate calculation from 7 days post-surgery to 38 days post surgery (endpoint mouse age: P98). Mice that died between 7 and 38 dpi were recorded. Behavioral tests were conducted between 30–37 dpi. l Kaplan–Meier survival graph showing that 13 out of 29 R6/2 mice died in the control virus group, whereas only 2 out of 33 R6/2 mice died in the NeuroD1 plus Dlx2 treatment group (p < 0.001, 2-sided Pearson Chi-square test). Data are shown as mean ± SEM in panel b, e and i. Data in panel ec, f and j are shown as box plot (boxes, 25-75%; whiskers, 10-90%; lines, median).

References

    1. Bates, G. P. et al. Huntington disease. Nat. Rev. Dis. Primers1, 15005 (2015). - PubMed
    1. Macdonald ME, et al. A novel gene containing a trinucleotide repeat that is expanded and unstable on Huntingtons-disease chromosomes. Cell. 1993;72:971–983. doi: 10.1016/0092-8674(93)90585-E. - DOI - PubMed
    1. Mangiarini L, et al. Exon 1 of the HD gene with an expanded CAG repeat is sufficient to cause a progressive neurological phenotype in transgenic mice. Cell. 1996;87:493–506. doi: 10.1016/S0092-8674(00)81369-0. - DOI - PubMed
    1. Reinius B, et al. Conditional targeting of medium spiny neurons in the striatal matrix. Front Behav. Neurosci. 2015;9:71. doi: 10.3389/fnbeh.2015.00071. - DOI - PMC - PubMed
    1. Rikani AA, et al. The mechanism of degeneration of striatal neuronal subtypes in Huntington disease. Ann. Neurosci. 2014;21:112–114. doi: 10.5214/ans.0972.7531.210308. - DOI - PMC - PubMed

Publication types

MeSH terms