. 2020 Feb 27;10(1):3573.
doi: 10.1038/s41598-020-60557-7.

The effect of sediment grain properties and porewater flow on microbial abundance and respiration in permeable sediments

Affiliations

The effect of sediment grain properties and porewater flow on microbial abundance and respiration in permeable sediments

Soeren Ahmerkamp et al. Sci Rep. .

Abstract

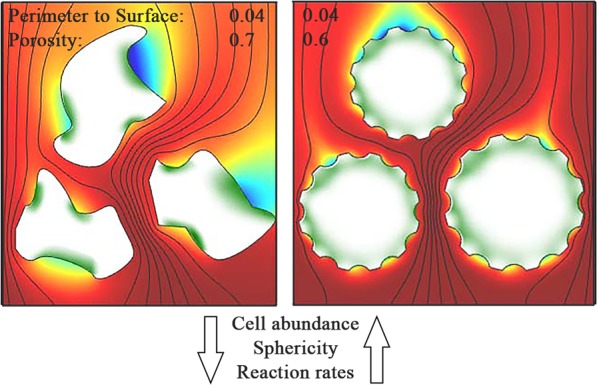
Sandy sediments cover 50-60% of the continental shelves and are highly efficient bioreactors in which organic carbon is remineralized and inorganic nitrogen is reduced to N2. As such they seem to play an important role, buffering the open ocean from anthropogenic nitrogen inputs and likely remineralizing the vast amounts of organic matter formed in the highly productive surface waters. To date however, little is known about the interrelation between porewater transport, grain properties and microbial colonization and the consequences for remineralization rates in sandy sediments. To constrain the effect of theses factors on remineralization in silicate sands, we incubated North Sea sediments in flow-through reactors after separating into five different grain size fractions. Bulk sediment and sediment grain properties were measured along with microbial colonization and cell abundances, oxygen consumption and denitrification rates. Volumetric oxygen consumption ranged from 14 to 77 µmol O2 l-1 h-1 while nitrogen-loss via denitrification was between 3.7 and 8.4 µmol N l-1 h-1. Oxygen consumption and denitrification rates were linearly correlated to the microbial cell abundances, which ranged from 2.9 to 5.4·108 cells cm-3. We found, that cell abundance and consumption rates in sandy sediments are influenced (i) by the surface area available for microbial colonization and (ii) by the exposure of these surfaces to the solute-supplying porewater flow. While protective structures such as cracks and depressions promote microbial colonization, the oxygen demand is only met by good ventilation of these structures, which is supported by a high sphericity of the grains. Based on our results, spherical sand grains with small depressions, i.e. golf ball like structures, provide the optimal supporting mineral structure for microorganisms on continental shelves.


Conflict of interest statement

The authors declare no competing interests.

Figures

Figure 1
Figure 1
Scanning electron micrographs of the microbial colonization of a single sand grain. (a) Shows a quartz sand grain with undefined material (grey) in cracks and depressions and the mineral surface in yellow. (be) Magnifications of the cracks and depressions reveal a dense microbial colonization (magenta) with different attachment methods: e.1 shows a round shaped bacterium with pili, e.2 others attach themselves vertically or produce nets of polymers (see also).
Figure 2
Figure 2
(a,b) cell abundances are not significantly correlated with median grain size nor with total organic carbon content (R2 < 0.2). (c) Sphericity (Sp) and cell abundance show a positive correlation (R2 = 0.65) indicating that a more spherical grain shape promotes colonization. (d) The cell abundances correlate to the measured surface-to-volume ratio following a powerlaw (R2 = 0.93). (e) The correlation is linear when normalizing the surface-to-volume ratio by the porosity (R2 = 0.99). (f) Cell abundances are directly correlated to the volumetric rates of oxygen respiration (R = 7⋅10−7 cells − 10.5, R2 = 0.95) and denitrification (RDen = 2⋅10−8 − 1.5, R2 = 0.95), based on a porewater velocity of 8-10 cm h−1. Notice, the denitrification rates are scaled by a factor of 8.625, i.e. Redfield ratio 138:16, see text for more information. In f, the error bar denotes the residual deviation from the linear trend shown in Fig. 4 for oxygen and range of denitrification measurements.
Figure 3
Figure 3
(a) The oxygen respiration rates and denitrification rates are shown against the surface-to-volume ratios normalized by the porosity. The oxygen respiration rates presented are based on a porewater velocity of 8–10 cm h−1. The error bar denotes the residual deviation from the linear trend shown in Fig. 4 for oxygen and range of denitrification measurements. (b) Also the NOx production rates follow a similar slope and are only slightly smaller compared to the denitrification rates. The trends of the production and consumption rates are well represented by linear fit (R = 23.2 SV θ−1 + 18.0, R2 = 0.92 for oxygen respiration, for denitrification RDen = 3.2 SV θ−1 + 2.5, R2 = 0.92 and PNOx = 2.3 SV θ−1 + 1.8, R2 = 0.80 for NOX production).
Figure 4
Figure 4
(a) The increasing respiration rates (R) are shown against the porewater velocity (U). Measurements where oxygen was completely consumed within the core, or which are affected by dispersion (i.e. Da >1), are shown as open symbols. For the remaining measurements the respiration rates increase linearly with the imposed porewater velocity. (b) The equations for the linear regression are shown. (c) By normalizing the respiration to single cells (assuming oxygen respiration by every cell) respiration rates coincide (R2 > 0.90 for all equations). The porewater velocity is scaled by the porosity to the Darcy velocity which leads to a coinciding critical Darcy velocity around 2 cm h−1.
Figure 5
Figure 5
Schematic illustration indicating the microbial colonization and oxygen distribution in the pore space of sandy sediments for grains with different sphericity. Red indicates oxic volumes, blue indicates anoxic volumes and green indicates microbial colonization. The perimeter to surface area ratio is the same between the two cases, but porosity is decreased from 0.7 (left) to 0.6 (right). Based on our results, golf-ball like structures with higher sphericity are better ventilated and thus facilitate microbial colonization. Notice, under in situ conditions the porewater flow is highly dynamic and regions of oxia/anoxia might vary.

References

    1. Huettel M, Berg P, Kostka JE. Benthic exchange and biogeochemical cycling in permeable sediments. Annual Review of Marine Science, 2014;6:23–51. doi: 10.1146/annurev-marine-051413-012706. - DOI - PubMed
    1. Boudreau BP, et al. Permeable marine sediments: overturning an old paradigm. EOS, Transactions American Geophysical Union. 2001;82:133–136. doi: 10.1029/EO082i011p00133-01. - DOI
    1. Santos IR, Eyre BD, Huettel M. The driving forces of porewater and groundwater flow in permeable coastal sediments: A review. Estuarine, Coastal and Shelf Science. 2012;98:1–15. doi: 10.1016/j.ecss.2011.10.024. - DOI
    1. Ahmerkamp Soeren, Winter Christian, Krämer Knut, Beer Dirk de, Janssen Felix, Friedrich Jana, Kuypers Marcel M. M., Holtappels Moritz. Regulation of benthic oxygen fluxes in permeable sediments of the coastal ocean. Limnology and Oceanography. 2017;62(5):1935–1954. doi: 10.1002/lno.10544. - DOI
    1. Marchant HK, et al. Coupled nitrification–denitrification leads to extensive N loss in subtidal permeable sediments. Limnology and Oceanography. 2016;61:1033–1048. doi: 10.1002/lno.10271. - DOI

Publication types