. 2020 Feb 27;10(1):3584.
doi: 10.1038/s41598-020-60465-w.

Anak Krakatau triggers volcanic freezer in the upper troposphere

Affiliations

Anak Krakatau triggers volcanic freezer in the upper troposphere

A T Prata et al. Sci Rep. .

Erratum in

Abstract

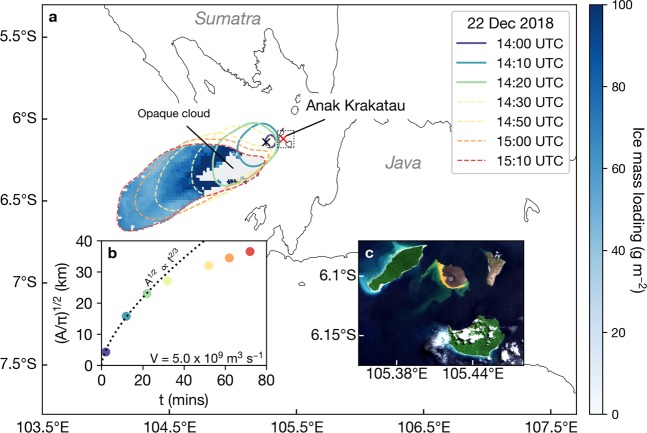
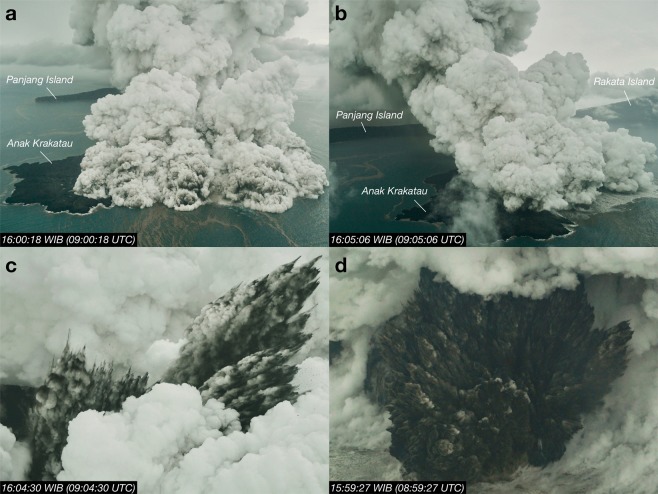
Volcanic activity occurring in tropical moist atmospheres can promote deep convection and trigger volcanic thunderstorms. These phenomena, however, are rarely observed to last continuously for more than a day and so insights into the dynamics, microphysics and electrification processes are limited. Here we present a multidisciplinary study on an extreme case, where volcanically-triggered deep convection lasted for six days. We show that this unprecedented event was caused and sustained by phreatomagmatic activity at Anak Krakatau volcano, Indonesia during 22-28 December 2018. Our modelling suggests an ice mass flow rate of ~5 × 10⁶ kg/s for the initial explosive eruption associated with a flank collapse. Following the flank collapse, a deep convective cloud column formed over the volcano and acted as a 'volcanic freezer' containing ~3 × 10⁹ kg of ice on average with maxima reaching ~1010 kg. Our satellite analyses reveal that the convective anvil cloud, reaching 16-18 km above sea level, was ice-rich and ash-poor. Cloud-top temperatures hovered around -80 °C and ice particles produced in the anvil were notably small (effective radii ~20 µm). Our analyses indicate that vigorous updrafts (>50 m/s) and prodigious ice production explain the impressive number of lightning flashes (~100,000) recorded near the volcano from 22 to 28 December 2018. Our results, together with the unique dataset we have compiled, show that lightning flash rates were strongly correlated (R = 0.77) with satellite-derived plume heights for this event.


Conflict of interest statement

The authors declare no competing interests.

Figures

Figure 1
Figure 1
Umbrella spread analysis of the initial explosive phase of the Anak Krakatau eruption. (a) Umbrella spread of the initial plume with Himawari-8 ice mass loading retrievals (blue shading) plotted underneath. Coloured contours indicate Himawari-8 11.2 μm brightness temperature isotherms (245 K with gaussian filter) at 10 minute intervals. Dashed contours indicate times when the plume is considered to be detached. The red ‘x’ indicates parallax corrected location of the minimum cloud-top temperature at 14:00 UTC (black ‘x’ denotes uncorrected location ~15 km from the volcano). Note that 14:40 UTC is a ‘house-keeping’ time (data are not recorded by the Himawari-8 sensor at this time). Ice mass retrievals are only shown for pixels inside the isoline at 15:10 UTC. (b) Change in average radius with time (t) in minutes after the plume begins spreading at the NBL (inferred to be 13:58 UTC on 22 December 2018). Dashed line shows a non-linear least-squares fit to the first three data points (when the plume is considered to be feeding the umbrella cloud) using the Woods and Kienle model (V is the volumetric flow rate). Coloured dots correspond to observation times shown in the legend. (c) Atmospherically-corrected (using the Sen2Cor algorithm) true colour Sentinel-2 image (02:56 UTC, 31 March 2019) showing the remnant edifice of Anak Krakatau after the sustained convective eruption. Maps and satellite imagery were generated and processed by the authors using Matplotlib 3.0.3 and Python 3.6.7 (https://www.python.org/).
Figure 2
Figure 2
Anatomy of the Anak Krakatau convective anvil plume. (a) Atmospherically-corrected true colour MODIS-Terra observation at 03:05 UTC on 23 December 2018 (processed using the SatPy package). Darwin VAAC (Volcanic Ash Advisory Center) volcanic ash advisory (VAA) from surface (SFC) to flight level 550 (FL550; 55,000 ft) at 02:45 UTC on 23 December is over-plotted. (b) Same as (a) but for MODIS-Terra 11.0 μm channel. (c) Same as (b) but for the level 2 cloud product (MOD06) of ice particle effective radius using the combined 1.6 and 2.1 μm retrieval. (d) Himawari-8 thermal infrared ice particle effective radius retrieval using channels 8.6 and 11 μm (see Methods) at 03:00 UTC on 23 December 2018 (with MODIS true colour under-plotted). (e) TROPOMI SO2 retrieval (product shown is for a 1 km box vertical profile centred on 15 km asl and 7 × 3.5 km2 horizontal resolution) at 07:05 UTC on 23 December 2018. (f) Histograms of the 1.6–2.1 μm (MODIS) and 8.6–11.2 μm (Himawari-8) retrievals shown in (c,d) respectively. All histograms correspond to retrievals inside the VAA polygon (shown in a). Maps and satellite imagery were generated and processed by the authors using Matplotlib 3.0.3 and Python 3.6.7 (https://www.python.org/).
Figure 3
Figure 3
Aerial photographs of the Anak Krakatau eruption on 23 December 2018. (a,b) show two angles of the sprawling phreatomagmatic cloud. Plume extends toward the east over Panjang Island. (c,d) Cock’s tail jets characteristic of Surtseyan volcanic activity. All photographs used with permission from the copyright owner Dicky Adam Sidiq/kumparan.
Figure 4
Figure 4
Time series of the Anak Krakatau convective plume. (a) Himawari-8 11.2 μm minimum brightness temperatures (blue line with dots) from 12:00–18:30 UTC (22 December 2018) in a 0.25° × 0.25° latitude/longitude box centred over Anak Krakatau. (b) Same as (a) but from 12:00 UTC 22 December 2018 to 12:00 UTC 28 December 2018. Red dots indicate MODIS minimum brightness temperatures. Black and green dots indicate minimum temperatures from Jakarta airport (6.11 °S, 106.65 °E; accessed from http://weather.uwyo.edu/upperair/) and Radio Occultation (RO) soundings, respectively. (c) FPLUME modelled water vapour, liquid and ice mass mixing ratio profiles with NBL (see Methods for definition) plotted as dashed line (also shown on d). ERA5 atmospheric profile at 12:00 UTC on 22 December 2018 was used in the model. Shaded horizontal area indicates lapse rate tropopause ± standard deviation (σ) according to ERA5 data and RO soundings (also shown on d and e). (d) FPLUME updraft velocity profile (shares left axis with c). (e) Plume height time series. Purple line indicates heights estimated using total flash rate at 10 minute intervals. Orange line indicates heights derived from Himawari-8. Green triangles and squares indicate retrieved SO2 heights from IASI-A and B, respectively. All heights correspond to left axis of (c). Bottom grey shaded histograms indicate flash rates (CG = cloud-to-ground and IC = intracloud; right black axis; black y-label). Blue line indicates ice mass loadings derived from Himawari-8 at hourly intervals (mean retrieval error, ±1.8 × 109 kg, indicated by floating blue error bar). Circles with error bars indicate ice mass loadings from MODIS (Aqua and Terra) retrieved from NIR measurements (right blue axis; blue y-label).
Figure 5
Figure 5
Thermodynamic skew-T diagrams for increases in surface parcel temperature and moisture. Red and green lines indicate environmental temperature and dew point temperature, respectively, for a Jakarta airport sounding at 12:00 UTC on 22 December 2018 (accessed from: http://weather.uwyo.edu/upperair/). Orange solid lines indicate environmental parcel profiles (CAPE shaded in orange, Convective inhibition shaded in blue). Dashed black lines indicate theoretical parcel profiles for surface parcels with varying amounts of added heat and moisture (ad). Lower and upper black dots indicate the lifted condensation level (LCL) and equilibrium level (EL), respectively. Red shaded area indicates increases in CAPE due to added surface heat and moisture (i.e. volcanic-CAPE). Maximum theoretical updraft velocities (wCAPE) are also annotated on each panel. Wind barbs shown on right side of each panel indicate wind speed and direction.

References

    1. Trier, S. B. CONVECTIVE STORMS|Convective Initiation. In Encyclopedia of Atmospheric Sciences, 560–570, 10.1016/B0-12-227090-8/00122-6 (Elsevier, 2003).
    1. Oswalt, J., Nichols, W. & O’Hara, J. Meteorological observations of the 1991 Mount Pinatubo eruption. Fire Mud Erupt. Lahars Mt. Pinatubo Philipp. 625–636 (1996).
    1. Mayberry GC, Rose WI, Bluth GJS. Dynamics of volcanic and meteorological clouds produced on 26 December (Boxing Day) 1997 at Soufrière Hills Volcano, Montserrat. Geol. Soc. Lond. Mem. 2002;21:539. doi: 10.1144/GSL.MEM.2002.021.01.24. - DOI
    1. Tupper, A., Oswalt, J. & Rosenfeld, D. Satellite and radar analysis of the volcanic-cumulonimbi at Mount Pinatubo, Philippines, 1991. J. Geophys. Res. 110, 10.1029/2004JD005499 (2005).
    1. Glaze LS, Baloga SM. Sensitivity of buoyant plume heights to ambient atmospheric conditions: Implications for volcanic eruption columns. J. Geophys. Res. Atmos. 1996;101:1529–1540. doi: 10.1029/95JD03071. - DOI