. 2020 Apr 17;48(7):3496-3512.
doi: 10.1093/nar/gkaa088.

HDAC3 functions as a positive regulator in Notch signal transduction

Affiliations

HDAC3 functions as a positive regulator in Notch signal transduction

Francesca Ferrante et al. Nucleic Acids Res. .

Abstract

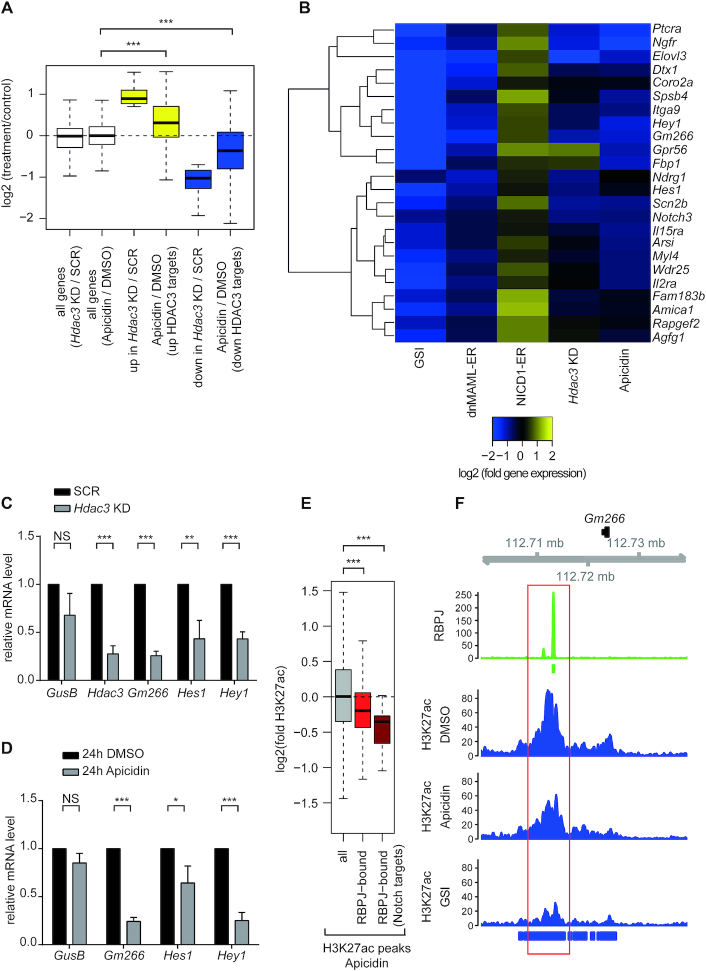
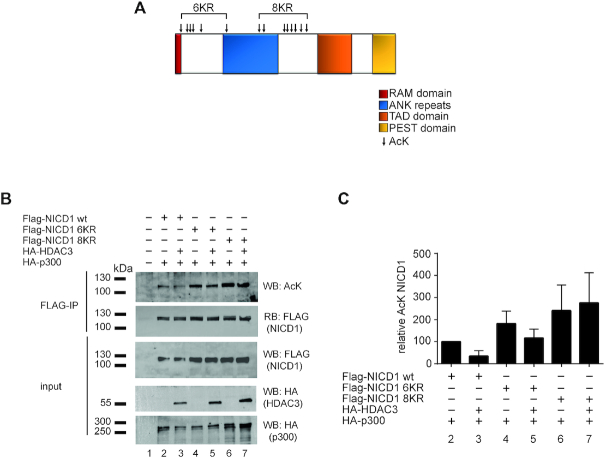
Aberrant Notch signaling plays a pivotal role in T-cell acute lymphoblastic leukemia (T-ALL) and chronic lymphocytic leukemia (CLL). Amplitude and duration of the Notch response is controlled by ubiquitin-dependent proteasomal degradation of the Notch1 intracellular domain (NICD1), a hallmark of the leukemogenic process. Here, we show that HDAC3 controls NICD1 acetylation levels directly affecting NICD1 protein stability. Either genetic loss-of-function of HDAC3 or nanomolar concentrations of HDAC inhibitor apicidin lead to downregulation of Notch target genes accompanied by a local reduction of histone acetylation. Importantly, an HDAC3-insensitive NICD1 mutant is more stable but biologically less active. Collectively, these data show a new HDAC3- and acetylation-dependent mechanism that may be exploited to treat Notch1-dependent leukemias.


Figures

Figure 1.
Figure 1.
HDAC3 is a positive regulator of the Notch-dependent gene expression program. (A) Box plot showing the effects of HDAC3 loss-of-function (LoF) by shRNA-mediated knockdown or apidicin treatment on the transcriptome of Beko cells. Beko cells were infected with shRNAs directed against Hdac3 (Hdac3 KD) or scramble (SCR) as control or, alternatively, treated for 24 h with 0.01 μg/ml apicidin or DMSO as control. Upon RNA purification, samples were analyzed by RNA-Seq. Genes up- or downregulated by infection of shRNAs against Hdac3 or apicidin treatment were identified based on log2FC bigger than 0.7 or smaller than –0.7, respectively and adjusted P-value <0.05. Statistical analysis was performed by using the Wilcoxon signed rank test (***P < 0.001). White boxes are representative of all the genes in Hdac3 KD versus scramble (SCR) control or in apicidin versus DMSO control. Yellow and blue boxes indicate up- and downregulated genes, respectively. Up- and downregulated genes upon Hdac3 KD are labeled as ‘up in Hdac3 KD/SCR’ and ‘down in Hdac3 KD/SCR’, respectively. Effects of apicidin treatment are shown for both up- and downregulated HDAC3 targets [‘Apicidin / DMSO (upregulated HDAC3 targets)’ and ‘Apicidin / DMSO (downregulated HDAC3 targets)’]. (B) Heat map showing the effects of HDAC3 LoF at Notch target genes. Notch target genes were identified by analyzing the transcriptome of Beko cells upon inhibition of Notch signaling with γ-secretase inhibitor (GSI) DAPT and analyzing microarray data from Beko cells overexpressing an inducible dominant negative MAML mutant (dnMAML-ER) or an inducible NICD1 (NICD1-ER). Beko cells were treated for 24 h with 10 μg/ml GSI or DMSO as control. (C and D) HDAC3 LoF by (C) shRNA-mediated knockdown or (D) apidicin treatment leads to downregulation of Notch target genes. Beko cells were infected with shRNAs directed against Hdac3 (Hdac3 KD) or scramble (SCR) as control (C) or, alternatively, treated for 24 h with 0.01 μg/ml apicidin or DMSO as control (D). Upon RNA extraction and reverse transcription, cDNAs were analyzed by qPCR using primers specific for GusB, Gm266, Hes1, Hey1 or, in the case of the shRNA-mediated knockdown, Hdac3. Data were normalized to the housekeeping gene Hypoxanthine Guanine Phosphoribosyltransferase (HPRT). Shown is the mean ± SD of three independent experiments (*P < 0.05, **P < 0.01, ***P < 0.001, [NS] not significant, unpaired Student's t-test). (E and F) Apidicin treatment leads to reduced H3K27ac at the RBPJ binding sites in Beko cells. (E) Apicidin treatment leads to reduced H3K27ac at the RBPJ-bound genomic sites. Beko cells were treated for 24 h with 0.01 μg/ml apicidin or DMSO as control and the effects on H3K27ac were investigated by ChIP-Seq comparing all H3K27ac sites with those overlapping RBPJ binding sites and RBPJ-bound Notch targets as shown in the A panel (Wilcoxon rank sum tests P = 9.72e−56 and P = 1.43e−03, respectively, ***P < 0.001). (F) Genome browser snapshot of RPKM-normalized coverage profiles showing the effects of apicidin or GSI treatment on H3K27ac at the RBPJ-bound enhancer of Notch target gene Gm266 in Beko cells. DMSO-treated cells were used as control. Bars mark significantly bound regions as detected by Macs2/peakranger (RBPJ; green) and Macs2 (H3K27ac; blue).
Figure 2.
Figure 2.
HDAC3 stabilizes NICD1 via deacetylation. (A) Apicidin treatment leads to decreased NICD1 protein level. Beko cells were treated for 24 h with 0.01 μg/ml apicidin or DMSO as control and the whole cell extract (WCE) was analyzed by western blotting versus the endogenous cleaved NICD1 protein or GAPDH as loading control. (B) Apicidin treatment destabilizes the NICD1 protein. Beko cells were treated for 24 h with 0.01 μg/ml apicidin or DMSO as control and, after the first 18 h, protein synthesis was blocked by adding 50 μg/ml cycloheximide (CHX). Samples were collected at the indicated time points. WCE was analyzed by western blotting versus endogenous cleaved NICD1 or GAPDH as loading control. Quantification of the NICD1 levels normalized to GAPDH is shown on the right. The experiment was repeated independently three times. (C) HDAC3 deacetylates NICD1. 293T cells were transfected with plasmids encoding Flag-tagged NICD1 wildtype (Flag-NICD1 wt), HA-tagged HDAC3 (HA-HDAC3) or HA-tagged p300 (HA-p300). WCE were subjected to FLAG immunoprecipitation (FLAG-IP) and the immunoprecipitates were analyzed by western blotting using an acetylated-lysine antibody (AcK) and reblotted (RB) using a Flag antibody.
Figure 3.
Figure 3.
HDAC3 deacetylates specific lysine residues within the NICD1. (A) Schematic representation of the lysine residues that are acetylated within the Notch-1 Intracellular Domain (NICD1). Arrows indicate the position of the acetyl-lysines that have been mutated to arginines (R) in the case of the 6KR or 8KR mutants. (B and C) HDAC3 controls the acetylation of eight lysine residues. 293T cells were transfected with plasmids encoding Flag-tagged NICD1 wildtype (Flag-NICD1 wt), Flag-tagged NICD1 6KR mutant (Flag-NICD1 6KR), Flag-tagged NICD1 8KR mutant (Flag-NICD1 8KR), HA-tagged HDAC3 (HA-HDAC3) and/or HA-tagged p300 (HA-p300). WCE were subjected to FLAG immunoprecipitation (FLAG-IP) and the immunoprecipitates were analyzed by Western blotting using an acetylated-lysine antibody (AcK) and reblotted (RB) using a FLAG antibody. Quantification of the AcK levels within the NICD1 proteins is shown in C. Shown is the AcK signal normalized to the total immunoprecipitated NICD1 as percentage relative to the NICD1 wt. The experiment was repeated independently four times.
Figure 4.
Figure 4.
The NICD1 8KR mutant is more stable and less ubiquitinated compared to the NICD1 wt. (A) The NICD1 8KR mutant is more stable compared to the NICD1 wt. Beko cells expressing the biotin ligase BirA, were infected with plasmids encoding BioFlag-NICD1 wildtype (BioNICD1 wt), BioFlag-NICD1 8KR mutant (BioNICD1 8KR) or empty vector as control (Ctrl) and treated with 50 μg/ml of cycloheximide (CHX) for the hours indicated in the figure. WCE was analyzed by STREPTAVIDIN blotting to detect the BioNICD1 wt and 8KR mutant proteins or Western blotting versus GAPDH as loading control. Quantification of the BioNICD1 wt and 8KR mutant levels normalized to GAPDH is shown on the right. The experiment was repeated independently three times. (B, C) The NICD1 8KR mutant is less ubiquitinated compared to the NICD1 wt. (B) Phoenix™ cells were transfected with plasmids encoding Flag-tagged NICD1 wildtype (Flag-NICD1 wt), Flag-tagged NICD1 8KR mutant (Flag-NICD1 8KR) or HA-tagged ubiquitin (HA-Ub) and treated with 20 μM of proteasome inhibitor MG132. WCE were subjected to FLAG immunoprecipitation (FLAG-IP) and the immunoprecipitates were analyzed by Western blotting using an HA antibody and reblotted (RB) with a FLAG antibody. (C) The NICD1 8KR mutant is less ubiquitinated compared to the NICD1 wt. PhoenixTM cells were transfected with plasmids encoding Flag-tagged NICD1 wildtype (Flag-NICD1 wt) or Flag-tagged NICD1 8KR mutant (Flag-NICD1 8KR) and treated with 20 μM of proteasome inhibitor MG132. WCE were analyzed by western blotting using a FLAG antibody or GAPDH as loading control. (D) NICD1 wt is more active compared to NICD1 8KR mutant. Transcriptional activity of N1ΔE wt or N1ΔE 8KR mutant was tested in luciferase assays using the RBPJ-dependent reporter construct pGA891/6. Mean values ± SD (error bars) from six independent experiments are shown ([**] P = 0.003, [***] P < 0.0001, unpaired Student's t-test).
Figure 5.
Figure 5.
The NICD1 8KR mutant shows decreased biological activity compared to the NICD1 wt in vivo. (A) The eight lysine residues of NICD1, regulated by HDAC3, are evolutionary conserved. T-Coffee alignment of human (H. sapiens, NP_060087.3), mouse (M. musculus, NP_032740.3), frog (X. laevis, NP_001081074.1) and zebrafish (D. rerio, NP_571377.2) NOTCH1 proteins. The grey boxes indicate the eight lysine residues regulated by HDAC3. (B) The NICD1 8KR mutant is less active compared to the NICD1 wt in zebrafish. Zebrafish embryos were injected with cDNA encoding for the membrane bound Notch1ΔE wt (N1ΔE wt) or 8KR (N1ΔE 8KR) mutant. A reporter plasmid where the GFP-encoding gene is under the control of a Notch-dependent promoter was co-injected to monitor the NICD1 activity. (C) Quantification of malformed embryos shown in b. Shown are the means ± SD of the total number of embryos analyzed (n) in five independent experiments (N). **P < 0.001 (nonparametric Mann–Whitney rank sum test).
Figure 6.
Figure 6.
HDAC3 is highly expressed in human leukemic patient cells and apicidin treatment leads to reduced NICD1 protein levels in human leukemia cell lines. (A) HDAC3 expression is elevated in T-ALL patient samples compared to different sorted normal T-cell populations. Microarray data (GSE33469 and GSE33470) were analyzed to investigate the expression of HDAC3 in T-ALL patient samples and different sorted normal T-cell populations that represent different stages of T-cell development. Statistical analysis was performed with the Wilcoxon signed-rank test (*P < 0.05, **P < 0.01). (B) HDAC3 expression is increased in T-ALL pediatric samples compared to normal bone marrow (BM) cells. Microarray data (GSE26713) were analyzed to investigate the expression of HDAC3 in T-ALL pediatric samples and in normal bone marrow (BM) cells. Statistical analysis was performed with the Wilcoxon signed-rank test (**P < 0.01). (C) HDAC3 expression is increased in CLL B-cells compared to normal B-cells. Microarray data (GSE31048) were analyzed to investigate the expression of HDAC3 in CLL B-cells and normal B-cells. Statistical analysis was performed with the Wilcoxon signed-rank test (**P < 0.01). (D) HDAC3 expression is elevated in CLL compared to other proliferative tissues and mantle cell lymphoma. Microarray data (GSE32018) were analyzed to investigate the expression of HDAC3 in CLL, lymph node, reactive tonsils and other lymphomas. Statistical analysis was performed with the Wilcoxon signed-rank test (**P < 0.01, ***P < 0.001, [NS] not significant, unpaired Student's t-test). (E) Apicidin treatment leads to decreased NICD1 protein level in CUTLL1 cells. CUTLL1 T-ALL cells were treated for 24 h with different concentrations of apicidin (0.05 or 10 μg/ml) or DMSO as control and the whole cell extract (WCE) was analyzed by western blotting versus the endogenous cleaved NICD1 protein or TBP as loading control. (F) Apicidin treatment leads to decreased NICD1 protein level in REC-1 cells. REC-1 mantle cell lymphoma (MCL) cells were treated for 24 h with different concentrations of apicidin (0.05, 1 or 10 μg/ml) or DMSO as control and the whole cell extract (WCE) was analyzed by western blotting versus the endogenous cleaved NICD1 protein or TBP as loading control.

References

    1. Radtke F., MacDonald H.R., Tacchini-Cottier F.. Regulation of innate and adaptive immunity by Notch. Nat. Rev. Immunol. 2013; 13:427–437. - PubMed
    1. Rothenberg E.V. Transcriptional control of early T and B cell developmental choices. Annu. Rev. Immunol. 2014; 32:283–321. - PMC - PubMed
    1. Koch U., Radtke F.. Notch and cancer: a double-edged sword. Cell Mol. Life Sci. 2007; 64:2746–2762. - PMC - PubMed
    1. Aster J.C., Pear W.S., Blacklow S.C.. The varied roles of notch in cancer. Annu. Rev. Pathol. 2017; 12:245–275. - PMC - PubMed
    1. Roy M., Pear W.S., Aster J.C.. The multifaceted role of Notch in cancer. Curr. Opin. Genet. Dev. 2007; 17:52–59. - PubMed

Publication types