. 2020 Sep 29;22(9):1388-1398.
doi: 10.1093/neuonc/noaa044.

Resting-state fMRI detects alterations in whole brain connectivity related to tumor biology in glioma patients

Affiliations

Resting-state fMRI detects alterations in whole brain connectivity related to tumor biology in glioma patients

Veit M Stoecklein et al. Neuro Oncol. .

Abstract

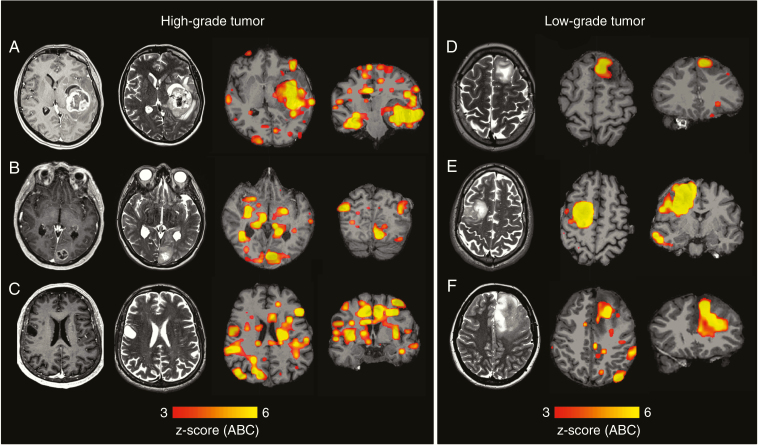
Background: Systemic infiltration of the brain by tumor cells is a hallmark of glioma pathogenesis which may cause disturbances in functional connectivity. We hypothesized that aggressive high-grade tumors cause more damage to functional connectivity than low-grade tumors.

Methods: We designed an imaging tool based on resting-state functional (f)MRI to individually quantify abnormality of functional connectivity and tested it in a prospective cohort of patients with newly diagnosed glioma.

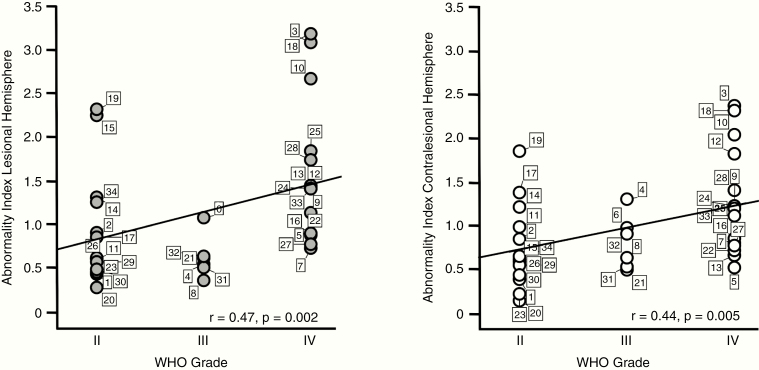
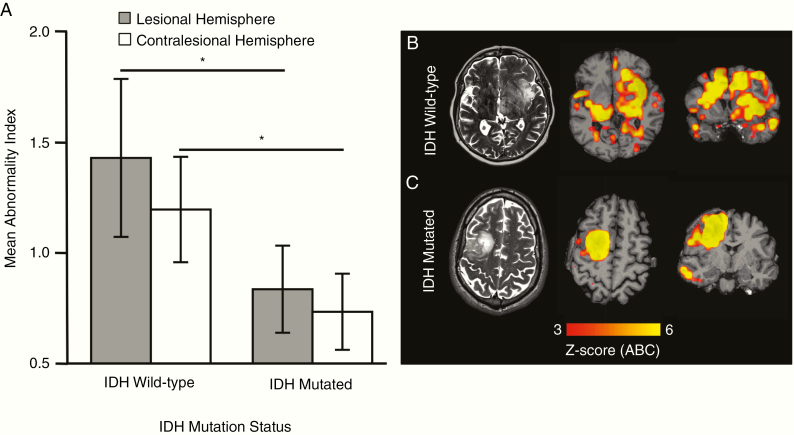
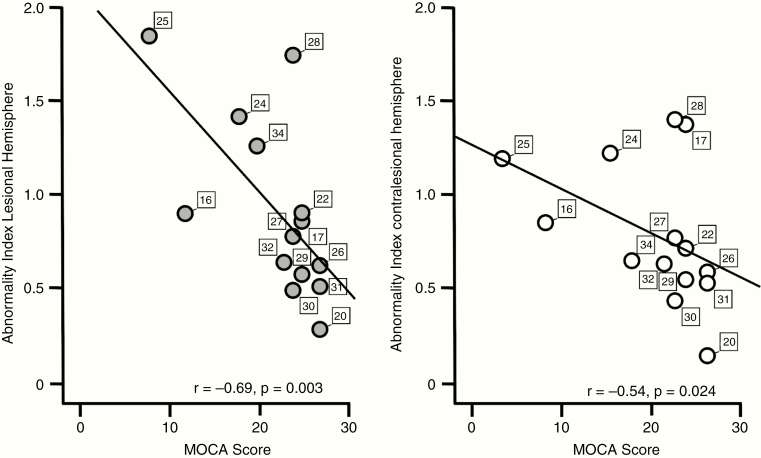
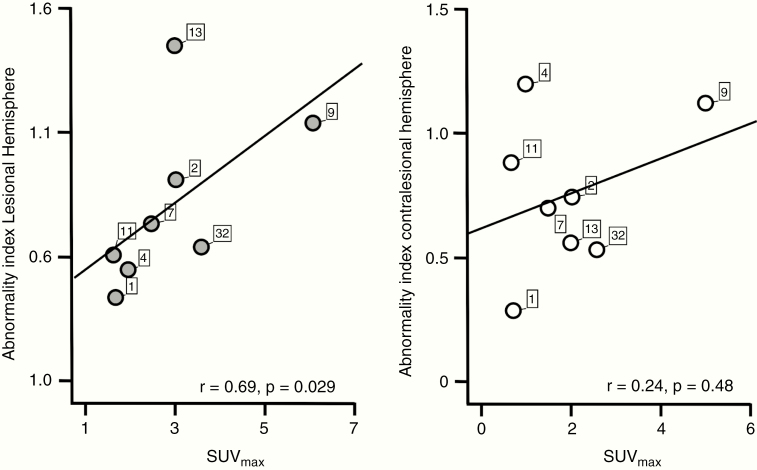
Results: Thirty-four patients were analyzed (World Health Organization [WHO] grade II, n = 13; grade III, n = 6; grade IV, n = 15; mean age, 48.7 y). Connectivity abnormality could be observed not only in the lesioned brain area but also in the contralateral hemisphere with a close correlation between connectivity abnormality and aggressiveness of the tumor as indicated by WHO grade. Isocitrate dehydrogenase 1 (IDH1) mutation status was also associated with abnormal connectivity, with more alterations in IDH1 wildtype tumors independent of tumor size. Finally, deficits in neuropsychological performance were correlated with connectivity abnormality.

Conclusion: Here, we suggested an individually applicable resting-state fMRI marker in glioma patients. Analysis of the functional connectome using this marker revealed that abnormalities of functional connectivity could be detected not only adjacent to the visible lesion but also in distant brain tissue, even in the contralesional hemisphere. These changes were associated with tumor biology and cognitive function. The ability of our novel method to capture tumor effects in nonlesional brain suggests a potential clinical value for both individualizing and monitoring glioma therapy.

Keywords: functional MRI; functional connectivity; glioblastoma; glioma; resting state.


Figures

Fig. 1
Fig. 1
Examples of individual abnormality maps show clinical value of examining the connectome in glioma patients. (A) Structural scans from patient 25 (IDH wildtype glioblastoma WHO grade IV) with gadolinium-enhanced T1 on the far left and T2 images second from left. On the right, maps with individual functional data are shown. Functional maps depict the z-score of the voxel-wise abnormality count (ABC). Severe damage to functional connectivity is observed in both the lesional and the non-lesional hemisphere. In a similar fashion, (B) (patient 9; IDH wildtype glioblastoma WHO grade IV) shows extensive damage to functional connectivity in both hemispheres. (C) Structural and functional scans of patient 12 (IDH1 mutated glioblastoma, WHO grade IV) are shown. On gadolinium-enhanced T1 images (far left) no contrast enhancement by the tumor is noted, making the structural scans suggestive of a low-grade lesion. The functional scans (second from right and far right) with widespread damage to functional connectivity are suggestive of a high-grade tumor which is consistent with the final diagnosis. (D) T2 images of patient 23 (IDH-mutated oligodendroglioma, WHO grade II) as well as functional scans. Here the disturbances in functional connectivity are limited to the area of the tumor, the contralateral hemisphere appears intact. (E, F) Similarly (patient 15 and 34), large tumors which exhibit favorable histopathological and molecular features (IDH-mutated oligodendroglioma WHO grade II) are shown. Here, an area with high abnormality in the location of the tumor is seen while very little abnormality is observed in the rest of the brain.
Fig. 2
Fig. 2
The abnormality index is significantly associated with WHO grade. Scatter plots show the ABI of each individual patient (total n = 34) in the lesional hemisphere (left panel, gray dots) and contralesional (right panel, white dots) hemisphere. Patients are grouped according to WHO grade and are marked with their individual patient number (see Supplementary Tables 1 and 2 for patient characteristics). The ABI of both the lesional and contralesional hemisphere was significantly correlated with WHO grade.
Fig. 3
Fig. 3
The abnormality index is significantly elevated in patients with IDH wildtype tumors. (A) The ABI of both the lesional hemisphere (indicated in gray, mean ABI ± 2 standard deviations) and the contralesional hemisphere (indicated in white, mean ABI ± 2 standard deviations) was significantly higher in IDH wildtype glioma patients than in IDH-mutated glioma patients (P < 0.05, respectively, two-tailed t-test). (B) The individual connectome map (z-score of voxelwise abnormality count) of a patient with an IDH wildtype, TERT-mutated glioma with bilateral severe abnormality (patient 19). (C) The connectome map of a patient with an IDH1-mutated grade II oligodendroglioma with connectivity changes largely confined to the tumor itself.
Fig. 4
Fig. 4
The abnormality index is significantly associated with neurocognition. Neurocognitive performance measured by the MOCA score was inversely correlated with the ABI score of both the lesional hemisphere (left panel) and the contralesional hemisphere (right panel). Patients are marked with their individual patient number.
Fig. 5
Fig. 5
The abnormality index is associated with metabolic information obtained by PET. X-axes of scatter plots show the maximal standardized uptake value (SUVmax) of tumors that showed increased uptake on FET-PET (n = 8, out of 15 patients who underwent FET-PET scanning). Y-axes indicate each patient’s ABI of the lesional (left panel, gray dots) and contralesional (right panel, white dots) hemisphere. ABI of the lesional hemisphere was significantly associated with SUVmax (P < 0.05), while the association of SUVmax and the ABI of the contralesional hemisphere failed to reach statistical significance (P > 0.05).

References

    1. Sahm F, Capper D, Jeibmann A, et al. . Addressing diffuse glioma as a systemic brain disease with single-cell analysis. Arch Neurol. 2012;69(4):523–526. - PubMed
    1. Osswald M, Jung E, Sahm F, et al. . Brain tumour cells interconnect to a functional and resistant network. Nature. 2015;528(7580):93–98. - PubMed
    1. Louis DN, Perry A, Reifenberger G, et al. . The 2016 World Health Organization classification of tumors of the central nervous system: a summary. Acta Neuropathol. 2016;131(6):803–820. - PubMed
    1. Palfi S, Swanson KR, De Boüard S, et al. . Correlation of in vitro infiltration with glioma histological type in organotypic brain slices. Br J Cancer. 2004;91(4):745–752. - PMC - PubMed
    1. Biswal B, Yetkin FZ, Haughton VM, Hyde JS. Functional connectivity in the motor cortex of resting human brain using echo-planar MRI. Magn Reson Med. 1995;34(4):537–541. - PubMed

Publication types