. 2020 Feb;114(1):113-135.
doi: 10.1007/s00422-020-00819-9. Epub 2020 Feb 27.

Unstructured network topology begets order-based representation by privileged neurons

Affiliations

Unstructured network topology begets order-based representation by privileged neurons

Christoph Bauermeister et al. Biol Cybern. 2020 Feb.

Abstract

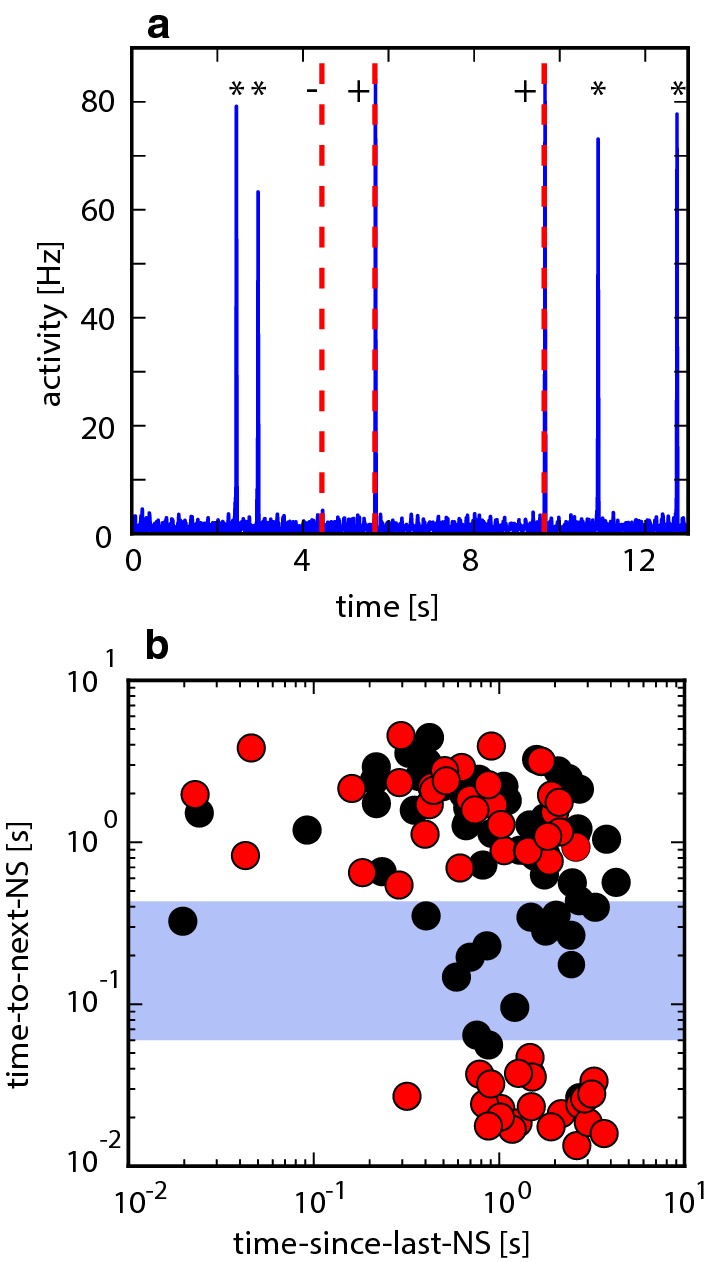
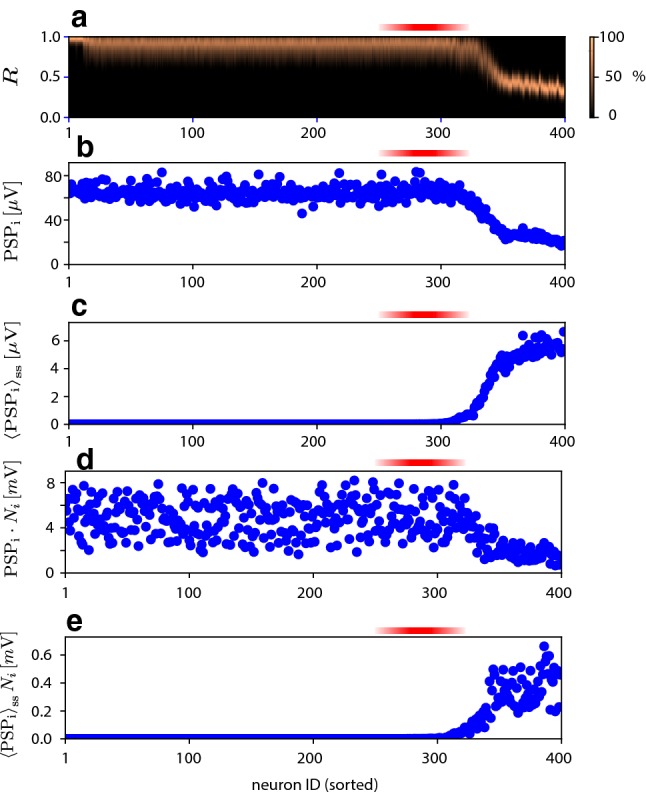
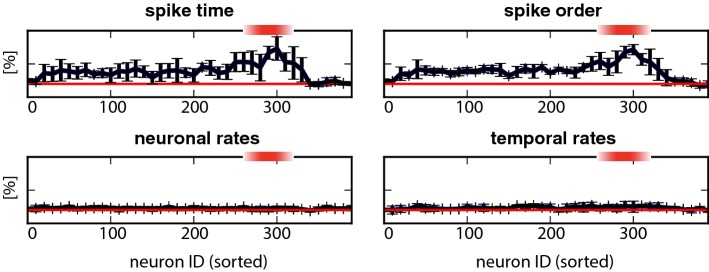
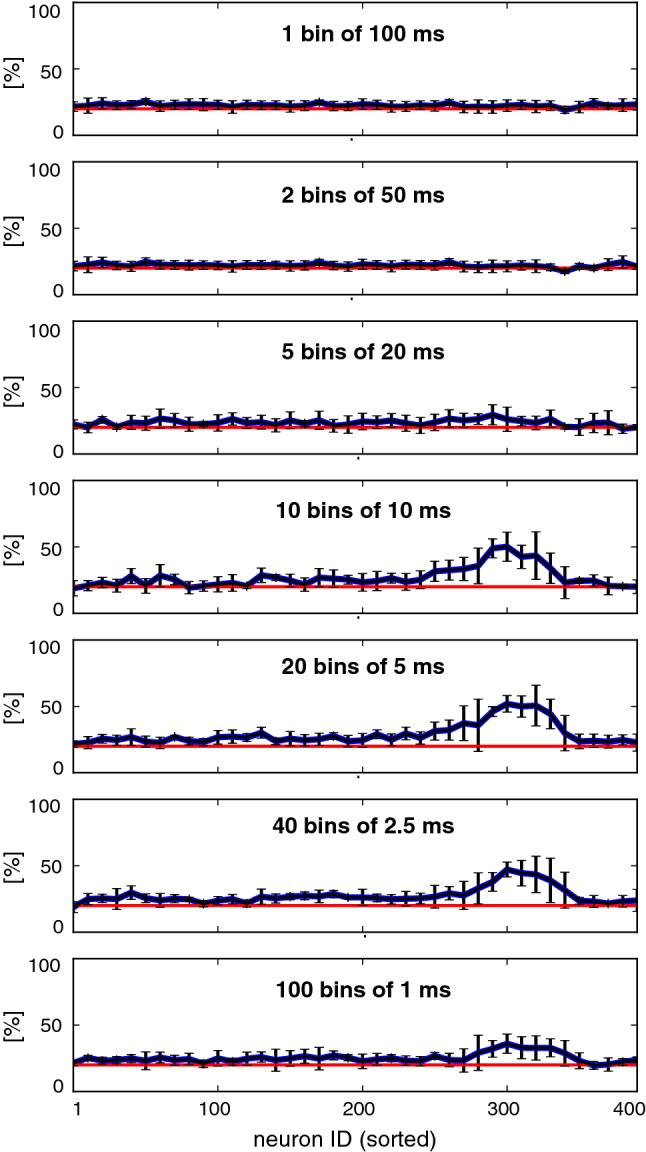
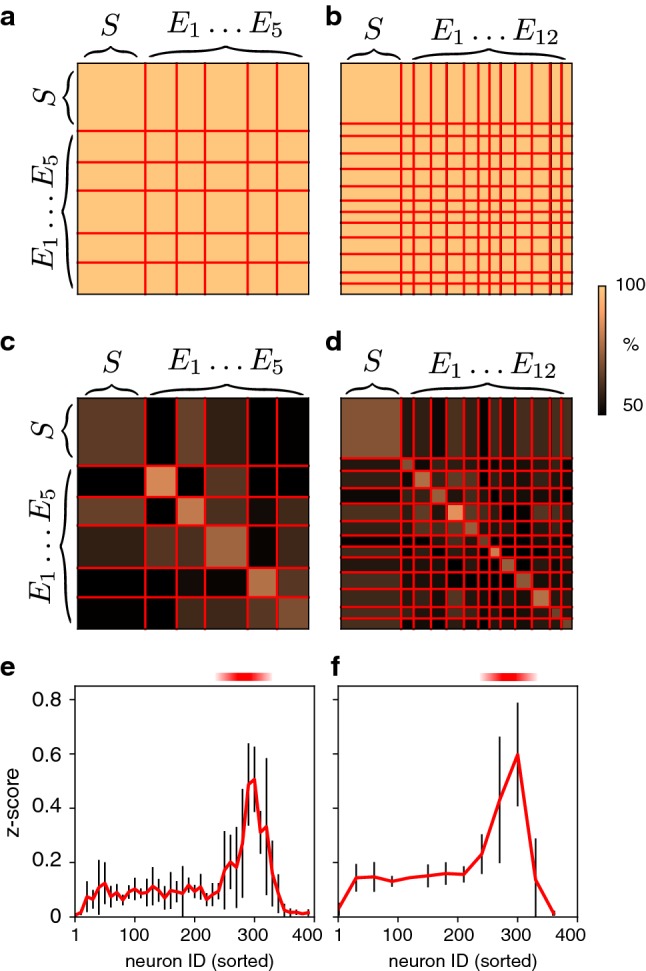
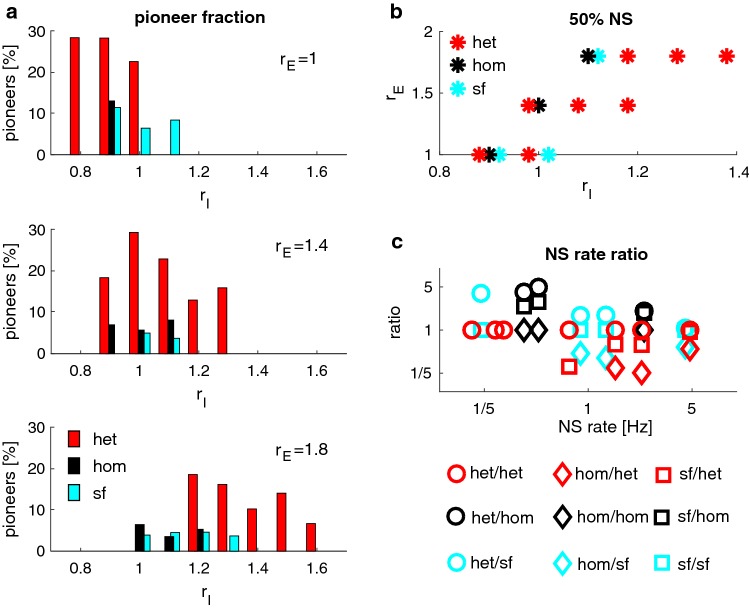
How spiking activity reverberates through neuronal networks, how evoked and spontaneous activity interacts and blends, and how the combined activities represent external stimulation are pivotal questions in neuroscience. We simulated minimal models of unstructured spiking networks in silico, asking whether and how gentle external stimulation might be subsequently reflected in spontaneous activity fluctuations. Consistent with earlier findings in silico and in vitro, we observe a privileged subpopulation of 'pioneer neurons' that, by their firing order, reliably encode previous external stimulation. We also confirm that pioneer neurons are 'sensitive' in that they are recruited by small fluctuations of population activity. We show that order-based representations rely on a 'chain' of pioneer neurons with different degrees of sensitivity and thus constitute an emergent property of collective dynamics. The forming of such representations is greatly favoured by a broadly heterogeneous connection topology-a broad 'middle class' in degree of connectedness. In conclusion, we offer a minimal model for the representational role of pioneer neurons, as observed experimentally in vitro. In addition, we show that broadly heterogeneous connectivity enhances the representational capacity of unstructured networks.

Keywords: Heterogeneous random connectivity; Leader neurons; Motifs; Neural code; Neural dynamics; Neural representation; Pioneer neurons; Spiking networks; Synchronization events.


Conflict of interest statement

The authors declare that they have no conflict of interest.

Figures

Fig. 1
Fig. 1
Spontaneous activity. a Spike rasters of excitatory neurons for the three network types (representative examples) with NS (red stars). b Corresponding spike counts (bin width 100ms) with NS (dashed red lines). c Power spectral densities of single neuron activity between NS, compared to Poisson spikes with the same average rate (black lines). The omission of NS periods is reflected in reduced power at low frequencies (colour figure online)
Fig. 2
Fig. 2
Bimodality of activity and relation of individual spikes to nearest NS. a Histogram of peak activation values during spontaneous activity fluctuations (100s simulations). Relative activity in multiples of mean firing rate Amean (from left: 1.20Hz, 0.99Hz, and 1.43Hz, respectively). b Individual neuron spikes, relative to the next NS, during 100s of spontaneous activity. Excitatory neurons are sorted vertically by mean firing rate (sorted neuron ID), with the least active neuron at bottom and the most active neuron on top. Individual neuron spikes are represented by black dots. For most neurons, spikes fall into two distinct classes: shortly before or long before the next NS (left and right columns of black dots, respectively). A heuristic latency criterion (t0=-80ms, red lines) readily distinguishes these classes. Thus, the ‘first spike during a NS’ is well defined (i.e. rightmost dots in left column), for all but the most active neurons (colour figure online)
Fig. 3
Fig. 3
Evoked activity. a Superposition of spontaneous and evoked activities (example sequence). External stimulation forced simultaneous spikes in 5 randomly chosen excitatory neurons, at random time points (Poisson rate 0.4Hz), here marked by dashed red lines. Stimulation that succeeded (failed) to evoke a NS is marked by ‘+’ (‘−’). Spontaneous NSs are denoted by ‘’. b Classification of evoked and spontaneous NS. For each stimulation event, time to the next NS is plotted against time since last NS (red dots). For comparison, a null distribution is shown for an identical number of randomly timed, surrogate events (black dots). Stimulation events (red dots) form two distinct clusters (above and below blue bar), permitting us to classify stimulation events with high probability as either successful (below) or unsuccessful (above). In contrast, surrogate events are distributed continuously. Based on 120s simulation of a heterogeneous random network, with stimulation rate equal to spontaneous NS rate (colour figure online)
Fig. 4
Fig. 4
Latencies to NS, membrane voltage, and spike-triggered average activity. Excitatory neurons are sorted horizontally by mean activity (sorted neuron ID). Red shading marks the pioneer range (ID 260 to 320). a Latency of individual neuron first spikes, relative to the associated NS. Zero latency (yellow line) is defined by peak activity of the associated NS. Neurons in the pioneer range fire reliably before the NS (negative latencies). Colour scale indicates fraction of maximal density. b Distribution of V voltage in individual neurons, during intervals without NS, relative to firing threshold (horizontal red line). Neurons in the pioneer range have membrane potential just below threshold. Colour scale indicates fraction of maximal density. c Average deviation Γi(τ) of population activity at lag τ, conditioned on individual spikes of neuron i (see text and Sect. 4). Spikes of neurons in the pioneer range are consistently preceded by positive deviations. Note that deviation Γi(τ) is not defined below ID 260 (colour figure online)
Fig. 5
Fig. 5
Influence of excitatory neurons. Red shading marks the pioneer range (ID 260 to 320). a Probability density of synaptic resources R, average over all efferent synapses of a given neuron, during intervals between NS. Resources decrease monotonically with mean activity. The most active neurons to retain substantial resources are neurons in the pioneer range. b Amplitude of post-synaptic potentials PSPi elicited by single spikes, averaged over all efferent synapses. c Steady-state post-synaptic potential PSPiss elicited by Poisson spiking at individual mean rate of neuron, averaged over all efferent synapses. Note that increasing firing rate overcompensates diminishing resources. d Same as (b), but summed over all efferent synapses. e Same as (c), but summed over all efferent synapses (colour figure online)
Fig. 6
Fig. 6
Effect of silencing groups of neurons. Red shading marks the pioneer range (ID 260 to 320). a Rate of NS as a function of N, for modified networks with neuron cohort NIDN+30 silenced by de-efferentiation. Results are shown for two realizations (blue and green) with different spontaneous NS rates (dashed lines). NSs cease when neurons in the pioneer range are silenced. Typically, NSs are recovered when neurons above this range are silenced (e.g. blue trace). b Silencing pioneer neurons elevates threshold for triggering NS. Threshold population activity (in Hz), after silencing neurons NIDN+30. Two realizations are shown (blue and green traces). Over much of the pioneer range, only a lower bound for the threshold could be established (dashed traces), because even the largest observed fluctuations failed to trigger a NS (colour figure online)
Fig. 7
Fig. 7
Classification performance of different decoding schemes, based on different groups of neurons. Red shading marks the pioneer range (ID 260 to 320). Results for ‘spike time’, ‘spike order’, ‘neuronal rates’, and ‘temporal rates’ are shown separately. Percentage of correct classification α(N) of one of the five stimulated locations is shown, based on the activity of neurons with sorted ID [N,N+10]. Chance performance is 20% (colour figure online)
Fig. 8
Fig. 8
Interpolation between rate-based and spike-based decoding. The activity of groups of n=10 neurons over 100ms was analysed in k time bins, forming a rate vector of length k·n. Decoding performance is shown for different groups of neurons and different bin sizes
Fig. 9
Fig. 9
Matrices of average ‘spike order similarity’ (SOS) during different NS. Observed NSs were classified as ‘spontaneous’ (S), ‘evoked at site 1’ (E1), ‘evoked at site 2’ (E2), and so on, and class boundaries between sorted NS are marked by red lines. ad Representative sets of non-pioneer or pioneer neurons, average SOS of pairs of NS (fraction of maximal similarity, colour scale) a Non-pioneer SOS, five stimulation sites (k=5 and n=10). b Non-pioneer SOS, twelve stimulation sites (k=12 and n=30). c Pioneer SOS, five stimulation sites (k=5 and n=10). d Pioneer SOS, twelve stimulation sites (k=12 and n=30). e, f Distance between SOS distributions (mean and standard deviation of z-score), within-class and between-class, for sets of neurons with contiguous ID starting with N{1,393}. e Five stimulation sites and sets of ten neurons (k=5 and n=10, contiguous ID in range [N,N+n-1]). f Twelve stimulation sites and sets of thirty neurons (k=5 and n=10, contiguous ID in range [N,N+n]) (colour figure online)
Fig. 10
Fig. 10
Macroscopic dynamics, excitation/inhibition strength, and type of connectivity. Dynamical characteristics of synchronization events, for different types of connectivity and for different absolute and relative strengths of excitation, rE, and inhibition, rI. Blue, dashed curves indicate the transitional region which, for each type of connectivity, separates the inhibition-dominated regime of ‘tonic’ dynamics from the excitation-dominated regime ‘asynchronous’ dynamics (see text). Red dots mark the rE,rI value pairs further investigated in Fig. 11. a Average interval between NS, TINSI; b coefficient of variation of interval, CVINSI; c activity ratio, Amax/Amean (colour figure online)
Fig. 11
Fig. 11
Macroscopic dynamics at selected connection strengths: rE and rI. Fraction of pioneer neurons and NS rates in networks with rE{1.0,1.4,18} and rI{0.8,1.0,,1.6,1.8} (red dots in Fig. 10c). a Percentage of pioneer neurons in networks of different topologies, for selected values (rE,rI) (see text). b Consistent NS in different network realizations. Value pairs (rE,rI) that produced NS in 50% of realizations. c Disparity of NS rates in networks with different topologies, but identical values of (rE,rI). Ratio of NS rates, sorted by reference rate, for all ordered topology pairs. For example, at three identical value pairs (rE,rI), NS rates fhom and fhet could be established for homogeneous and heterogeneous networks. Ratios fhet/fhom are shown against fhom (black circles) and ratios fhom/fhet against fhet (red diamonds) (colour figure online)
Fig. 12
Fig. 12
Afferent connectivity and star voltage V during periods without NS, for different network topologies. Colours distinguish heterogeneous (red), homogeneous (blue), and scale-free topology (black). Symbols mark pioneer neurons in a representative realization. a Distribution of afferent excitation, Dexc, averaged over multiple network realizations. b Distribution of afferent inhibition, Dinh, averaged over multiple network realizations. c Distribution of ‘effective afference ratio’, ωee,0Dexc/Dinh, averaged over multiple network realizations. d Dependence of the standard deviation of star voltage, stdV on Dexc. Regression curves indicate proportionality std(V)2.1×10⁷VS·Dexc·ωee,0. e Dependence of mean star voltage, V, on Dinh. Regression line indicates proportionality V-0.12mV·Dinh-48.3mV. f Distribution of sensitivity, CV(V), with right tail on logarithmic scale (inset) (colour figure online)
Fig. 13
Fig. 13
Spiking behaviour and sensitivity compared for different network topologies. Colours distinguish neurons of heterogeneous (red), scale-free (black), and homogeneous networks (blue). Pioneers are marked by large dots, other neurons by small dots. a, b Full effects of network topology (including different time courses of population activity). a Comparison of mean latency τ during NS initiation and sensitivity CV(V) during periods without NS. b Comparison of consistency of latency 1/CV(τ) and sensitivity CV(V). The sensitivity consistency criterion (dashed lines) for pioneers and the sorted ID criterion largely overlap (discrepancies are marked by red circles). c, d Isolated effects of network topology (for identical time course of population activity). Corresponding comparisons of latency, consistency, and sensitivity when an identical, rigid time course of population activity is prescribed for all network topologies (colour figure online)
Fig. 14
Fig. 14
Many-to-one-to-many propagation of activity by pioneer neurons (highly schematic). a Four pioneer neurons are illustrated (blue, green, yellow, red), receiving afferent input from the left, and emitting efferent output to the right. Vertical columns of neurons represent the network as a whole. Afferent and efferent projections involve independent and random subpopulations of the network. b External stimulation (red bolt) of a specific subpopulation propagates, via a particular pioneer, to another subpopulation, starting an orderly sequence (greenblueredyellow). c External stimulation of another subpopulation propagates via another pioneer, starting another orderly sequence (redyellowgreenblue) (colour figure online)

References

    1. Ansmann G, Karnatak R, Lehnertz K, Feudel U. Extreme events in excitable systems and mechanisms of their generation. Phys Rev E. 2013;88(5):052911. - PubMed
    1. Bak P, Tang C, Wiesenfeld K. Self-organized criticality. Phys Rev A. 1988;38(1):364. - PubMed
    1. Barabási AL, Albert R. Emergence of scaling in random networks. Science. 1999;286(5439):509–512. - PubMed
    1. Bauermeister C, Keren H, Braun J (2015) Coherent coupling of in vitro neuronal slices onto in silico networks. In: 11th Bernstein conference, Heidelberg, Germany
    1. Beggs JM, Plenz D. Neuronal avalanches in neocortical circuits. J Neurosci. 2003;23(35):11167–11177. - PMC - PubMed

Publication types

LinkOut - more resources