. 2020 Apr;287(4):373-394.
doi: 10.1111/joim.13024. Epub 2020 Feb 27.

A roadmap to build a phenotypic metric of ageing: insights from the Baltimore Longitudinal Study of Aging

Affiliations

A roadmap to build a phenotypic metric of ageing: insights from the Baltimore Longitudinal Study of Aging

P-L Kuo et al. J Intern Med. 2020 Apr.

Abstract

Over the past three decades, considerable effort has been dedicated to quantifying the pace of ageing yet identifying the most essential metrics of ageing remains challenging due to lack of comprehensive measurements and heterogeneity of the ageing processes. Most of the previously proposed metrics of ageing have been emerged from cross-sectional associations with chronological age and predictive accuracy of mortality, thus lacking a conceptual model of functional or phenotypic domains. Further, such models may be biased by selective attrition and are unable to address underlying biological constructs contributing to functional markers of age-related decline. Using longitudinal data from the Baltimore Longitudinal Study of Aging (BLSA), we propose a conceptual framework to identify metrics of ageing that may capture the hierarchical and temporal relationships between functional ageing, phenotypic ageing and biological ageing based on four hypothesized domains: body composition, energy regulation, homeostatic mechanisms and neurodegeneration/neuroplasticity. We explored the longitudinal trajectories of key variables within these phenotypes using linear mixed-effects models and more than 10 years of data. Understanding the longitudinal trajectories across these domains in the BLSA provides a reference for researchers, informs future refinement of the phenotypic ageing framework and establishes a solid foundation for future models of biological ageing.

Keywords: Geroscience; accelerated ageing; epidemiology; mechanisms of ageing; phenotypic ageing.


Conflict of interest statement

Conflict of interest statement

All authors declare no conflict of interests.

Figures

Fig. 1
Fig. 1
Conceptual framework illustrating the phenotypic measures of ageing organized by domain. The proposed phenotypic measures of ageing include four domains: body composition, energetics, homeostatic mechanisms, and neurodegeneration/neuroplasticity. Changes in the ageing phenotypes are driven by the biological mechanisms (centre circle) of ageing and manifest as functional changes with ageing (peripheral borders) through the phenotypic domains. Specific variables are included as examples and are not meant to be an exhaustive list.
Fig. 2
Fig. 2
Graphic summary of the BLSA cohort that was used for this analysis. Each line or dot denotes a BLSA participant; A line ending with a solid dot means the participant died, while a line ending with an arrow and a halo dot means the participant is still alive at that age. The upper panel shows the time since enrolment by participant age. The lower panel shows each participant’s age versus calendar time. Men are plotted in blue, and women are plotted in red.
Fig. 3
Fig. 3
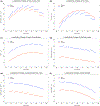
Longitudinal fitted changes in selected variables in the body composition domain. The above plot shows the fitted longitudinal changes in body mass index, fat mass, waist circumference, total lean mass, appendicular lean mass and grip strength by decade.
Fig. 4
Fig. 4
Longitudinal fitted changes in selected variables in the energetics domain. The above plot showed the fitted longitudinal changes in peak VO2, resting metabolic rate, cost–capacity ratio, FEV1 and FVC by decade.
Fig. 5
Fig. 5
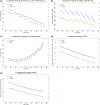
Longitudinal fitted changes in selected phenotypes from the homeostatic mechanisms domain – Part I. The above plot showed the fitted longitudinal changes in IL-6 and CRP by decade.
Fig. 6
Fig. 6
Longitudinal fitted changes in selected phenotypes from the homeostatic mechanisms domain – Part II. The above plot showed the fitted longitudinal changes in albumin, haemoglobin, fasting glucose, systolic blood pressure, diastolic blood pressure and pulse-wave velocity by decade.
Fig. 7
Fig. 7
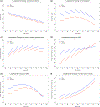
Longitudinal fitted changes in selected phenotypes from the homeostatic mechanisms domain – Part III. The above plot shows the fitted longitudinal changes in creatinine clearance, total cholesterol, LDL cholesterol and triglyceride by decade.
Fig. 8
Fig. 8
Longitudinal fitted changes in selected phenotypes from the neurodegeneration/neuroplasticity domain. The above plot shows the fitted longitudinal changes in total brain volume, total white matter, total grey matter and ventricular volume by decade.

References

    1. https://www.cdc.gov/nchs/products/life_tables.htm, United States Life Table, 1966 – 2015. Centers for Disease Control and Prevention, 2018.
    1. Blodgett JM, Theou O, Howlett SE, Rockwood K. A frailty index from common clinical and laboratory tests predicts increased risk of death across the life course. Geroscience 2017; 39:447–455. - PMC - PubMed
    1. Fried LP, Tangen CM, Walston J et al. Frailty in older adults: evidence for a phenotype. J Gerontol A Biol Sci Med Sci 2001; 56:M146–56. - PubMed
    1. Fried LP, Xue Q-L, Cappola AR et al. Nonlinear multisystem physiological dysregulation associated with frailty in older women: implications for etiology and treatment. J Gerontol A Biol Sci Med Sci 2009; 64:1049–57. - PMC - PubMed
    1. Studenski S, Perera S, Patel K et al. Gait speed and survival in older adults. JAMA 2011; 305:50–58. - PMC - PubMed

Publication types