. 2020 Mar 30;147(6):dev186213.
doi: 10.1242/dev.186213.

Molecular and genetic regulation of pig pancreatic islet cell development

Affiliations

Molecular and genetic regulation of pig pancreatic islet cell development

Seokho Kim et al. Development. .

Abstract

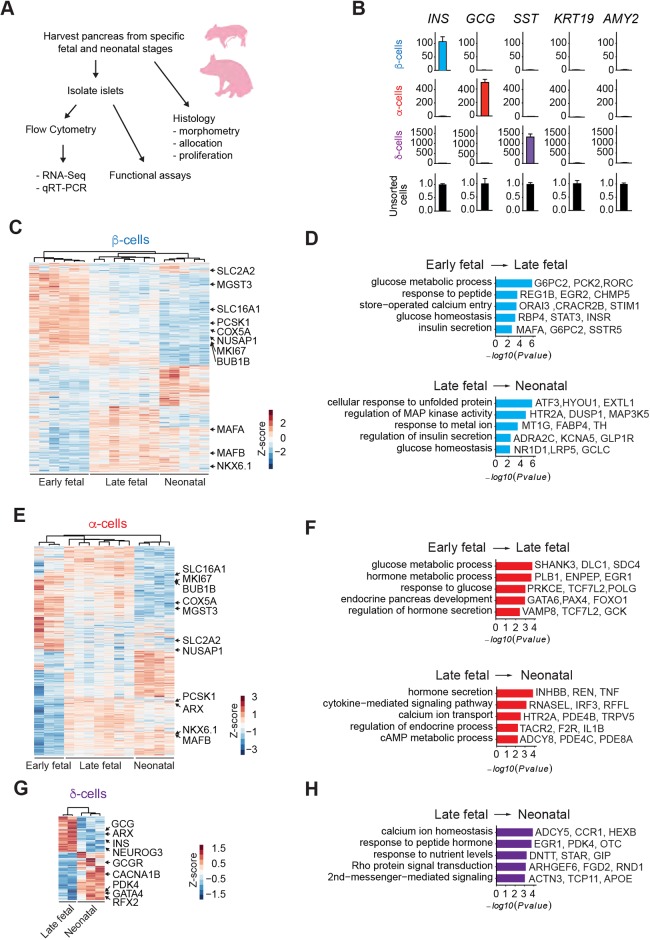
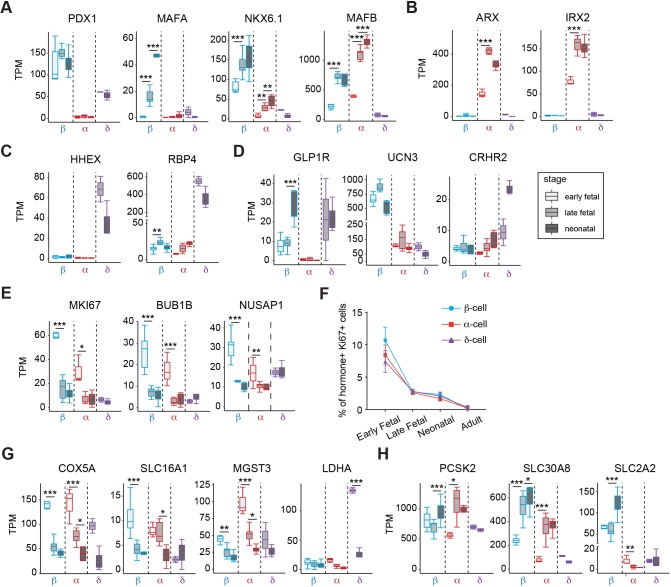
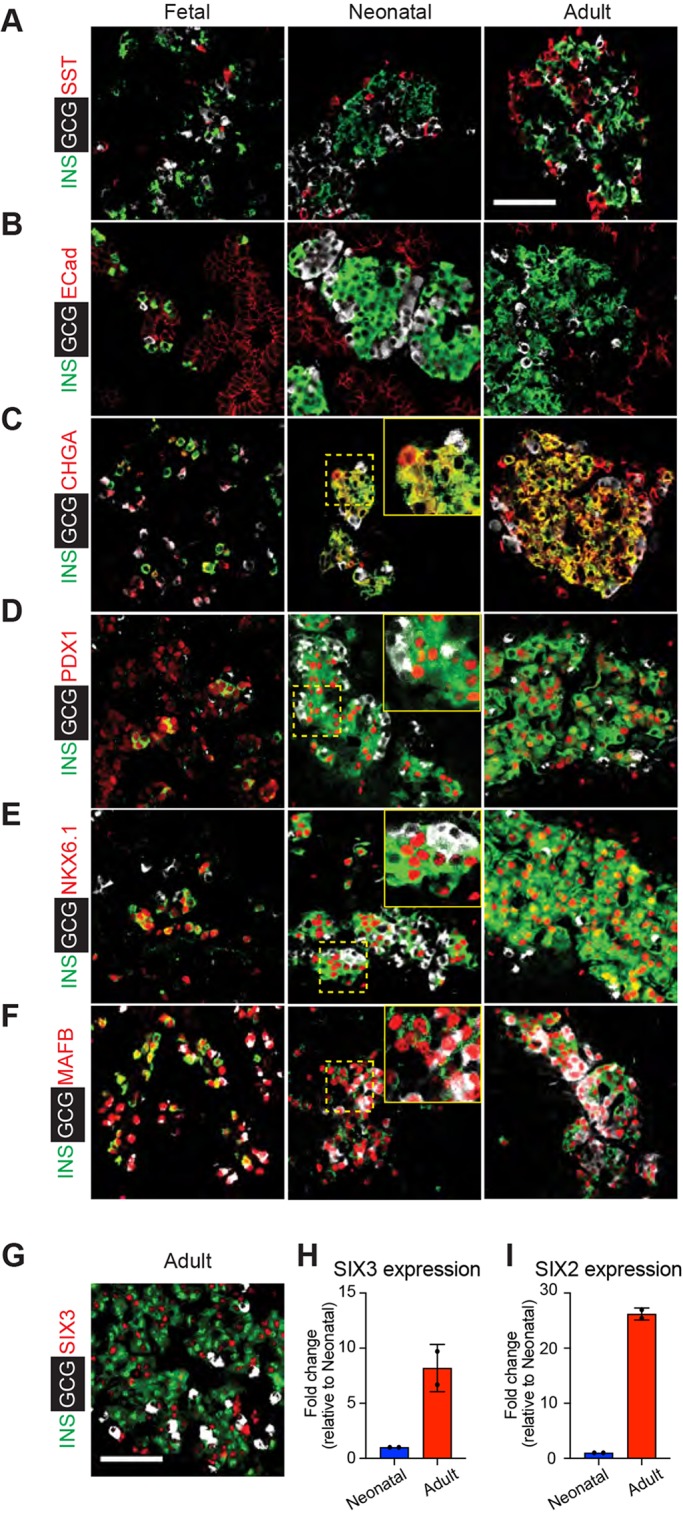
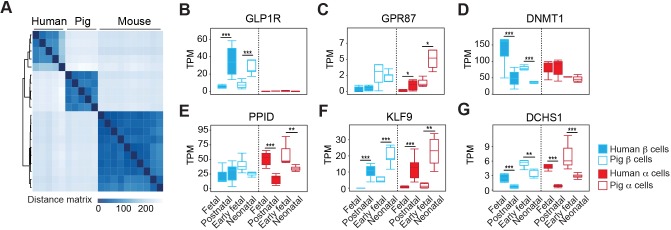
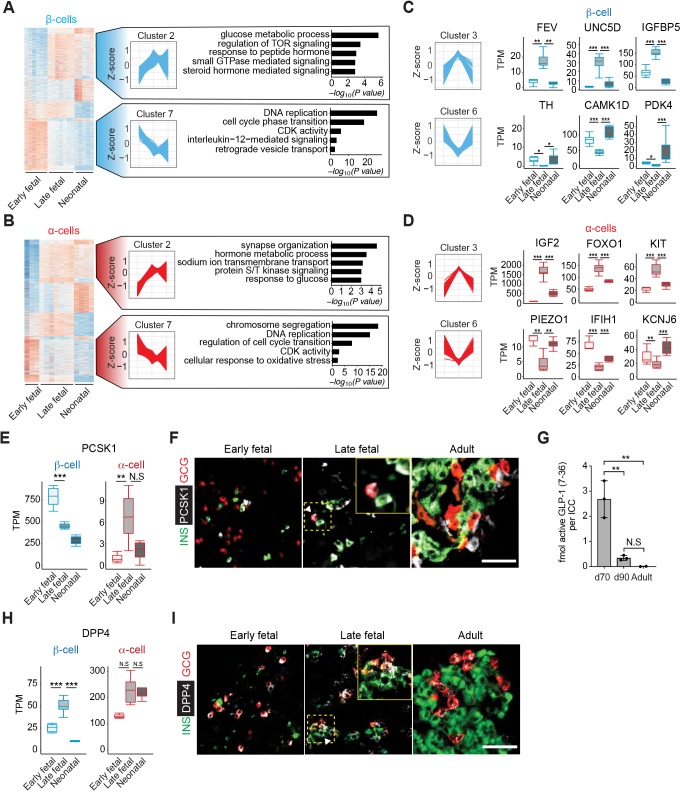
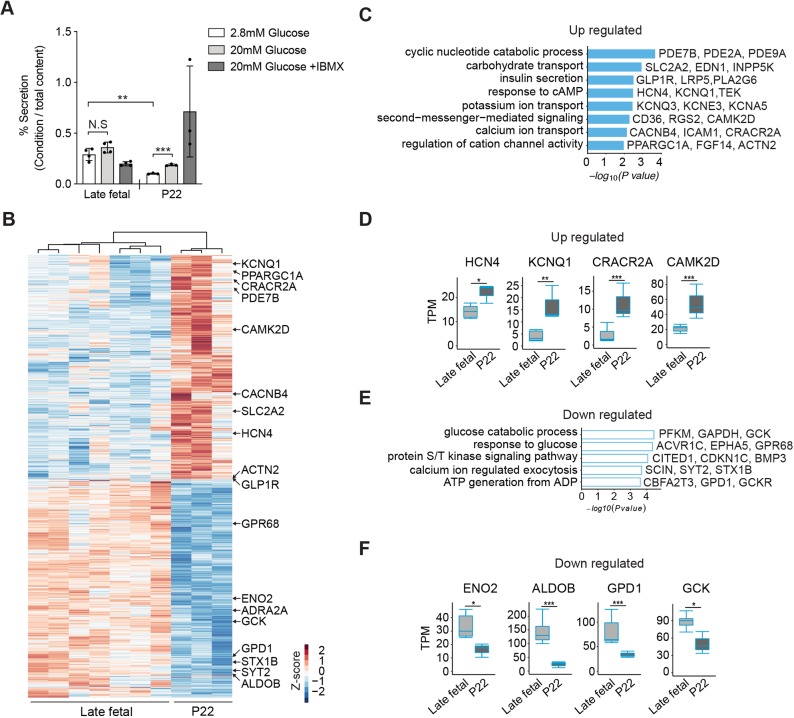
Reliance on rodents for understanding pancreatic genetics, development and islet function could limit progress in developing interventions for human diseases such as diabetes mellitus. Similarities of pancreas morphology and function suggest that porcine and human pancreas developmental biology may have useful homologies. However, little is known about pig pancreas development. To fill this knowledge gap, we investigated fetal and neonatal pig pancreas at multiple, crucial developmental stages using modern experimental approaches. Purification of islet β-, α- and δ-cells followed by transcriptome analysis (RNA-seq) and immunohistology identified cell- and stage-specific regulation, and revealed that pig and human islet cells share characteristic features that are not observed in mice. Morphometric analysis also revealed endocrine cell allocation and architectural similarities between pig and human islets. Our analysis unveiled scores of signaling pathways linked to native islet β-cell functional maturation, including evidence of fetal α-cell GLP-1 production and signaling to β-cells. Thus, the findings and resources detailed here show how pig pancreatic islet studies complement other systems for understanding the developmental programs that generate functional islet cells, and that are relevant to human pancreatic diseases.

Keywords: Diabetes mellitus; Metabolism; Organogenesis; Pancreas; Pig; α-Cell; β-Cell; δ-cell.


Conflict of interest statement

Competing interestsThe authors declare no competing or financial interests.

Figures

Fig. 1.
Fig. 1.
Pancreas dissociation and FACS purification of islet cells from fetal and neonatal pigs. (A) Schematic of the study design. (B) qRT-PCR analysis of INS, GCG, SST, KRT and AMY2 of FACS sorted β-, α- and δ-cell populations from P22 neonatal pigs. The fold change (2−ΔΔCT) relative to the unsorted cell population is shown on the y-axis. (C) Heatmap of DEGs in pig β-cells between early fetal, late fetal and neonatal stages. (D) GO term enrichment analysis of genes increasing with age in pig β-cells. (E) Heatmap of DEGs in pig α-cells between early fetal, late fetal and neonatal stages. (F) GO term enrichment analysis of genes increasing with age in pig α-cells. (G) Heatmap of DEGs in pig δ-cells between late fetal and neonatal stages. (H) GO term enrichment analysis of genes increasing with age in pig δ-cells. The z-score scale represents log2(X+1) transformed TPM counts. Red and blue color intensity of the z-score indicates upregulation and downregulation, respectively. Adjusted P-value threshold for GO term analysis was 0.1.
Fig. 2.
Fig. 2.
Analysis of gene expression in developing pig islet β-, α- and δ-cells. (A-E,G,H) Boxplots displaying normalized TPM counts of β-, α- and δ-cell specific genes (A-D), markers associated with proliferation (E), disallowed genes (G) and β-cell functional regulators (H). Box plots show the median, interquartile range (IQR) and 1.5 times the IQR. (F) Quantification showing average percentage of INS+ (β-cell), GCG+ (α-cell) or SST+ (δ-cell) cells that are Ki67+ in each developmental stage (n=40 images per group, from three pigs per group; error bars show s.d.). Adjusted P-value: *P≤0.05, **P≤0.01, ***P≤0.001 (Benjamini-Hochberg).
Fig. 3.
Fig. 3.
Stage-specific expression of islet factors during development. (A-C) Immunostaining of INS (green) and GCG (white) paired with SST (red) (A), E-cadherin (ECad; red) (B) and chromogranin-A (CHGA; red) (C) in the early fetal, neonatal and adult pig pancreas. (D-F) Immunostaining of the TFs PDX1 (D), NKX6.1 (E) and MAFB (F) in the early fetal, neonatal and adult pig pancreas. (G) Immunostaining of SIX3 with INS and GCG in adult pig pancreas. Insets shows magnification of dashed yellow boxed area. (H,I) qRT-PCR measures of relative mRNA levels encoding SIX3 (H) and SIX2 (I) in isolated neonatal and adult pig islets (n=2, t-test; error bars show s.d.). ΔCT values for neonatal and adult SIX3 expression were 5.1 and 2.0, respectively (compared with β-actin). ΔCT values for neonatal and adult SIX2 (compared with β-actin) were 7.2 and 2.6, respectively. Scale bars: 50 µm.
Fig. 4.
Fig. 4.
Comparison of gene expression in pig and human β- and α-cell development. (A) Unsupervised hierarchical clustering using distance matrices of neonatal pig, human and mouse β-cells. (B-G) Boxplots displaying normalized TPM counts of select genes, the expression of which changes in a conserved manner between human and pig development. Box plots show the median, interquartile range (IQR) and 1.5 times the IQR. Adjusted P-value: *P≤0.05, **P≤0.01, ***P≤0.001 (Benjamini-Hochberg).
Fig. 5.
Fig. 5.
Dynamic gene regulation during pig β- and α-cell development. (A,B) Heat maps of genes with altered expression from early fetal to neonatal stages in β-cells (A) and α-cells (B), showing eight distinct clusters. Cluster 2 includes genes for which mRNA increased up to late fetal stages then did not change thereafter. Cluster 7 includes genes for which mRNA declined then did not change thereafter. Enriched GO terms in each cluster are shown to the right. Adjusted P-value threshold was 0.1. The z-score scale represents log2(X+1) transformed TPM counts. Red and blue color intensity of the z-score indicates upregulation and downregulation, respectively. (C,D) The z-score scale (left) represents log2(X+1) transformed TPM counts with total genes in β-cells (C) and α-cells (D), showing Cluster 3 (Up-Down) or Cluster 6 (Down_Up). Boxplots display normalized TPM counts of genes shown (right). (E) Boxplots displaying normalized TPM counts of PCSK1 mRNA. (F) Immunostaining of PCSK1 (white) with INS (green) and GCG (red) in early fetal, late fetal and adult pig pancreas. White arrowhead indicates PCSK1+ GCG+ (double positive) cells. (G) Concentrations of active GLP-1 in lysates from pig islet cell clusters at different developmental stages (ANOVA, **P≤0.01; error bars indicate s.d.; N.S., not significant). (H) Boxplots displaying normalized TPM counts of DPP4 mRNA. (I) Immunostaining of DPP4 (white) with INS (green) and GCG (red) in early fetal, neonatal and adult pig pancreas. White arrowhead indicates DPP4+ INS+ (double positive) cells. Insets show magnification of dashed yellow boxed area. Box plots show the median, interquartile range (IQR) and 1.5 times the IQR. Adjusted P-value: *P≤0.05, **P≤0.01, ***P≤0.001 (Benjamini-Hochberg). Scale bars: 50 µm.
Fig. 6.
Fig. 6.
Maturation of β-cell function in postnatal pigs. (A) Glucose-stimulated insulin secretion (GSIS) assay measured insulin secretion in response to 2.8 mM (low), 20 mM (high) glucose and 20 mM glucose+IBMX. Data show average secreted insulin as a percentage of insulin content in the isolated islets from late fetal (n=4) and P22 (n=3) piglets (t-test; **P≤0.01, ***P≤0.001; error bars indicate s.d.; N.S., not significant). (B) Heat map of DEGs between late fetal and P22 β-cells. The z-score scale represents log2(X+1) transformed TPM counts. Red and blue color intensity of the z-score indicates upregulation and downregulation, respectively. (C,E) GO term analysis for biological processes with upregulated (C) and downregulated (E) genes between late fetal and P22 β-cells. Adjusted P-value threshold was 0.1. (D,F) Boxplots displaying normalized TPM counts of upregulated (D) or downregulated (F) genes between late fetal and P22. Box plots show the median, interquartile range (IQR) and 1.5 times the IQR. Adjusted P-value: *P≤0.05, **P≤0.01, ***P≤0.001 (Benjamini-Hochberg).

References

    1. Aguayo-Mazzucato C., Koh A., El Khattabi I., Li W.-C., Toschi E., Jermendy A., Juhl K., Mao K., Weir G. C., Sharma A. et al. (2011). Mafa expression enhances glucose-responsive insulin secretion in neonatal rat beta cells. Diabetologia 54, 583-593. 10.1007/s00125-010-2026-z - DOI - PMC - PubMed
    1. Ang L. T., Tan A. K. Y., Autio M. I., Goh S. H., Choo S. H., Lee K. L., Tan J., Pan B., Lee J. J. H., Lum J. J. et al. (2018). A roadmap for human liver differentiation from pluripotent stem cells. Cell Rep. 22, 2190-2205. 10.1016/j.celrep.2018.01.087 - DOI - PMC - PubMed
    1. Arda H. E., Benitez C. M. and Kim S. K. (2013). Gene regulatory networks governing pancreas development. Dev. Cell 25, 5-13. 10.1016/j.devcel.2013.03.016 - DOI - PMC - PubMed
    1. Arda H. E., Li L., Tsai J., Torre E. A., Rosli Y., Peiris H., Spitale R. C., Dai C., Gu X., Qu K. et al. (2016). Age-dependent pancreatic gene regulation reveals mechanisms governing human β cell function. Cell Metab. 23, 909-920. 10.1016/j.cmet.2016.04.002 - DOI - PMC - PubMed
    1. Arda H. E., Tsai J., Rosli Y. R., Giresi P., Bottino R., Greenleaf W. J., Chang H. Y. and Kim S. K. (2018). A chromatin basis for cell lineage and disease risk in the human pancreas. Cell Syst. 7, 310-322.e314. 10.1016/j.cels.2018.07.007 - DOI - PMC - PubMed

Publication types

MeSH terms

Substances