. 2020 Mar 1;12(3):185-202.
doi: 10.1093/gbe/evaa041.

Ab Initio Construction and Evolutionary Analysis of Protein-Coding Gene Families with Partially Homologous Relationships: Closely Related Drosophila Genomes as a Case Study

Affiliations

Ab Initio Construction and Evolutionary Analysis of Protein-Coding Gene Families with Partially Homologous Relationships: Closely Related Drosophila Genomes as a Case Study

Xia Han et al. Genome Biol Evol. .

Abstract

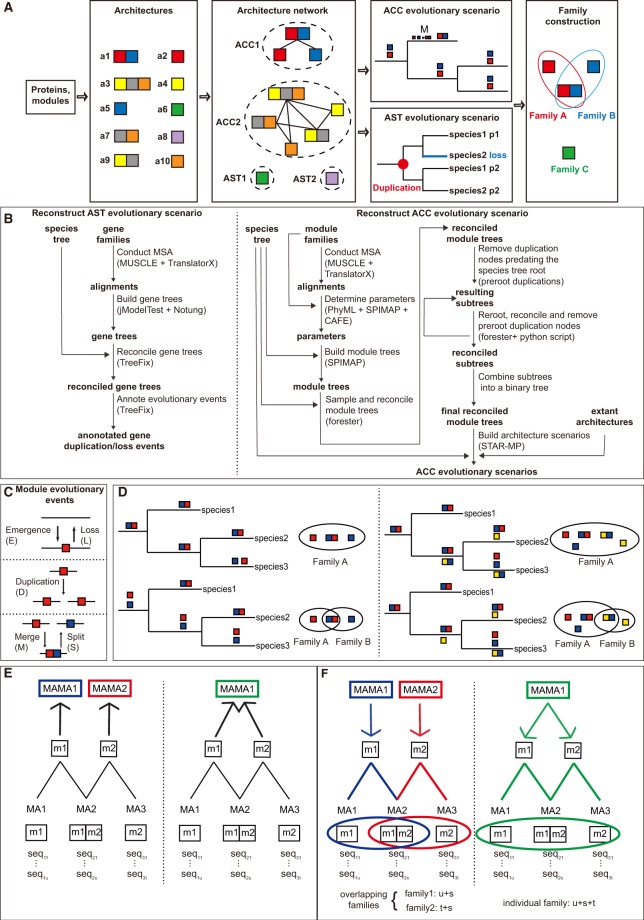
How have genes evolved within a well-known genome phylogeny? Many protein-coding genes should have evolved as a whole at the gene level, and some should have evolved partly through fragments at the subgene level. To comprehensively explore such complex homologous relationships and better understand gene family evolution, here, with de novo-identified modules, the subgene units which could consecutively cover proteins within a set of closely related species, we applied a new phylogeny-based approach that considers evolutionary models with partial homology to classify all protein-coding genes in nine Drosophila genomes. Compared with two other popular methods for gene family construction, our approach improved practical gene family classifications with a more reasonable view of homology and provided a much more complete landscape of gene family evolution at the gene and subgene levels. In the case study, we found that most expanded gene families might have evolved mainly through module rearrangements rather than gene duplications and mainly generated single-module genes through partial gene duplication, suggesting that there might be pervasive subgene rearrangement in the evolution of protein-coding gene families. The use of a phylogeny-based approach with partial homology to classify and analyze protein-coding gene families may provide us with a more comprehensive landscape depicting how genes evolve within a well-known genome phylogeny.

Keywords: evolution; gene family; module architecture; partial homology; subgene rearrangement.


Figures

<sc>Fig</sc>. 1.
Fig. 1.
—Workflow used to analyze gene evolution at the gene and subgene levels. (A) Overview of the three major steps. (B) Reconstruction of the gene evolutionary history for each AST and ACC. (C) Five types of module evolutionary events. (D) Homologous gene family construction based on the RASs. The gene family to which a MA belongs depends on how the MA originated. (E) The schematic diagram of the RASfam algorithm demonstrates how to determine the most ancient module architecture(s) (MAMAs) of an extant MA. We traced the MAMA of each extant MA by detecting the origin of each of its modules. Meanwhile, the number of the inferred MAMAs is derived from the result of architecture scenario reconstruction. For example, as shown on the left side of (D), the top ACC reconstructed one MAMA, while the bottom two, although both ACCs presented two extant single-module architectures and one extant multimodule architecture. When RASfam is applied, “m1” and “m2” in (E) represented the blue and red module (architecture), respectively. Two scenarios were demonstrated: On the left side of (E), “MAMA1” and “MAMA2” also represent the blue and red module (architecture), respectively, and the extant blue-red architecture descended from MAMA1 and from MAMA2. On the right side of (E), “MAMA1” represented the blue-red architecture, from which the extant blue-red architecture originated. (F) The schematic diagram of the RASfam algorithm demonstrates how to construct the respective gene family of a MAMA.
<sc>Fig</sc>. 2.
Fig. 2.
—The relationships between different gene families. (A) We allow for five types of relationships and two detailed relations of “included” (“included-A” and “included-B”) for AST families and ACC-derived single families and three types of relationships to describe ACC-derived overlapping families. For a homologous gene family that was included, “included-A” means that other homologous gene families overlapping with the family were identified by the methods, and “included-B” means that other homologous gene families were also included in this family. Multimodule architecture is abbreviated “MMA.” “MMA solely divided” means that proteins with an MMA were assigned to a unique family. “MMA partially divided” describes proteins with an MMA that were assigned to different families. “MMA partially and solely divided” represents cases in which some MMAs in an ACC were assigned to a unique family and some MMAs were partially divided into different families. Yellow solid circles denote homologous gene families, and gray hollow circles denote gene families identified by OrthoFinder or CompositeSearch. (B) Distribution of relationships for homologous gene families and gene families obtained with other methods.
<sc>Fig</sc>. 3.
Fig. 3.
—The inferred gene families and evolutionary history of RabX5-PB and RpL23A-PA. (A) The different families were constructed using different methods. (B) The architecture scenario of the ACC contains RabX5-PB and RpL23A-PA. M denotes a merge event, and L denotes a loss event. (C) The sequence evolutionary history inferred by combining two module trees. Each module tree was reconstructed by SPIMAP and reconciled with the species tree using maximum parsimonious reconciliation. The two module trees were merged manually with Adobe Illustrator software. F denotes a fusion event occurring on the node with an in-degree of two.
<sc>Fig</sc>. 4.
Fig. 4.
—Gene family expansion and contraction. The number of family expansions and contractions is given on each branch of the species tree. The colors of numbers represent the amount of size change of the corresponding family type. The pie shows the expanded gene families: Its red part represents the AST families, and the blue part indicates the ACC-derived families. The percentages of significantly expanded ACC-derived overlapping families in all expanded ACC-derived families along each leaf branch are shown in the heatmap.
<sc>Fig</sc>. 5.
Fig. 5.
—Module rearrangement types of ACC-derived families whose size foldchange was >=2 and that generated only novel proteins in corresponding species. (A) Examples showing how evolutionary events occur in combination at the subgene level. D, duplication; S, split; M, merge; L, loss. (B) Distribution of module rearrangement types in each lineage. The values represent the percentage of expanded families of each type within a species.
<sc>Fig</sc>. 6.
Fig. 6.
—Distributions of module rearrangement events among the nine species. The upper portion shows the distribution when only multimodule architectures are formed, and the bottom portion shows the distribution when only single-module architectures are formed. In the bottom part, the columns are colored in gray when the corresponding module rearrangement event cannot form single-module architectures.

Similar articles

References

    1. Abascal F, Zardoya R, Telford MJ.. 2010. TranslatorX: multiple alignment of nucleotide sequences guided by amino acid translations. Nucleic Acids Res. 38(Suppl 2):W7–W13. - PMC - PubMed
    1. Altschul SF, et al. 1997. Gapped BLAST and PSI-BLAST: a new generation of protein database search programs. Nucleic Acids Res. 25(17):3389–3402. - PMC - PubMed
    1. Andreeva A, et al. 2014. SCOP2 prototype: a new approach to protein structure mining. Nucleic Acids Res. 42(D1):D310–D314. - PMC - PubMed
    1. Ane C, et al. 2006. Bayesian estimation of concordance among gene trees. Mol Biol Evol. 24(2):412–426. - PubMed
    1. Armisén D, et al. 2018. The genome of the water strider Gerris buenoi reveals expansions of gene repertoires associated with adaptations to life on the water. BMC Genomics. 19(1):832. - PMC - PubMed

Publication types

Substances

LinkOut - more resources