. 2020 May;132(5):1003-1016.
doi: 10.1097/ALN.0000000000003182.

Spectral and Entropic Features Are Altered by Age in the Electroencephalogram in Patients under Sevoflurane Anesthesia

Affiliations

Spectral and Entropic Features Are Altered by Age in the Electroencephalogram in Patients under Sevoflurane Anesthesia

Matthias Kreuzer et al. Anesthesiology. 2020 May.

Abstract

Background: Preexisting factors such as age and cognitive performance can influence the electroencephalogram (EEG) during general anesthesia. Specifically, spectral EEG power is lower in elderly, compared to younger, subjects. Here, the authors investigate age-related changes in EEG architecture in patients undergoing general anesthesia through a detailed examination of spectral and entropic measures.

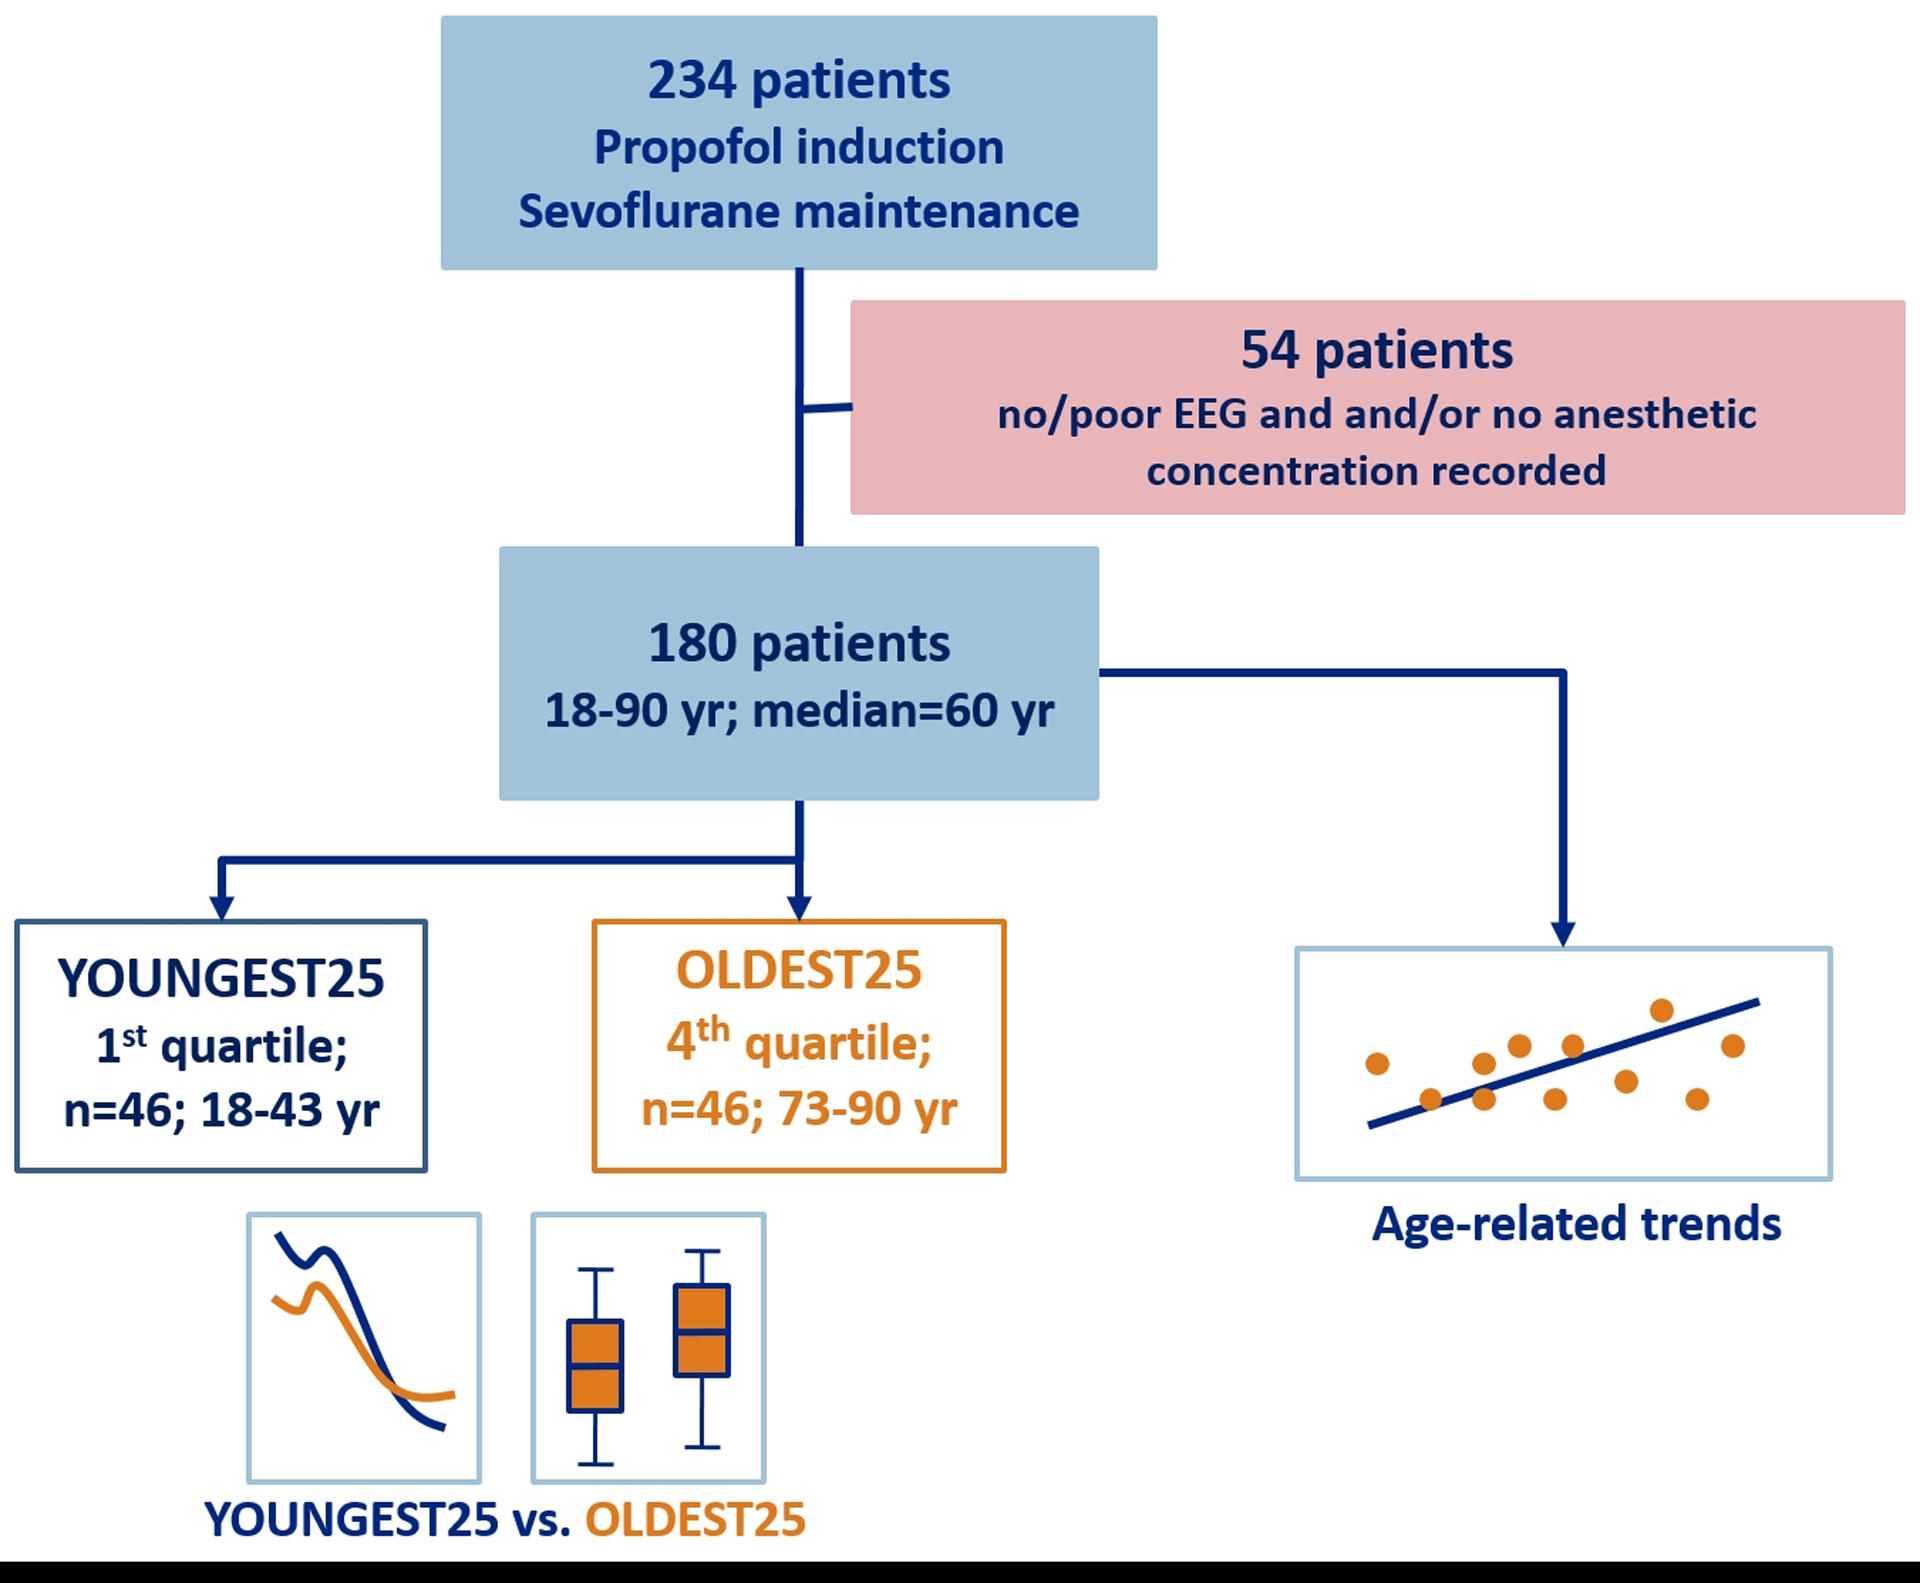
Methods: The authors retrospectively studied 180 frontal EEG recordings from patients undergoing general anesthesia, induced with propofol/fentanyl and maintained by sevoflurane at the Waikato Hospital in Hamilton, New Zealand. The authors calculated power spectral density and normalized power spectral density, the entropic measures approximate and permutation entropy, as well as the beta ratio and spectral entropy as exemplary parameters used in current monitoring systems from segments of EEG obtained before the onset of surgery (i.e., with no noxious stimulation).

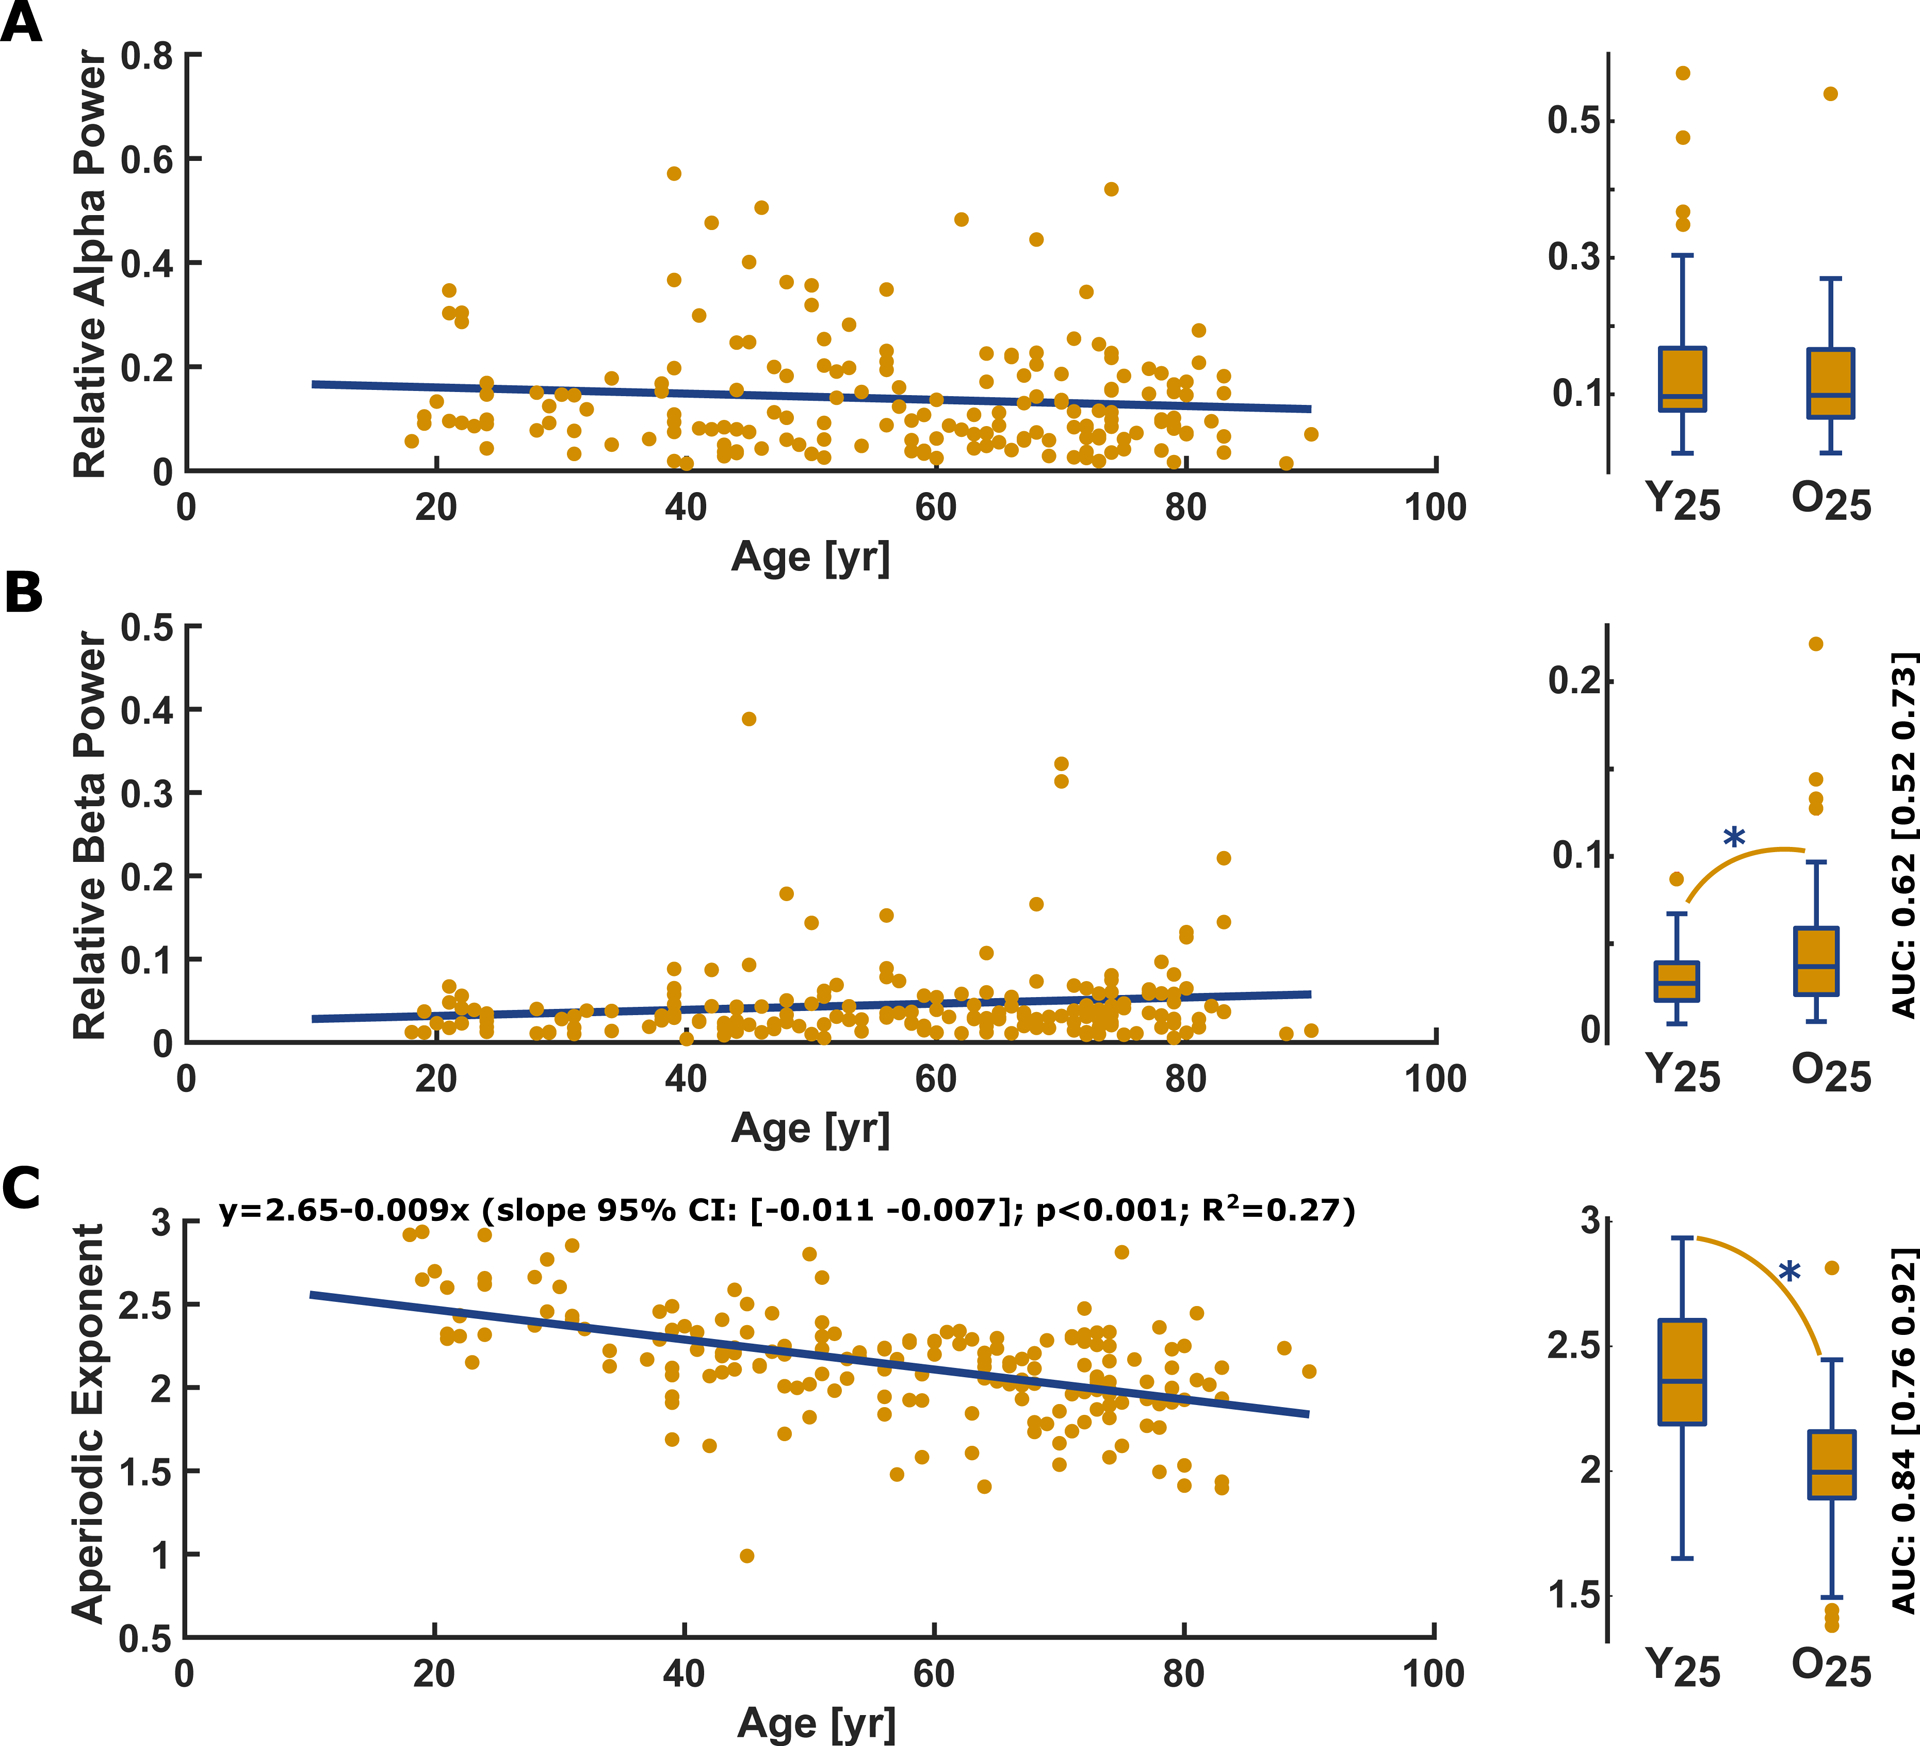
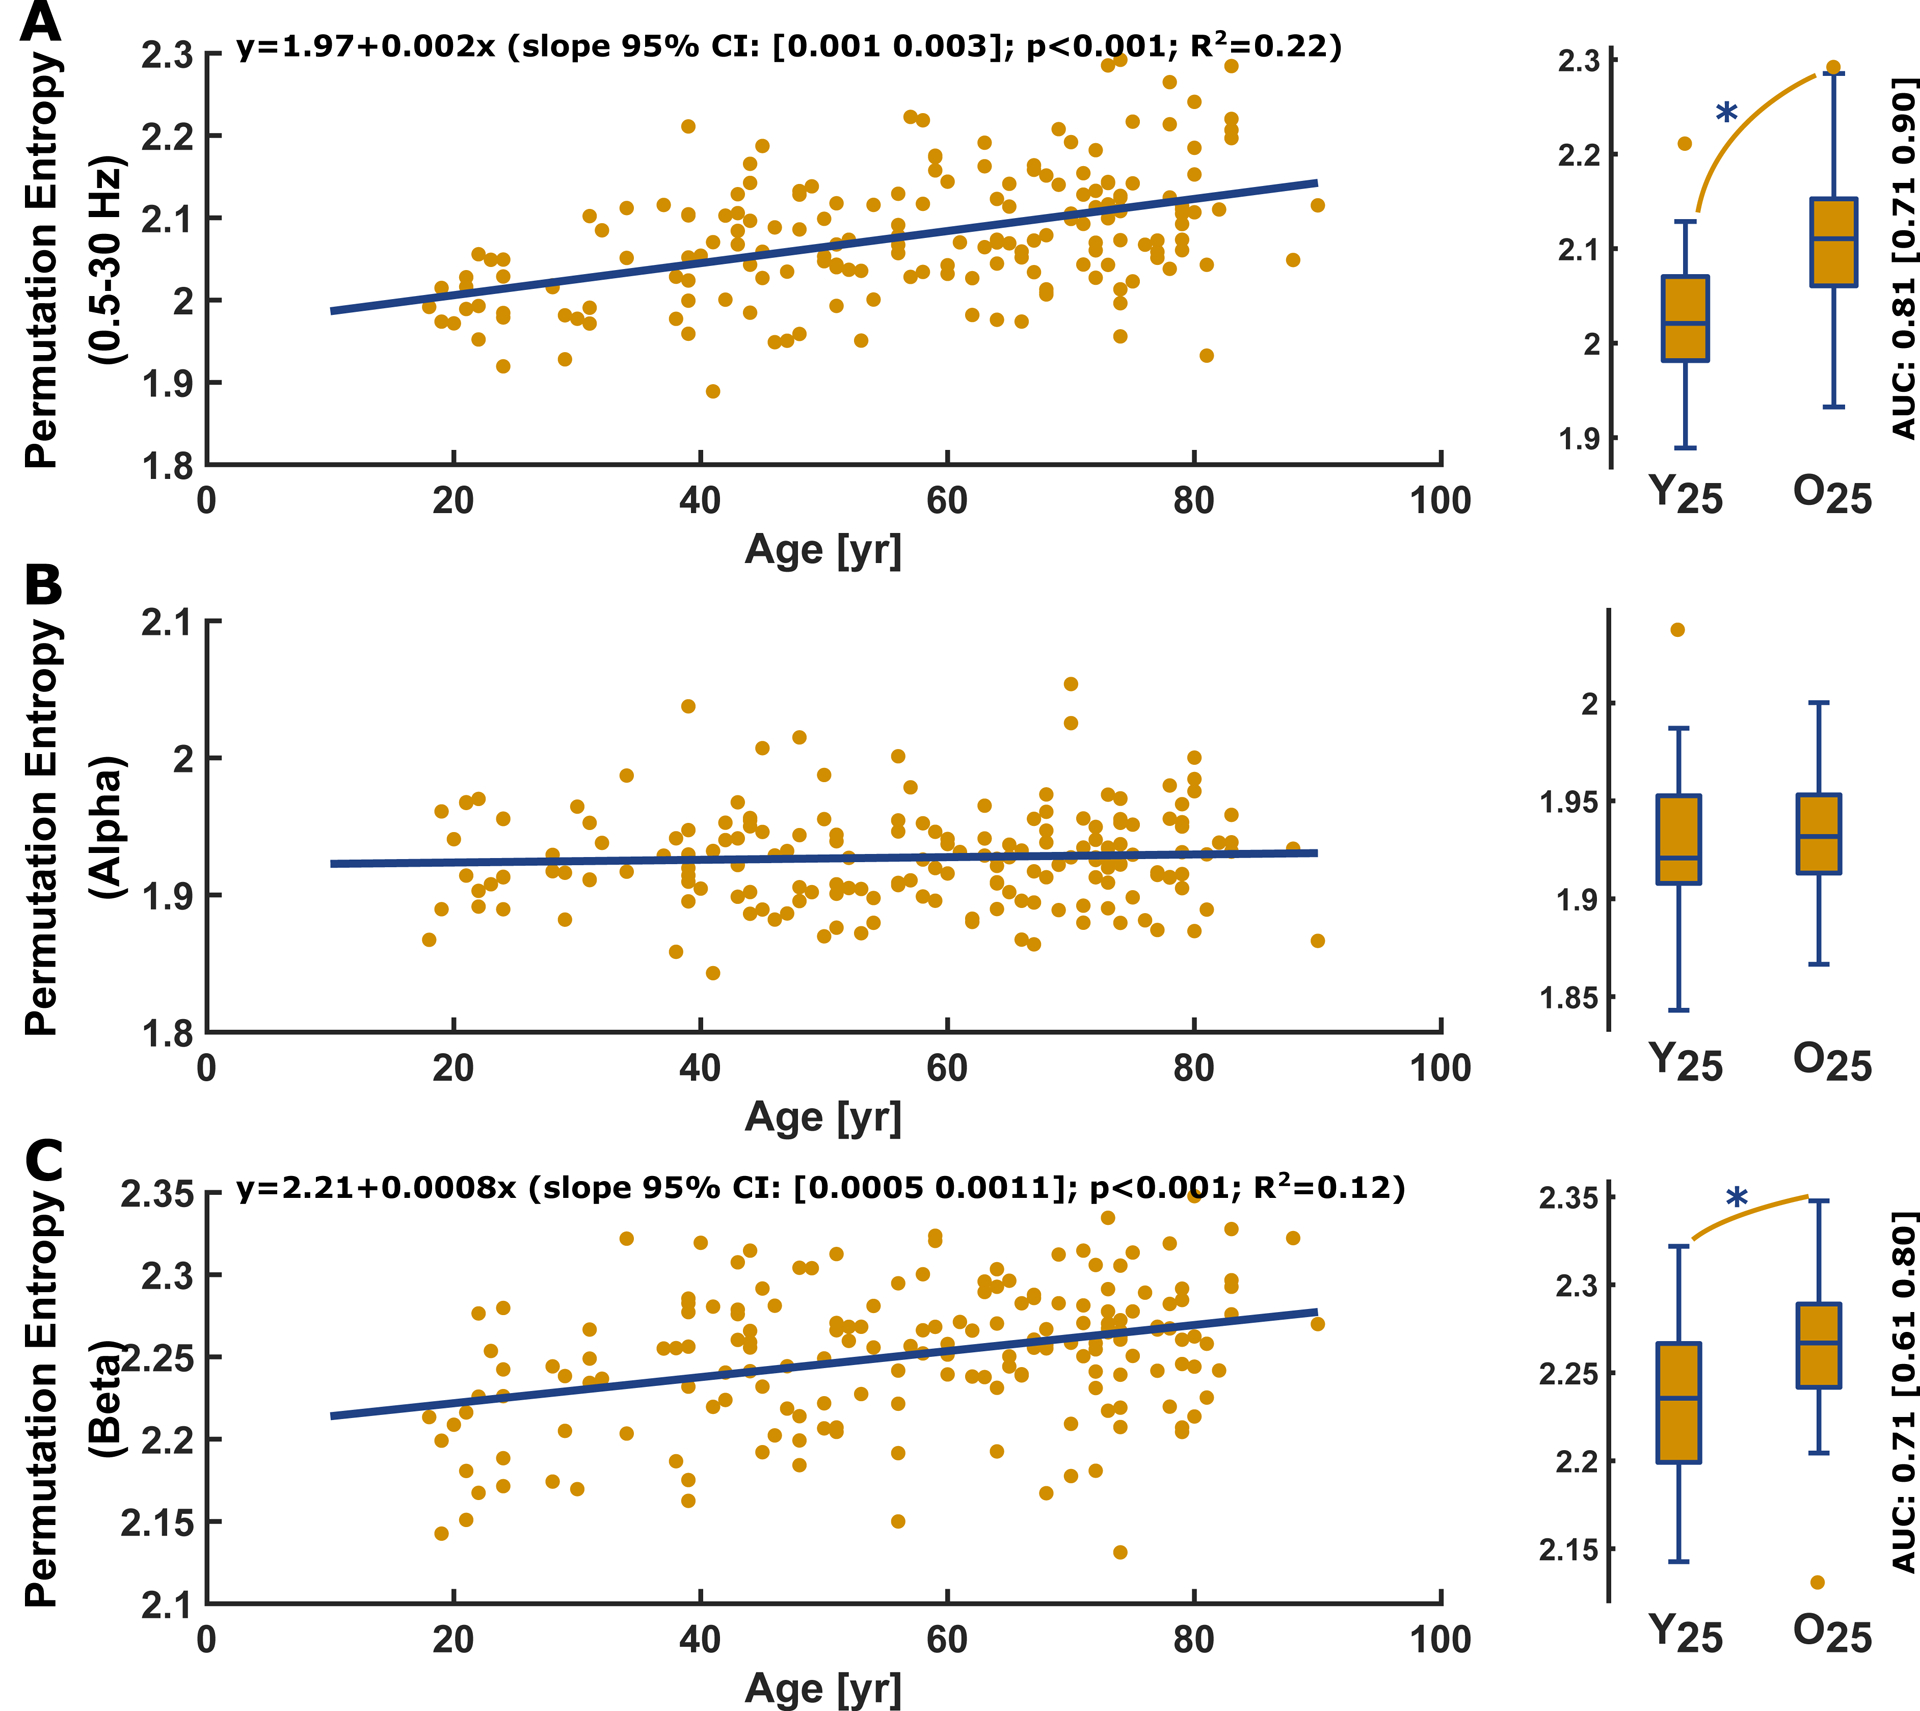
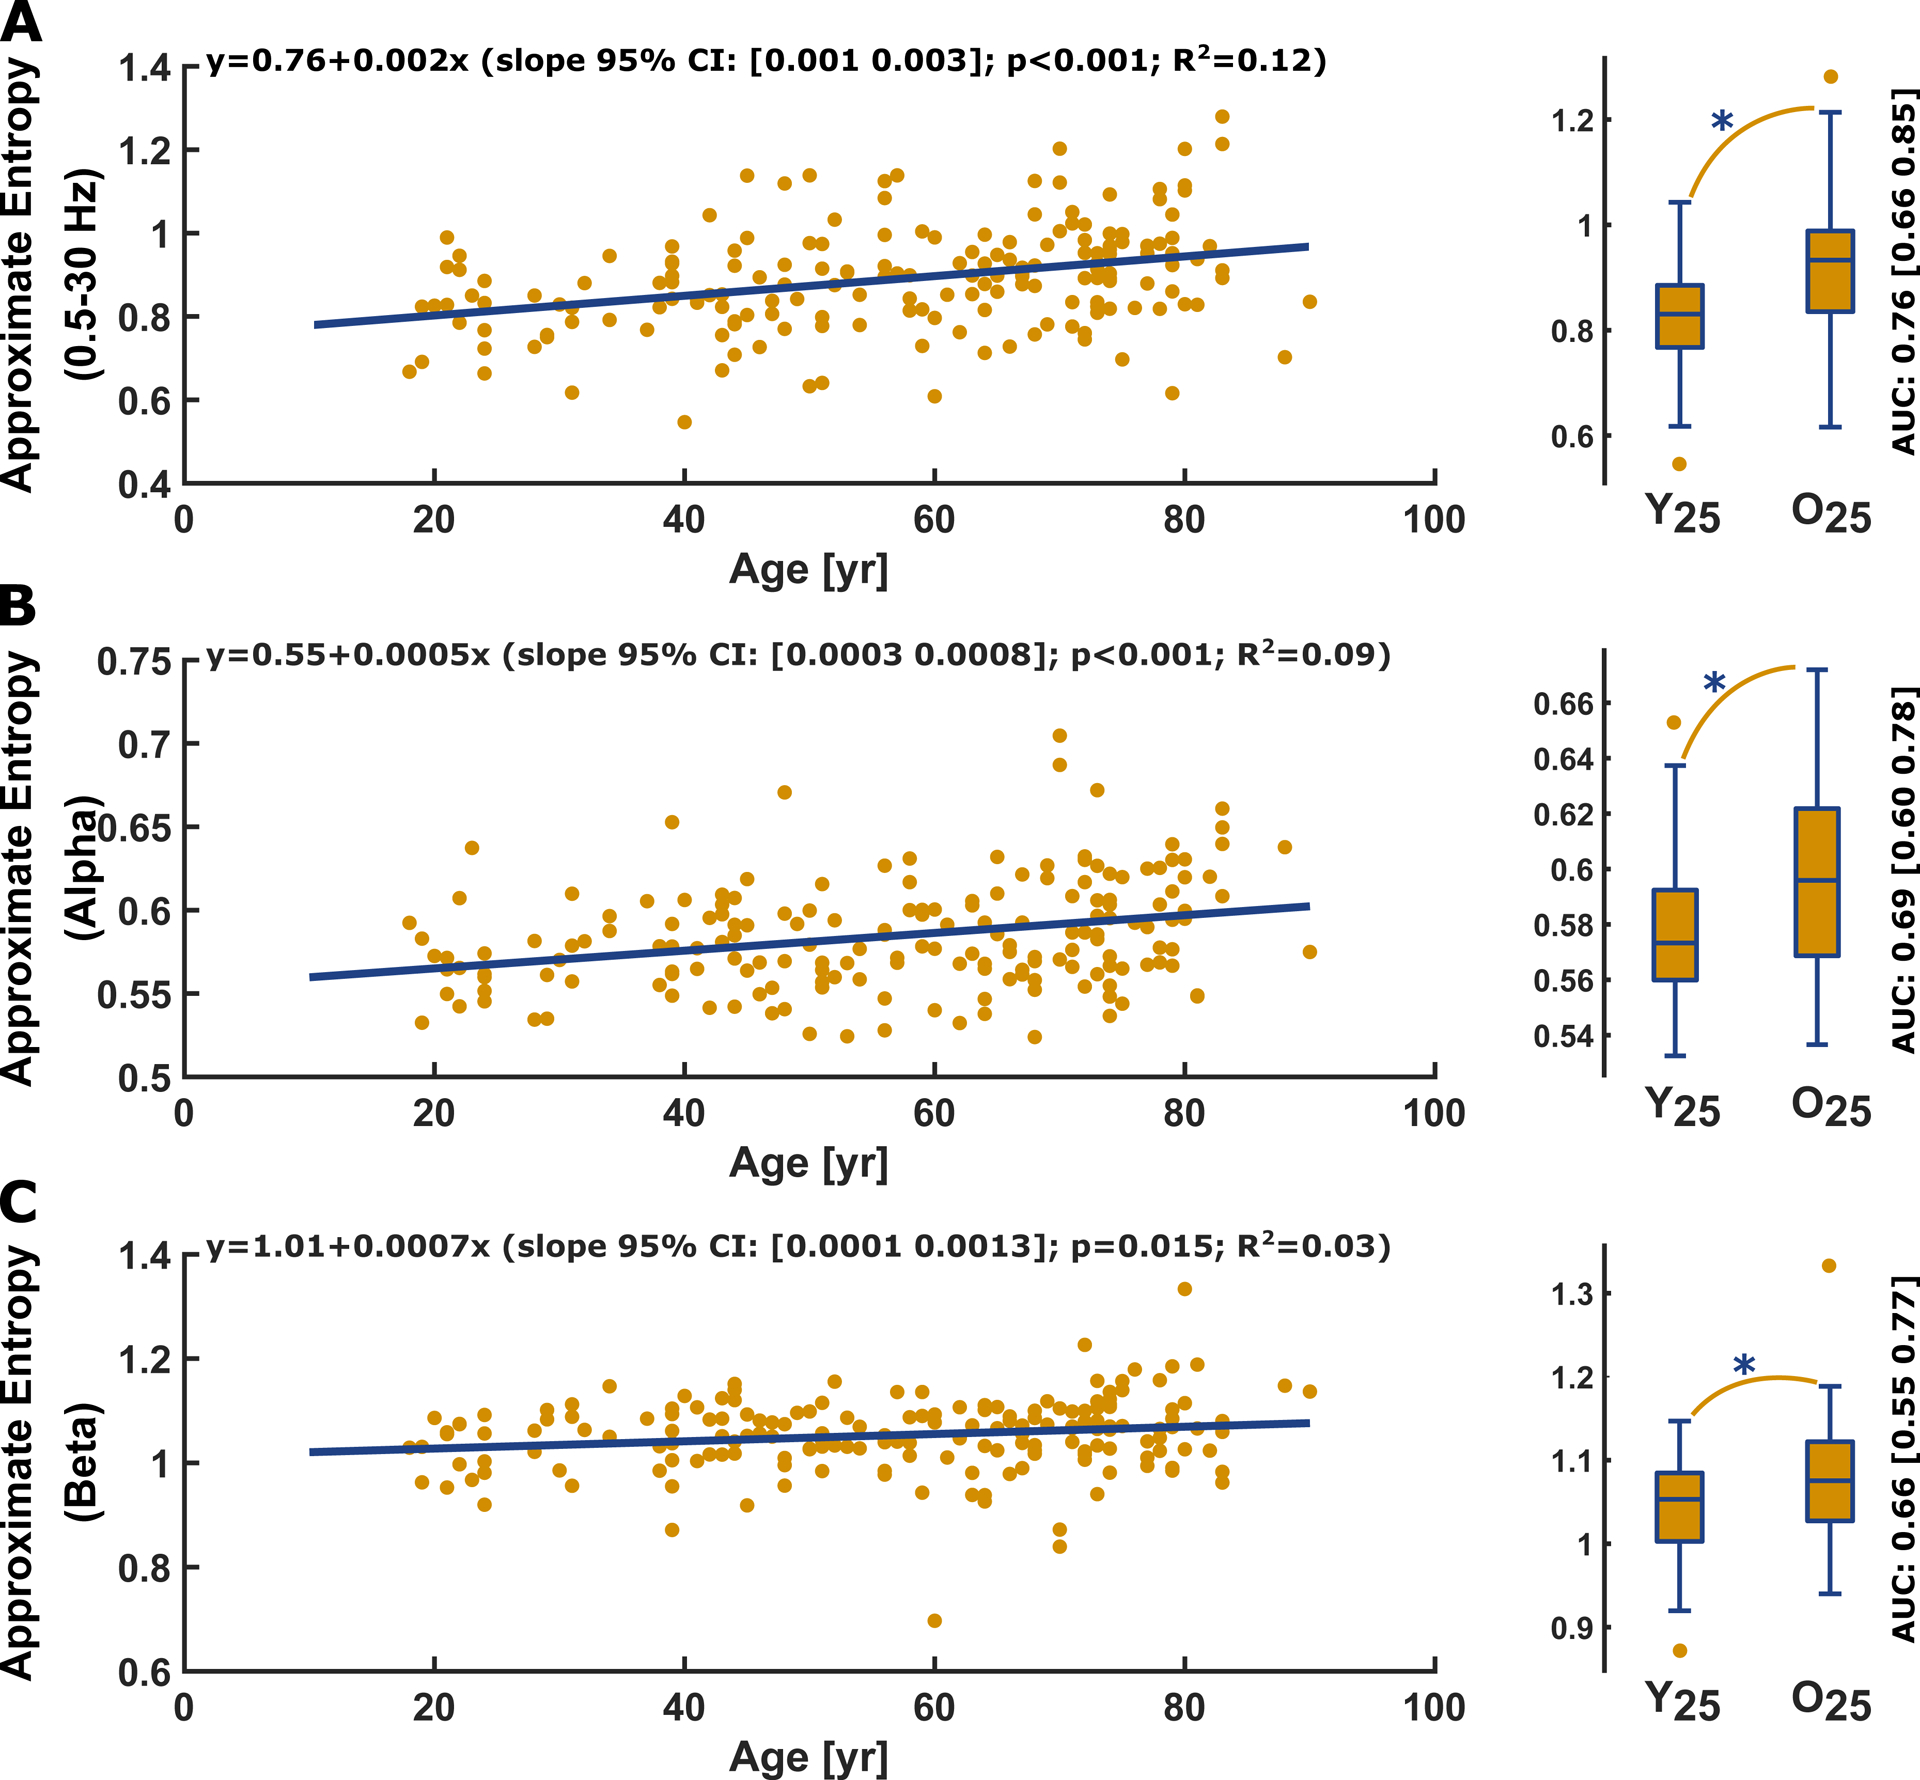
Results: The oldest quartile of patients had significantly lower 1/f characteristics (P < 0.001; area under the receiver operating characteristics curve, 0.84 [0.76 0.92]), indicative of a more uniform distribution of spectral power. Analysis of the normalized power spectral density revealed no significant impact of age on relative alpha (P = 0.693; area under the receiver operating characteristics curve, 0.52 [0.41 0.63]) and a significant but weak effect on relative beta power (P = 0.041; area under the receiver operating characteristics curve, 0.62 [0.52 0.73]). Using entropic parameters, the authors found a significant age-related change toward a more irregular and unpredictable EEG (permutation entropy: P < 0.001, area under the receiver operating characteristics curve, 0.81 [0.71 0.90]; approximate entropy: P < 0.001; area under the receiver operating characteristics curve, 0.76 [0.66 0.85]). With approximate entropy, the authors could also detect an age-induced change in alpha-band activity (P = 0.002; area under the receiver operating characteristics curve, 0.69 [0.60 78]).

Conclusions: Like the sleep literature, spectral and entropic EEG features under general anesthesia change with age revealing a shift toward a faster, more irregular, oscillatory composition of the EEG in older patients. Age-related changes in neurophysiological activity may underlie these findings however the contribution of age-related changes in filtering properties or the signal to noise ratio must also be considered. Regardless, most current EEG technology used to guide anesthetic management focus on spectral features, and improvements to these devices might involve integration of entropic features of the raw EEG.


Conflict of interest statement

Conflicts of Interest: The authors declare no competing interests

Figures

Figure 1:
Figure 1:
Flow chart of the excluded patients and groups defined for analysis
Figure 2:
Figure 2:. normalized power spectral density exemplary raw EEG traces, and the aperiodic (1/f) component from young and old patients.
A) Median (±median absolute deviation) normalized power spectral density plots of EEG derived from the Y25 (blue) and O25 (orange) patients of the data set. power spectral density is presented with corresponding AUC values and bootstrapped 95% confidence intervals. The relative power spectral density indicated a more uniform distribution of the EEG from the old group with lower relative power at low frequencies (0.5–5 Hz) and higher relative power at high frequencies (>21 Hz). B) Exemplary raw EEG traces from patients in the Y25 group (blue) and O25 group (orange). These traces highlight the age-induced differences on the EEG, especially fewer slow oscillations and an increased amount of high frequent activity. C) Median (±median absolute deviation) of the exponential fit of the aperiodic (background) 1/f component between the Y25 (blue) and O25 (orange) patients. In addition, the AUC values and 95% bootstrapped confidence intervals are presented. In general, the aperiodic component of the power spectral density was more uniformly distributed in the old patients. Filled circles indicate a significant difference, between Y25 and O25 evaluated by AUC confidence intervals excluding 0.5. The areas of light colors indicate the median absolute deviation. In the boxplots, the circles indicate outliers as defined by the MATLAB plotting routine. They were not excluded from analysis. Y25: youngest 25% O25: oldest 25%
Figure 3:
Figure 3:. Linear regression and box plots of the youngest vs. the oldest quartile for (A) the relative (normalized) EEG alpha power, (B) the relative EEG beta power, and (C) the slope of the aperiodic 1/f component with corresponding box plots.
A) Relative power in the alpha-band EEG did not significantly (p= 0.176, t-statistic: −1.36) change with age. There was no significant difference (p= 0.693, AUC= 0.52 [0.42 0.63]) in relative alpha power between Y25 (0.10 [0.08 0.17]) and O25 (0.10 [0.07 0.17]). B) Relative EEG beta power did not significantly (p=0.077, t-statistic: 1.78) change with age, but there was a significant difference (p= 0.041) in relative beta power between Y25 (0.03 [0.02 0.04]) and O25 (0.04 [0.02 0.06]). The AUC=0.62 [0.52 0.73] as effect site indicated a “poor” effect C) The slope of the aperiodic 1/f component derived by the fitting oscillations & one over f algorithm significantly decreased with age (p<0.001, t-statistic: −8.14). The box plot indicates a significant flatter (p<0.001) slope in O25 patients (median [1st 3rd quartile]: 2.00 [1.89 2.16]) compared to the Y25 (2.36 [2.19 2.60]). The AUC=0.84 [0.76 0.92] as effect site indicated a “good” effect. In the regression plots, the yellow dots present the single patients and the blue line the linear fit. Y25: youngest 25% O25: oldest 25%; yr: year
Figure 4:
Figure 4:. Permutation entropy (m=3, τ=1): Linear regression and box plots of the youngest vs. the oldest quartile for the (A) 0.5–30 Hz range, (B) the alpha range, (C) and the EEG beta range.
A) Permutation entropy of the 0.5–30 Hz filtered EEG significantly increased (p<0.001, t-statistic: 7.04) with age. Age had a “good” and significant (p<0.001; AUC=0.81 [0.71 0.90]) effect on permutation entropy as depicted in the comparison between Y25 (2.02 [1.98 2.07]) and O25 (2.11 [2.06 2.15]). B) Permutation entropy of the alpha-band EEG showed no significant age-related effect (p=0.489, t-statistic: 0.69) and the AUC for the comparison between Y25 and O25 indicated no effect (p=0.384; AUC=0.55 [0.43 0.67]). C) Permutation entropy of the beta-band EEG significantly (p>0.001, t-statistic: 4.95) increased with age. Age had a “fair” and significant (p<0.001; AUC= 0.71 [0.61 0.80]) effect on permutation entropy as depicted in the comparison between Y25 (2.24 [2.20 2.27]) and O25 (2.27 [2.24 2.29]). In the regression plots, the yellow dots present the single patients and the blue line the linear fit. In the boxplots, the circles indicate outliers as defined by the MATLAB plotting routine. They were not excluded from analysis. Y25: youngest 25% O25: oldest 25%; yr: year
Figure 5:
Figure 5:. Approximate entropy (m=2, r=0.2SD, τ=1) vs. age and corresponding youngest vs. oldest quartile box plot for the (A) 0.5–30 Hz EEG range, (B) the EEG alpha range, (C) and the EEG beta range.
A) Approximate entropy of the 0.5–30 Hz filtered EEG significantly (p<0.001, t-statistic: 4.87) increased with age. Age had a “fair” and significant (p<0.001; AUC= 0.76 [0.66 0.85]) effect on approximate entropy as depicted in the comparison between Y25 (0.83 [0.77 0.89]) and O25 (0.93 [0.84 0.99]). B) Approximate entropy of the alpha-band EEG significantly (p<0.001, t-statistic 4.18) increased with age. Age had a “poor”/”fair” and significant (p=0.002; AUC= 0.69 [0.60 0.78]) effect on approximate entropy as depicted in the comparison between Y25 (0.57 [0.56 0.59]) and O25 (0.60 [0.57 0.62]) C) Approximate entropy of the beta-band EEG significantly increased with age (p=0.015; AUC=0.66 [0.55 0.77]). Age had a “fair” and significant effect on approximate entropy as depicted in the comparison between O25 (1.08[1.03 1.12]) and Y25 (1.05 [1.00 1.08]) of the data set. In the regression plots, the yellow dots present the single patients and the blue line the linear fit. In the boxplots, the circles indicate outliers as defined by the MATLAB plotting routine. They were not excluded from analysis. Y25: youngest 25% O25: oldest 25%; yr: year

Comment in

References

    1. Delafuente JC: The silver tsunami is coming: will pharmacy be swept away with the tide? Am. J. Pharm. Educ 2009; 73: 1. - PMC - PubMed
    1. Etzioni DA, Liu JH, Maggard MA, Ko CY: The aging population and its impact on the surgery workforce. Ann. Surg 2003; 238: 170. - PMC - PubMed
    1. Fritz BA, Kalarickal PL, Maybrier HR, Muench MR, Dearth D, Chen Y, Escallier KE, Ben Abdallah A, Lin N, Avidan MS: Intraoperative Electroencephalogram Suppression Predicts Postoperative Delirium. Anesth. Analg 2016; 122: 234–42 - PMC - PubMed
    1. Radtke F, Franck M, Hagemann L, Seeling M, Wernecke K, Spies C: Risk factors for inadequate emergence after anesthesia: emergence delirium and hypoactive emergence. Minerva Anestesiol. 2010; 76: 394–403 - PubMed
    1. Watson PL, Shintani AK, Tyson R, Pandharipande PP, Pun BT, Ely EW: Presence of electroencephalogram burst suppression in sedated, critically ill patients is associated with increased mortality. Crit. Care Med 2008; 36: 3171–7 - PMC - PubMed

Publication types