. 2020 Feb 27;7(1):69.
doi: 10.1038/s41597-020-0412-z.

A multi-omics dataset of heat-shock response in the yeast RNA binding protein Mip6

Affiliations

A multi-omics dataset of heat-shock response in the yeast RNA binding protein Mip6

Carme Nuño-Cabanes et al. Sci Data. .

Abstract

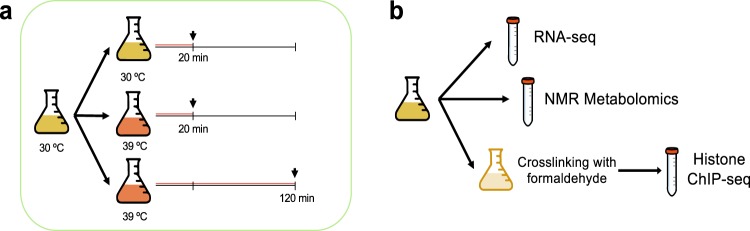
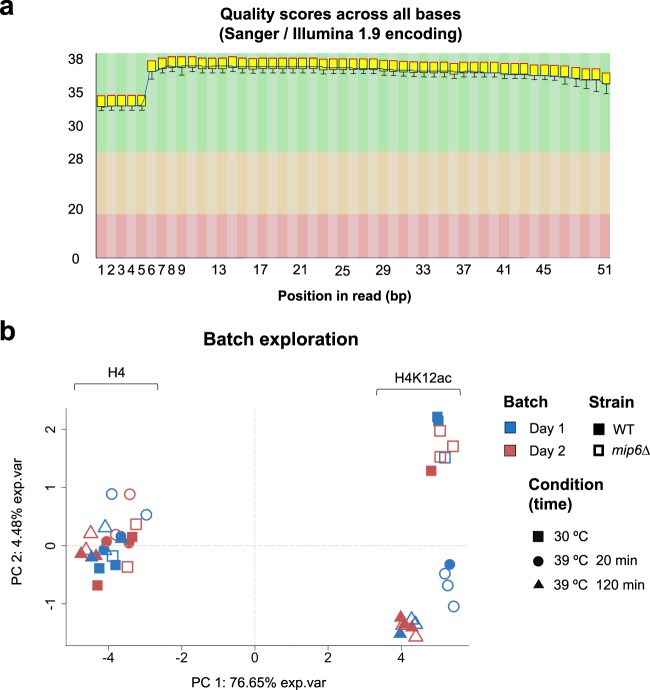
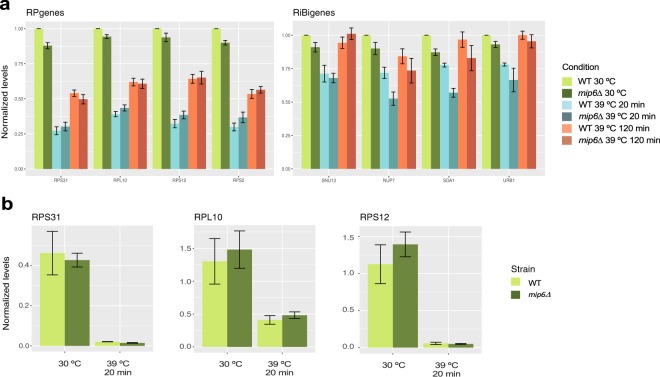
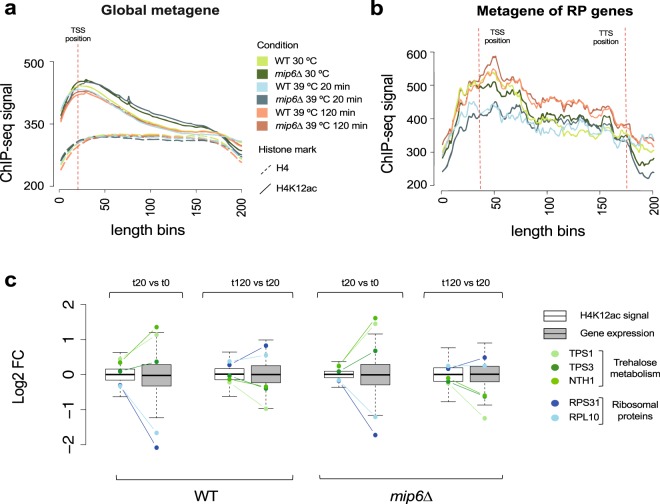
Gene expression is a biological process regulated at different molecular levels, including chromatin accessibility, transcription, and RNA maturation and transport. In addition, these regulatory mechanisms have strong links with cellular metabolism. Here we present a multi-omics dataset that captures different aspects of this multi-layered process in yeast. We obtained RNA-seq, metabolomics, and H4K12ac ChIP-seq data for wild-type and mip6Δ strains during a heat-shock time course. Mip6 is an RNA-binding protein that contributes to RNA export during environmental stress and is informative of the contribution of post-transcriptional regulation to control cellular adaptations to environmental changes. The experiment was performed in quadruplicate, and the different omics measurements were obtained from the same biological samples, which facilitates the integration and analysis of data using covariance-based methods. We validate our dataset by showing that ChIP-seq, RNA-seq and metabolomics signals recapitulate existing knowledge about the response of ribosomal genes and the contribution of trehalose metabolism to heat stress. Raw data, processed data and preprocessing scripts are made available.


Conflict of interest statement

The authors declare no competing interests.

Figures

Fig. 1
Fig. 1
Experimental design and sample management. (a) Treatment strategy. For each strain and replicate, a yeast culture flask was grown at 30 °C until the exponential phase, then split into three flasks, each of them receiving a different treatment. (b) Sampling strategy. From the same treatment flask, aliquots were collected for RNA-seq, metabolomics and ChIP-seq.
Fig. 2
Fig. 2
RNA-seq data preprocessing. (a) Example of base quality scores across all reads obtained by fastQC analysis, showing uniform read quality. (b) Biotype plot of NOISeq package, which indicates that the vast majority of detected features are protein-coding genes. (c) Batch effect correction. PCA score plots are represented. The left panel shows raw data where a day-of-culture batch effect is observed. The right plot shows the corrected data where this batch effect has been removed.
Fig. 3
Fig. 3
Batch effect correction of metabolomics data. PCA score plots are represented. (a) Raw data shows a slight day of culture batch effect for the 20 min 39 °C condition. (b) Batch effect corrected data.
Fig. 4
Fig. 4
ChIP-seq data preprocessing. (a) Example of base quality scores across all reads obtained by fastQC analysis. (b) PCA of H4 and H4K12ac data. The first PC indicates the type of ChIP-seq assay, while the second PC reflects the heat treatment in the H4K12ac samples. No batch effect is observed.
Fig. 5
Fig. 5
Replicability of processed data. Wild type 39 °C 120 minutes sample is selected as an example. Log2 transformed data are shown. (a) RNA-seq. (b) Metabolomics. (c) ChIP-seq (H4). (d) ChIP-seq (H4K12ac). Red diagonal line indicates perfect correlation between samples.
Fig. 6
Fig. 6
RP and RiBi gene expression levels during heat-shock response. (a) Expression levels of RP and RiBi genes (left and right panel, respectively) calculated from RNA-seq at different time-points of the heat-shock. WT and mip6Δ samples are depicted in lighter and darker colors, respectively. Each bar represents the mean of four biological replicates with the standard error of the mean (s.e.m.) shown as error bars. All values were normalized to the value of the WT at 30 °C. (b) Validation of the RNA-seq experiment results by RT-qPCR from samples incubated under 30 °C and 39 °C for 20 minutes. Each bar represents the mean of three biological replicates with s.e.m. shown as error bars. Values were calculated using the ΔΔCt method.
Fig. 7
Fig. 7
ChIP-seq data correlate with gene expression changes. (a) Global metagene indicates that H4K12 acetylation is mostly present at the Transcription Start Site (TSS) of genes. (b) Metagene analysis of RP genes reveal acetylation differences across time points. (c) Boxplot of log2FC values between consecutive time points for H4 and H4K12ac signals. Positions for marker RP and trehalose metabolism genes are indicated. Although signal distribution for RNA-seq is wider, positions at the data distribution for marker genes are shared between RNA-seq and ChIP-seq data.
Fig. 8
Fig. 8
Trehalose metabolism genes and metabolites during heat-shock response. (a) Expression levels of trehalose metabolism genes calculated from RNA-seq at different time-points after heat shock. WT and mip6Δ samples are depicted in lighter and darker colors, respectively. Each bar represents the mean of four biological replicates with the s.e.m. shown as error bars. All values were normalized to the value of the WT at 30 °C. Lower panel shows a scheme of trehalose metabolism in budding yeast where genes that codify for trehalose metabolism enzymes are represented in blue and metabolites in black. (b) Trehalose metabolite levels in WT and mip6Δ cells at different time points of the heat-shock. Each bar represents the mean of four biological replicates except for mip6Δ 39 °C 20 minutes value, which is calculated from three replicates. Error bars represent the s.e.m. *Indicates one-tailed unpaired Student’s t-test p-value < 0.05. (c) Trehalose metabolite levels in WT and mip6Δpes4Δ cells under 30 °C and 39 °C 20 minutes conditions. Each bar represents the mean of three biological replicates with the s.e.m. shown as error bars. * indicates one-tailed unpaired Student’s t-test p-value < 0.05. (d) Correlation network of trehalose metabolism. Genes are showed in gray boxes and metabolites are represented using green ellipses. The color intensity and thickness of edges are proportional to the correlation values between nodes. Correlations lower than 0.5 are not showed. For network clarity, some direct associations were omitted if an intermediate node exists to infer such connection.

References

    1. Rodríguez-Navarro S, Hurt E. Linking gene regulation to mRNA production and export. Curr. Opin. Cell. Biol. 2011;23:302–309. doi: 10.1016/j.ceb.2010.12.002. - DOI - PubMed
    1. García-Oliver E, García-Molinero V, Rodríguez-Navarro S. mRNA export and gene expression: The SAGA–TREX-2 connection. BBA-Gene Regul. Mech. 2012;1819:555–565. - PubMed
    1. Kouzarides T. Chromatin Modifications and Their Function. Cell. 2007;128:693–705. doi: 10.1016/j.cell.2007.02.005. - DOI - PubMed
    1. Zhang T, Cooper S, Brockdorff N. The interplay of histone modifications – writers that read. EMBO Rep. 2015;16:1467–1481. doi: 10.15252/embr.201540945. - DOI - PMC - PubMed
    1. Woo H, Dam HS, Lee SB, Buratowski S, Kim T. Modulation of gene expression dynamics by co-transcriptional histone methylations. Exp. Mol. Med. 2017;49:e326. doi: 10.1038/emm.2017.19. - DOI - PMC - PubMed

Publication types