Clinical Trial
. 2020 Feb 27;10(1):3577.
doi: 10.1038/s41598-020-60358-y.

Segmental Bioelectrical Impedance Spectroscopy to Monitor Fluid Status in Heart Failure

Affiliations
Clinical Trial

Segmental Bioelectrical Impedance Spectroscopy to Monitor Fluid Status in Heart Failure

Matthias Daniel Zink et al. Sci Rep. .

Abstract

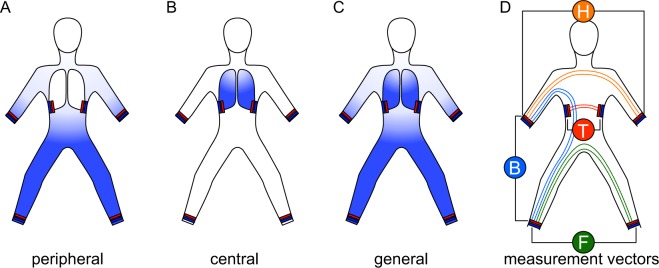
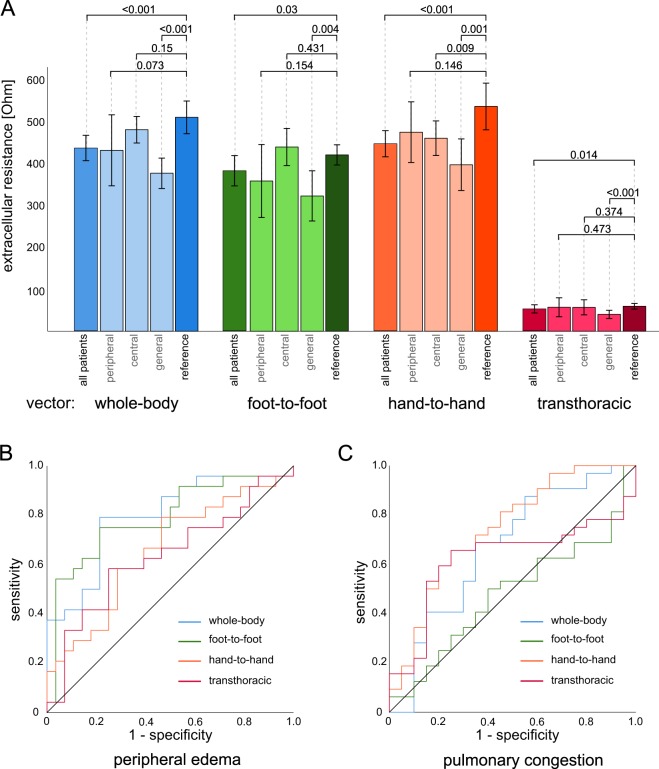
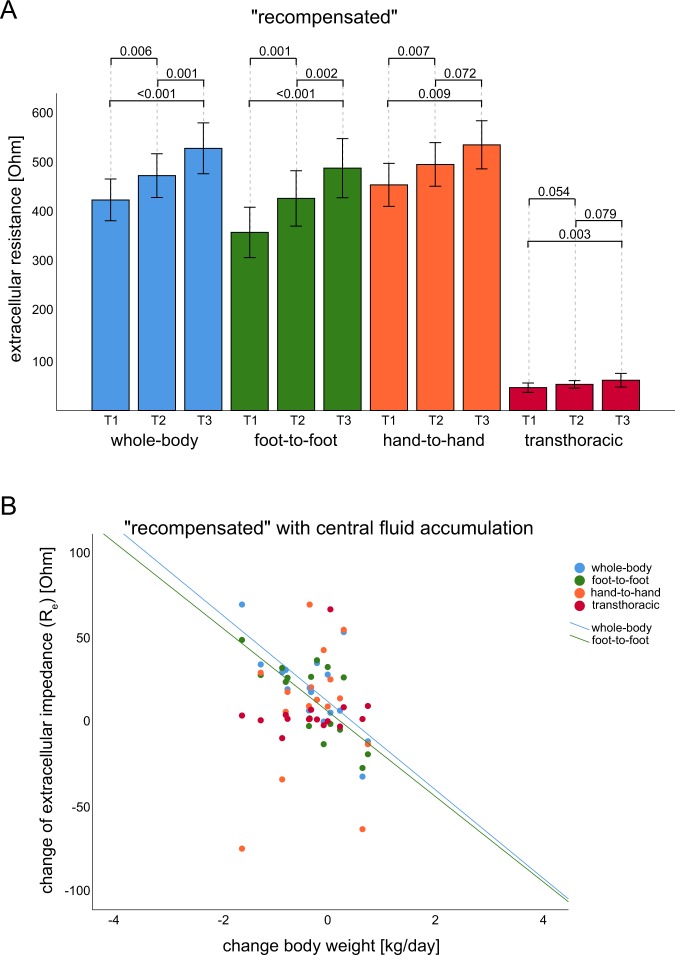
Bioelectrical impedance spectroscopy (BIS) measures body composition, including fluid status. Acute decompensated heart failure (ADHF) is associated with fluid overload in different body compartments. This investigation aimed to evaluate the feasibility of measuring and monitoring fluid accumulation in patients with ADHF using BIS. The extracellular impedance as a surrogate marker for fluid accumulation was measured in 67 participants (25 healthy reference volunteers and 42 patients admitted with ADHF) using BIS in the "transthoracic", "foot-to-foot", "whole-body" and "hand-to-hand" segments. At baseline, BIS showed significantly lower extracellular resistance values for the "whole-body" (P < 0.001), "foot-to-foot" (P = 0.03), "hand-to-hand" (P < 0.001) and "transthoracic" (P = 0.014) segments in patients with ADHF than the reference cohort, revealing a specific pattern for peripheral, central and general fluid accumulation. The "foot-to-foot" (AUC = 0.8, P < 0.001) and "hand-to-hand" (AUC = 0.74, P = 0.04) segments indicated compartments of fluid accumulation with good prediction. During cardiac recompensation, BIS values changed significantly and were in line with routine parameters for monitoring ADHF. Mean bodyweight change per day correlated moderately to good with BIS values in the "whole-body" (r = -0.4), "foot-to-foot" (r = -0.8) and "transthoracic" (r = -0.4) segments. Based on our analysis, we conclude that measuring and monitoring fluid accumulation in ADHF using segmental BIS is feasible and correlates with clinical parameters during recompensation.


Conflict of interest statement

The authors declare no competing interests.

Figures

Figure 1
Figure 1
Fluid distribution and segments. At baseline, the cohort was separated into 3 groups related to the fluid overload identified by admission anamnesis and diagnostics (blue indicates fluid overload). (A) Peripheral oedema. (B) Central oedema. (C) Peripheral and central oedema considered as general fluid overload. (D) Each BIS measurement was performed in 4 segments: “foot-to-foot” (F, green), “hand-to-hand” (H, orange), “foot-to-hand” as a surrogate for the “whole-body” (B, blue) and “transthoracic” (T, red) segment (detailed description of electrode position: Supplemental Material, chapter 2).
Figure 2
Figure 2
Segmental BIS measurements revealed specific patterns related to the fluid overload in body compartments. (A) For participants with clinical peripheral oedema (N = 12), baseline extracellular resistance was depressed in the “whole-body” and “foot-to-foot” segments. Patients with central oedema showed significantly lower extracellular resistance in the “hand-to-hand” (P = 0.009) segment. Patients with general fluid accumulation showed significantly lower extracellular resistance in all segments compared to the reference group. (B) Identification of peripheral fluid accumulation with good prediction for the “whole-body” (AUC = 0.8) and “foot-to-foot” (AUC = 0.79) segments. (C) Identification of pulmonary congestion as central accumulation with moderate to good prediction “whole-body” (AUC = 0.7, P = 0.044, S = 69%, F = 65%), “hand-to-hand” (AUC = 0.74) and “transthoracic” (AUC = 0.62) segments.
Figure 3
Figure 3
Timely change in BIS values in the measured segments of the “recompensated” group. (A) Course of BIS measurement for the “recompensated” group at all time points. All measured segments showed a significant increase from T1 to T3 as a result of diuretic therapy. (B) Mean change in bodyweight [kg] per day and mean change in BIS values for the “central” fluid accumulation subgroup showed a good linear correlation for the “whole-body” (r = −0.429, P = 0.036) and “foot-to-foot” (r = −0.787, P < 0.001) segment, while the “hand-to-hand” and “transthoracic” segment showed no significant correlation. For the significant correlation in the “whole-body” and “foot-to-foot” segment, the linear correlation line is shown. T1 baseline measurement, T2 average of all measurements between baseline and final measurement, T3 final measurement.

References

    1. Ponikowski P, et al. ESC Guidelines for the diagnosis and treatment of acute and chronic heart failure: The Task Force for the diagnosis and treatment of acute and chronic heart failure of the European Society of Cardiology (ESC)Developed with the special contribution of the Heart Failure Association (HFA) of the ESC. Eur. Heart J. 2016;37:2129–2200. doi: 10.1093/eurheartj/ehw128. - DOI - PubMed
    1. Yancy CW, et al. ACCF/AHA guideline for the management of heart failure: executive summary: a report of the American College of Cardiology Foundation/American Heart Association Task Force on practice guidelines. Circulation. 2013;128:1810–1852. doi: 10.1161/CIR.0b013e31829e8807. - DOI - PubMed
    1. Kelder JC, et al. The diagnostic value of physical examination and additional testing in primary care patients with suspected heart failure. Circulation. 2011;124:2865–2873. doi: 10.1161/CIRCULATIONAHA.111.019216. - DOI - PubMed
    1. Roberts E, et al. The diagnostic accuracy of the natriuretic peptides in heart failure: systematic review and diagnostic meta-analysis in the acute care setting. BMJ. 2015;350:h910. doi: 10.1136/bmj.h910. - DOI - PMC - PubMed
    1. Davie AP, Love MP, McMurray JJ. Value of ECGs in identifying heart failure due to left ventricular systolic dysfunction. BMJ. 1996;313:300–301. doi: 10.1136/bmj.313.7052.300c. - DOI - PMC - PubMed

Publication types