. 2020 Apr 14;30(4):2307-2320.
doi: 10.1093/cercor/bhz241.

Polygenic Architecture of Human Neuroanatomical Diversity

Affiliations

Polygenic Architecture of Human Neuroanatomical Diversity

Anne Biton et al. Cereb Cortex. .

Erratum in

  • Corrigendum: Polygenic Architecture of Human Neuroanatomical Diversity.
    Biton A, Traut N, Poline JB, Aribisala BS, Bastin ME, Bülow R, Cox SR, Deary IJ, Fukunaga M, Grabe HJ, Hagenaars S, Hashimoto R, Kikuchi M, Muñoz Maniega S, Nauck M, Royle NA, Teumer A, Valdés Hernández M, Völker U, Wardlaw JM, Wittfeld K, Yamamori H; Alzheimer’s Disease Neuroimaging Initiative; Bourgeron T, Toro R. Biton A, et al. Cereb Cortex. 2020 May 14;30(5):3435-3436. doi: 10.1093/cercor/bhaa093. Cereb Cortex. 2020. PMID: 32249901 Free PMC article. No abstract available.

Abstract

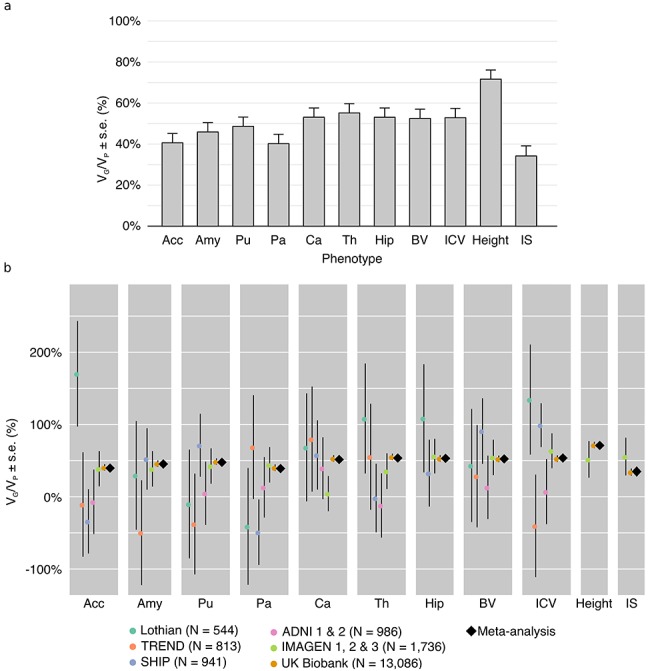
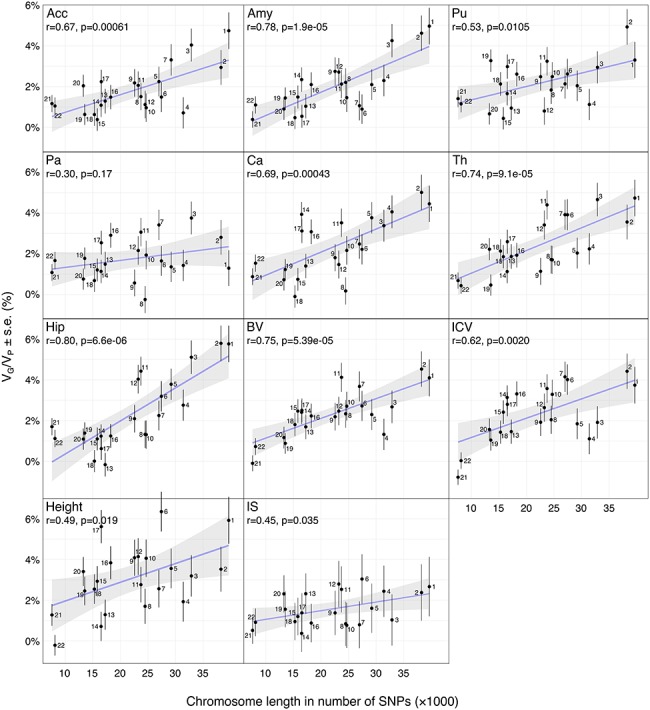
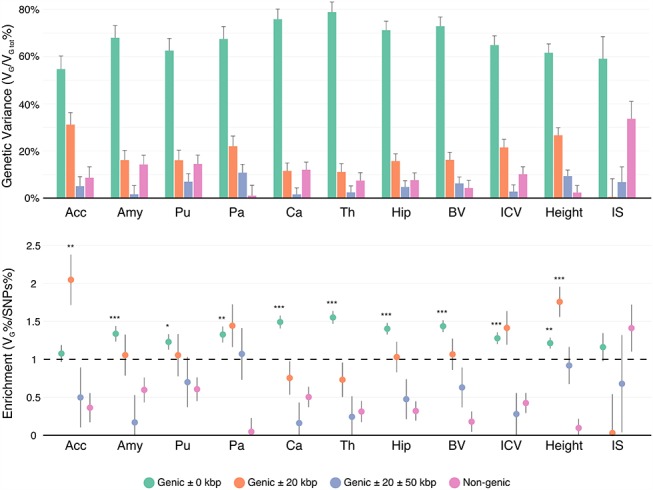
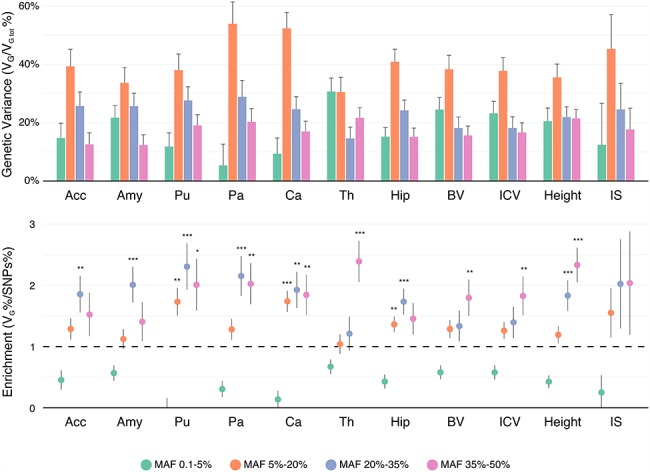
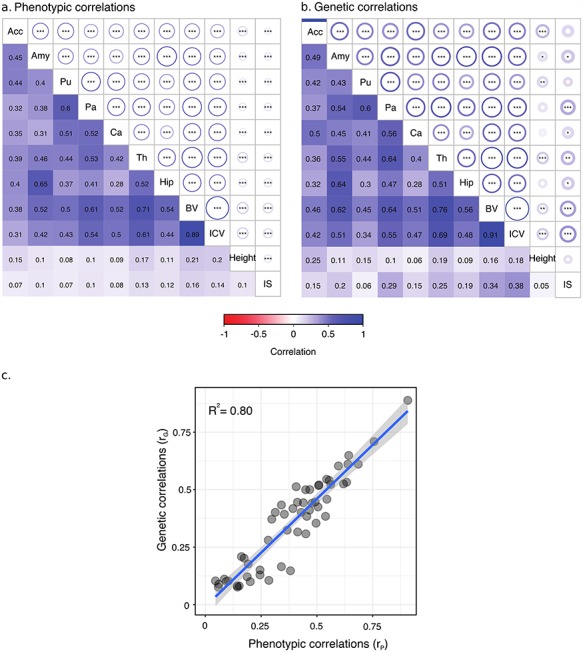
We analyzed the genomic architecture of neuroanatomical diversity using magnetic resonance imaging and single nucleotide polymorphism (SNP) data from >26 000 individuals from the UK Biobank project and 5 other projects that had previously participated in the ENIGMA (Enhancing NeuroImaging Genetics through Meta-Analysis) consortium. Our results confirm the polygenic architecture of neuroanatomical diversity, with SNPs capturing from 40% to 54% of regional brain volume variance. Chromosomal length correlated with the amount of phenotypic variance captured, r ~ 0.64 on average, suggesting that at a global scale causal variants are homogeneously distributed across the genome. At a local scale, SNPs within genes (~51%) captured ~1.5 times more genetic variance than the rest, and SNPs with low minor allele frequency (MAF) captured less variance than the rest: the 40% of SNPs with MAF <5% captured <one fourth of the genetic variance. We also observed extensive pleiotropy across regions, with an average genetic correlation of rG ~ 0.45. Genetic correlations were similar to phenotypic and environmental correlations; however, genetic correlations were often larger than phenotypic correlations for the left/right volumes of the same region. The heritability of differences in left/right volumes was generally not statistically significant, suggesting an important influence of environmental causes in the variability of brain asymmetry. Our code is available athttps://github.com/neuroanatomy/genomic-architecture.

Keywords: genetics; heritability; neuroimaging; polygenic architecture; subcortical structures.


Figures

Figure 1
Figure 1
(a) Proportion of variance captured by common genotyped variants (VG/VP) for brain regions, height and IS. Meta-analytic estimates were obtained using inverse variance weighting of the estimates of the different projects studied. (b) VG/VP estimates for each project. The estimates were obtained using GCTA, without constraining the results to lie in the 0–100% range. The diamond shows the meta-analytic estimation. Age, sex, center, and the first 10 principal components were included as covariates. The error bars show the SEs of the VG/VP estimates.
Figure 2
Figure 2
Scatter plots of the number of SNPs per chromosome versus VG/VP estimates computed for each chromosome. VG/VP estimates were obtained by partitioning SNPs across chromosomes and computed using the GCTA REML unconstrained method for total subcortical volumes. Age, sex, center, and the top 10 principal components were included as covariates. The error bars show the SEs of the VG/VP estimates.
Figure 3
Figure 3
Variance enrichment for partitions based on closeness to genic regions. Meta-analytic estimates were obtained using inverse variance weighting of the estimates of the different projects studied. Top: VG/formula image estimates computed for 4 sets of SNPs based on their distance to gene boundaries: all SNPs within the boundaries of the 66 632 gene boundaries from the UCSC Genome Browser hg19 assembly, 2 further sets that included also SNPs 0–20 and 20–50 kbp upstream and downstream of each gene, and a remaining set containing SNPs located farther than 50 kb from one of the gene boundaries. VG/formula image estimates were computed using the GCTA REML unconstrained method for height, intelligence, and brain, intracranial and total subcortical volumes. The error bars represent the SEs. Bottom: enrichment of variance captured by each partition. The y-axis shows the ratio of the fraction of genetic variance explained by each partition divided by the fraction of SNPs contained in each partition. If all SNPs explained a similar amount of variance, this ratio should be close to 1 (dashed line). A Z-test was used to compare the ratios to 1 and P-values were FDR adjusted (*P < 0.05, **P < 0.01, ***P < 0.001).
Figure 4
Figure 4
Variance enrichment for partitions based on MAF. Meta-analytic estimates were obtained using inverse variance weighting of the estimates of the different projects studied. Top: VG/formula image estimates computed for 4 sets of SNPs based on their MAF: from 0.1% to 5%, from 5% to 20%, from 20% to 35% and from 35% to 50%. VG/formula image estimates were computed using the GCTA REML unconstrained method for height, intelligence, and brain, intracranial and total subcortical volumes. The error bars represent the SEs. Bottom: enrichment of variance captured by each partition. The y-axis shows the ratio of the fraction of genetic variance explained by each partition divided by the fraction of SNPs contained in each partition. If all SNPs explained a similar amount of variance, this ratio should be close to 1 (dashed line). A Z-test was used to compare the ratios to 1 and P-values were FDR adjusted (*P < 0.05, **P < 0.01, ***P < 0.001).
Figure 5
Figure 5
Phenotypic and genetic correlations. Significant phenotypic (a) and genetic (b) correlations were observed for most phenotypes. Correlation estimates are shown in the lower triangular part of the matrices, statistical significance in the upper triangular part. Circle radius represents correlation strength, stars indicate statistical significance of the correlation being non null (*P < 0.05, **P < 0.01, ***P < 0.001). The scatter plot (c) of phenotypic versus genetic correlations.

References

    1. Alfaro-Almagro F, Jenkinson M, Bangerter NK, Andersson JLR, Griffanti L, Douaud G, Sotiropoulos SN, Jbabdi S, Hernandez-Fernandez M, Vallee E et al. . 2018. Image processing and quality control for the first 10,000 brain imaging datasets from UK biobank. Neuroimage. 166(Feb):400–424. doi: 10.1016/j.neuroimage.2017.10.034. - DOI - PMC - PubMed
    1. Blokland GAM, de ZGI, McMahon KL, Wright MJ. 2012. Genetic and environmental influences on neuroimaging phenotypes: a meta-analytical perspective on twin imaging studies. Twin Research and Human Genetics. 15:351–371. - PMC - PubMed
    1. Browning SR, Browning BL. 2011. Population structure can inflate SNP-based heritability estimates. Am J Human Genet. 89(1):191–193. doi: 10.1016/j.ajhg.2011.05.025. - DOI - PMC - PubMed
    1. Daetwyler HD, Villanueva B, Woolliams JA. 2008. Accuracy of predicting the genetic risk of disease using a genome-wide approach. PLOS One. 3(10):e3395. doi: 10.1371/journal.pone.0003395. - DOI - PMC - PubMed
    1. Davies G, Tenesa A, Payton A, Yang J, Harris SE, Liewald D, Ke X, Le Hellard S, Christoforou A, Luciano M et al. . 2011. Genome-wide association studies establish that human intelligence is highly heritable and polygenic. Molecular psychiatry. 16:996–1005. - PMC - PubMed

Publication types

MeSH terms

LinkOut - more resources