. 2020 Mar 5;26(3):359-376.e7.
doi: 10.1016/j.stem.2020.01.013. Epub 2020 Feb 27.

Restraining Lysosomal Activity Preserves Hematopoietic Stem Cell Quiescence and Potency

Affiliations

Restraining Lysosomal Activity Preserves Hematopoietic Stem Cell Quiescence and Potency

Raymond Liang et al. Cell Stem Cell. .

Abstract

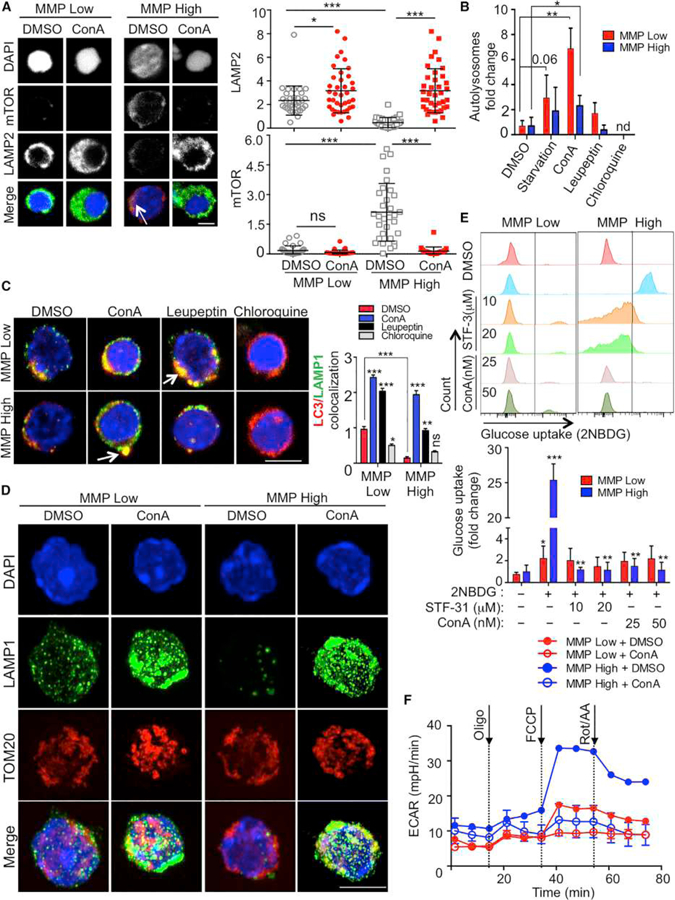
Quiescence is a fundamental property that maintains hematopoietic stem cell (HSC) potency throughout life. Quiescent HSCs are thought to rely on glycolysis for their energy, but the overall metabolic properties of HSCs remain elusive. Using combined approaches, including single-cell RNA sequencing (RNA-seq), we show that mitochondrial membrane potential (MMP) distinguishes quiescent from cycling-primed HSCs. We found that primed, but not quiescent, HSCs relied readily on glycolysis. Notably, in vivo inhibition of glycolysis enhanced the competitive repopulation ability of primed HSCs. We further show that HSC quiescence is maintained by an abundance of large lysosomes. Repression of lysosomal activation in HSCs led to further enlargement of lysosomes while suppressing glucose uptake. This also induced increased lysosomal sequestration of mitochondria and enhanced the competitive repopulation ability of primed HSCs by over 90-fold in vivo. These findings show that restraining lysosomal activity preserves HSC quiescence and potency and may be therapeutically relevant.

Keywords: HSC; dormancy; fission; hematopoietic stem cell; label retention; lysosomes; mTOR; mitochondria; mitophagy; quiescence.


Conflict of interest statement

Declaration of Interests Some elements of this work have been filed in a patent application to the United States Patent and Trademark Office. R.L. is currently employed by HemoGenix.

Figures

Figure 1.
Figure 1.. MMP-Low HSCs Are Enriched in Label-Retaining HSCs
(A) Cell-cycle analysis (left) and quantification (right) of MMP-low and MMP-high HSCs (n = 3). (B) Single-cell division assays showing the fraction of MMP-low and MMP-high GFP+ HSCs undergoing the indicated number of divisions at 60 h (n = 4). (C) Schematic of H2B-GFP label-retaining dilution with cell division. (D) Representative plot of H2B-GFP (green) levels in HSCs from 14-week doxycycline (DOX)-chased mouse against background (black) HSCs with no tetracycline-inducible construct (n = 4). (E) Histogram of H2B-GFP label retention (left) and quantification (right) in MMP-low and MMP-high HSCs (n = 4). (F) MMP levels in H2B-GFP+/GFP HSCs (left) and geometric mean quantification (right). (G) Quantification of MMP fractions within label-retaining and non-label-retaining HSCs. Data are presented as mean ± SEM (*p < 0.05, **p < 0.01, and ***p < 0.001).
Figure 2.
Figure 2.. scRNA-Seq of MMP-Low and MMP-High HSCs Depicts the HSC Trajectory from a Quiescent to Primed State
(A) Schematic of captured single HSCs and subsequent sequencing steps. (B) Number of genes expressed in each MMP-low versus MMP-high HSCs (mean ± SEM; ***p < 0.001). (C) In silico cell-cycle gene expression analysis. (D and E) GO term enrichment of ‘‘biological process’’ terms (D) or ChEA analysis (E) using significantly upregulated in MMP-low (top) and MMP-high (bottom) HSCs as determined by MAST. (F) t-SNE dimensional reduction displaying relative position of MMP-low (red) MMP-high (blue) HSCs. (G) t-SNE plots with clusters labeled. (H) Hierarchical clustering. (I) Pathway analysis of catabolic and biosynthetic processes (p values, 2-sample 2-tailed Z-test).
Figure 3.
Figure 3.. Glycolysis Is More Readily Used in Primed MMP-High HSCs than Quiescent MMP-Low HSCs
(A) Glucose analog (2NBDG) uptake in freshly isolated MMP-low and MMP-high HSCs incubated with 2NBDG for 2 h in (glucose, pyruvate, glutamine)-free medium. Histograms (left) show quantification of 2NBDG uptake (mean fluorescence intensity [MFI] ±SEM) (middle) and percentage of 2NBDG+ cells (right) (n = 6). (B) Glucose uptake (as in A) in HSCs treated or not with Glut1 inhibitor (STF-31, 10 µM) for 6 h (n = 3). (C) Oxygen consumption rates (OCR) and extracellular acidification rates (ECARs) in freshly isolated LSK MMP-low and MMP-high HSCs (n = 3). (D) Cell viability of MMP-low and MMP-high HSCs cultured with 10 µM CHC or DMSO control for 6 h (n = 3). (E) Glucose uptake in freshly isolated MMP-low and MMP-high HSCs treated for 18 h with dimethyl alpha ketoglutarate (MOG; 1 mM) and methyl pyruvate (M; 1 mM) or 2-DG (30 mM) or DMSO. Histograms (left) show quantification (MFI ±SEM) (middle) and percentage of 2NBDG+ cells (right). Data are presented as mean ± SEM (*p < 0.05, **p < 0.01, and ***p < 0.001).
Figure 4.
Figure 4.. Glycolytic Inhibition Enhances HSC Long-Term Competitive Repopulation Activity In Vivo
(A) Viability FACS Profiles (Left) of MMP-low and MMP-high HSCs cultured with or without 2-DG (50 mM) for the indicated time (middle); percentage of live cells (right, n = 3). (B) Schematic of mice (top) treated with 2-DG (750 mg/kg) every other day for 6 days; histogram -of MMP (TMRE) levels (bottom left) and quantification (bottom right) (n = 3). (C) Glucose uptake in MMP-low and MMP-high HSCs from (B); histograms (top) and quantification (bottom). (D) Schematic of long-term in vivo competitive repopulation assay (top) and analysis (bottom); 2 days after transplantation, mice were treated with 2-DG (1,000 mg/kg) or PBS every other day for 30 days (n = 7 mice in each group). (E) Lineage output as a percentage of total CD45.1 donor-derived cells in primary recipients from (D). Data are presented as mean ± SEM (*p < 0.05, **p < 0.01, and ***p < 0.001).
Figure 5.
Figure 5.. MMP-Low HSCs Exhibit Punctate Mitochondrial Networks Associated with Large Lysosomes
(A–E) Representative immunofluorescent confocal images of TOM20 (A, B, and D), DRP1 (B), pDRP1 (C), LAMP1 (D and E), and DAPI (A–E) from freshly isolated MMP-low and MMP-high HSCs. (A, B, and D), DRP1 (B), pDRP1 (C), LAMP1 (D and E), LC3 (E), and DAPI (A–E). (A) TOM20 (top; bar, 2 µm) and quantification (bottom). (B) Colocalization of TOM20 with DRP1 (top; bar, 5µm) and quantification (bottom). (C) Confocal images (left) and quantification of phospo-Drp1 (S616) total fluorescence (right; n = 3, bar, 5 µm). (D) Colocalization of TOM20 with LAMP1 (top; bar, 5µm) in HSCs treated with leupeptin (100 µM) or DMSO control for 4 h; quantification (bottom). (E) Colocalization of LC3 with LAMP1 (left; bar, 5µm) in HSCs after 4-h treatment with leupeptin (100 µM) or DMSO control; quantification and LC3 flux (right). (F) qRT-PCR analysis of lysosomal enzymes in freshly isolated MMP-low and MMP-high HSCs (normalized to β-actin) (n = 3). Data are presented as mean ± SEM (*p < 0.05, **p < 0.01, and ***p < 0.001).
Figure 6.
Figure 6.. Inhibition of Lysosomal Activity Enhances HSC Competitive Repopulation Function In Vivo
(A) Schematic of lysosomal inhibition by concanamycin A (ConA) or DMSO control on lineage– cells (top). FACS profiles of HSCs treated with ConA (100 nM) or DMSO for the indicated time (bottom left) and quantification of HSC frequency (bottom right) (n = 5). (B) Frequency of MMP-low HSCs generated from (A). (C) Single-cell division assay of MMP-low and MMP-high HSCs cultured with DMSO or ConA (40 nM) for 60 h (n = 3). (D) Limiting dilution analysis of LTC-IC in MMP-low and MMP-high HSCs treated for 2 days in culture with ConA (40 nM) or DMSO. (E) Schematic of in vivo competitive repopulation assay (top). 3,000 FACS-sorted MMP-low and MMP-high (CD45.1 donor) HSCs were cultured in vitro in ConA (40 nM) or DMSO for 4 days, after which 50 cells from each group were injected into lethally irradiated recipient (CD45.2) mice along with 2 × 10⁵ CD45.2 total bone marrow cells (n = 7 in each group). Shown is the contribution of donor-derived (CD45.1) cells to the peripheral blood (PB) of primary recipient mice (CD45.2) over 16 weeks in an in vivo competitive repopulation assay (bottom). (F) Lineage output as a percentage of distribution of total CD45.1 donor-derived cells in primary recipients from (E). Data are presented as mean ± SEM (*p < 0.05, **p < 0.01, and ***p < 0.001).
Figure 7.
Figure 7.. Inhibition of Lysosomal Activity Enlarges Lysosomal Networks, Retains Autolysosomes and the Engulfed Mitochondria, and Inhibits Glycolysis in HSCs
(A) Representative confocal images of mTOR and LAMP2 (left; bar, 5µm; arrow shows co-localization) and quantification (right; n = 3) in freshly isolated MMP-low and MMP-high HSCs treated with DMSO or ConA (40 nM) for 18 h. (B) Fold change in MMP-low versus MMP-high HSCs fractions with autolysosomes (RFP+GFP) (n = 3; normalized to control; nd, not detected); analysis of mRFP-EGFP-LC3B BM cells cultured in DMSO or ConA, (40 nM), leupeptin (100 µM), or chloroquine (40 µM) or amino acid-depleted media (starvation) for 3 h. (C) Representative confocal images of LC3 and LAMP1 in MMP-low and MMP-high HSCs cultured in DMSO, ConA (40 nM), leupeptin (100 µM), or chloroquine (40 µM) for 18 h (left); quantification (right; bar, 5 µm; n = 3). (D) Representative super-resolution confocal images of TOM20, LAMP1 and their co-localization in freshly isolated MMP-low and MMP-high HSCs treated with DMSO or ConA (40 nM) (bar, 5µm). (E) Representative histograms (top) and quantification (bottom) of glucose uptake in MMP-low and MMP-high HSCs treated with STF-31 (10 and 20 µM), ConA (25 and 50 nM), or DMSO for 18 h (n = 2). (F) Glycolysis (ECAR) in MMP-low and –MMP-high HSCs cultured in DMSO or ConA (40 nM) for 18 h. Data are presented as mean ± SEM (n = 2; *p < 0.05, **p < 0.01, and ***p < 0.001).

Comment in

References

    1. Abu-Remaileh M, Wyant GA, Kim C, Laqtom NN, Abbasi M, Chan SH, Freinkman E, and Sabatini DM (2017). Lysosomal metabolomics reveals V-ATPase- and mTOR-dependent regulation of amino acid efflux from lysosomes. Science 358, 807–813. - PMC - PubMed
    1. Ansó E, Weinberg SE, Diebold LP, Thompson BJ, Malinge S, Schumacker PT, Liu X, Zhang Y, Shao Z, Steadman M, et al. (2017). The mitochondrial respiratory chain is essential for haematopoietic stem cell function. Nat. Cell Biol 19, 614–625. - PMC - PubMed
    1. Balazs AB, Fabian AJ, Esmon CT, and Mulligan RC (2006). Endothelial protein C receptor (CD201) explicitly identifies hematopoietic stem cells in murine bone marrow. Blood 107, 2317–2321. - PMC - PubMed
    1. Barrett T, Wilhite SE, Ledoux P, Evangelista C, Kim IF, Tomashevsky M, Marshall KA, Phillippy KH, Sherman PM, Holko M, et al. (2013). NCBI GEO: archive for functional genomics data sets–update. Nucleic Acids Res 41, D991–D995. - PMC - PubMed
    1. Bejarano-García JA, Millán-Uclés Á, Rosado IV, Sánchez-Abarca LI, Caballero-Velázquez T, Durán-Galvan MJ, Pérez-Simón JA, and Piruat JI (2016). Sensitivity of hematopoietic stem cells to mitochondrial dysfunction by SdhD gene deletion. Cell Death Dis 7, e2516. - PMC - PubMed

Publication types