. 2020 Jan 26;12(1):35-54.
doi: 10.4252/wjsc.v12.i1.35.

Sphere-forming corneal cells repopulate dystrophic keratoconic stroma: Implications for potential therapy

Affiliations

Sphere-forming corneal cells repopulate dystrophic keratoconic stroma: Implications for potential therapy

Himanshu Wadhwa et al. World J Stem Cells. .

Abstract

Background: Keratoconus is a degenerative corneal disease characterised by aberrant cell behaviour and loss of matrix that can result in vision loss. Cells extracted from peripheral corneas can form stem cell-enriched spheres, which have shown the potential to repopulate the normal peripheral corneal stroma in vitro upon sphere implantation but have not been previously studied in keratoconic tissue.

Aim: To investigate the therapeutic potential of stem cell-enriched spheres formed from extracted peripheral human corneal cells when introduced to keratoconic tissue.

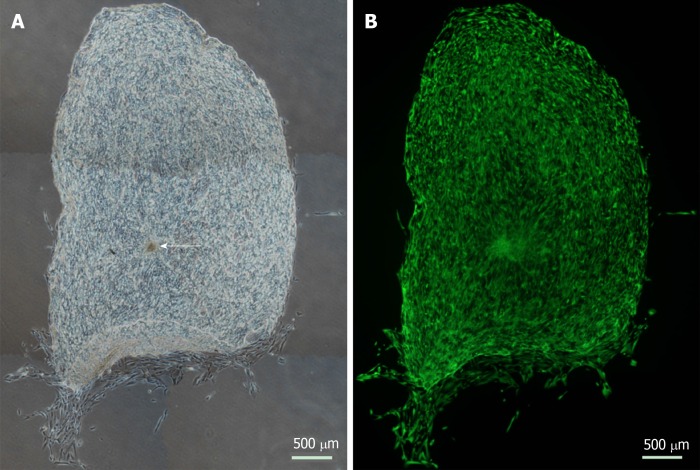
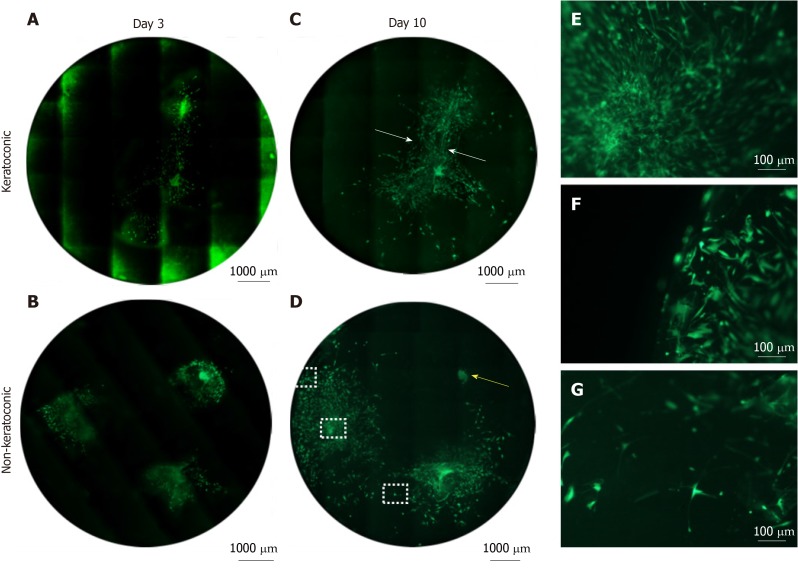
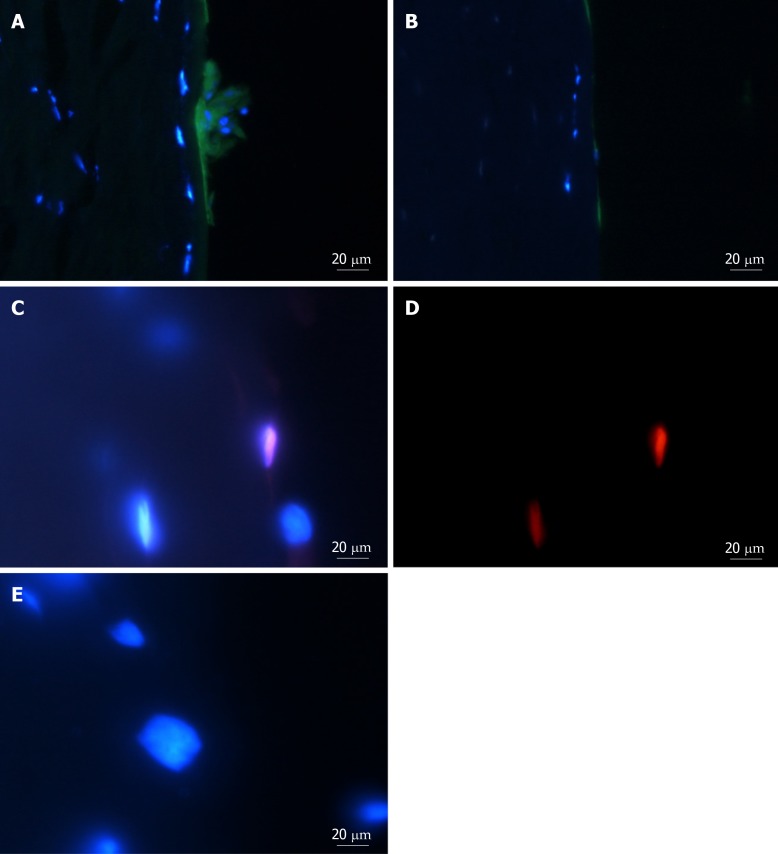
Methods: Stem cell-enriched spheres were formed from extracts of normal cadaveric human peripheral corneal cells. These spheres were implanted into incisions created in full thickness and onto the surface of 10 µm thin sections of keratoconic and normal stromal tissues in vitro. Tissue sections were used to maximise use of limited keratoconic tissue available for research. Living cells were stained with Calcein-AM and visualised with stereo and fluorescence microscopy to assess survival and behaviours between the time of implantation day 0 and 14 d (D14) from implantation. Sphere cells in implanted tissues were characterised for stem cell and differentiation markers using immunohistochemistry and droplet digital PCR to assess the potential implications of these characteristics in the use of spheres in keratoconus treatment.

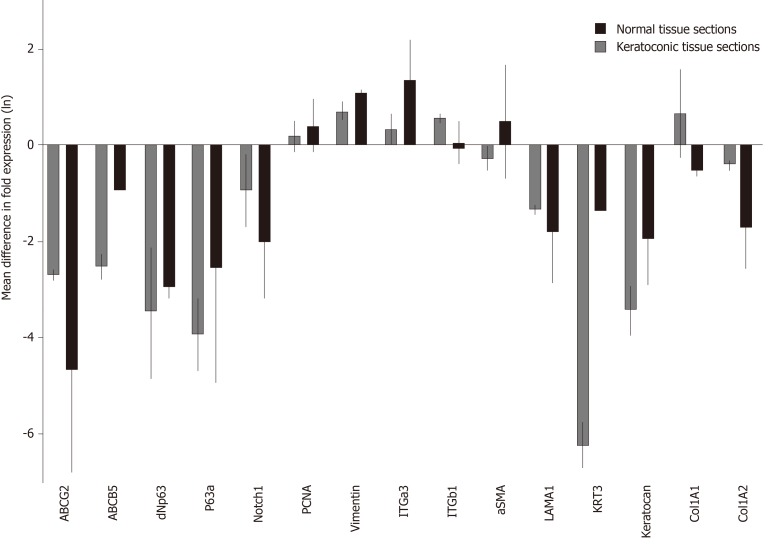
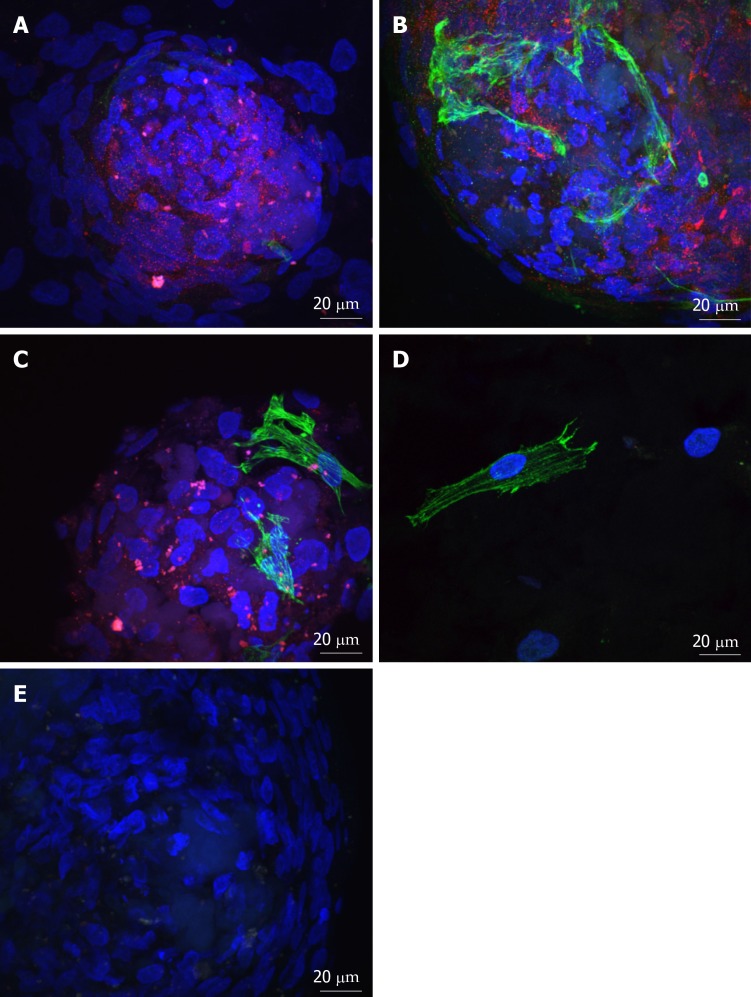
Results: Spheres were successfully implanted into full-thickness central corneal tissue and onto the surface of 10 µm thin en face tissue sections. No observable differences were seen in sphere migration, proliferation or differentiation in keratoconic tissue compared to normal between day 0 and D14. Spheres stained positively with Calcein-AM up to D14. Cell migration increased from day 0 to D14, occurring radially in three dimensions from the sphere and in alignment with tissue edges. Cell proliferation marker, EdU, was detected at day 10. Implanted spheres stained positively for putative stem cell markers ∆Np63α and ABCB5, while ABCG2, ABCB5, ∆Np63 and p63α were detectable by droplet digital PCR up to D14. Double immunolabelling revealed absence of ABCB5 staining in migrated cells but positive staining of alpha smooth muscle actin (myofibroblast marker) in some migrated cells. Droplet digital PCR showed similar expression patterns of differentiation markers but a reduction in stem cell markers between normal and keratoconic tissue with an increase in stromal cell markers and a reduction in epithelial cell markers, indicating an appropriate response to repopulating diseased tissue.

Conclusion: Cells from implanted stem cell-enriched spheres can repopulate a keratoconic corneal stromal surface in a directed manner and exhibit migratory stromal cell phenotypes.

Keywords: Cell culture; Digital PCR; Holoclone; Immunohistochemistry; Keratoconus; Neurosphere; Quantitative PCR; Regeneration; Spheroid.


Conflict of interest statement

Conflict-of-interest statement: Prof. Sherwin reports grants from Save Sight Society of New Zealand, grants from Auckland Medical Research Foundation, grants from New Zealand Wound Care Society, and grants from John Hamel MacGregor Trust during the conduct of the study.

Figures

Figure 1
Figure 1
Estimated fold differences in expression of proliferation, stem cell and epithelial and stromal cell markers in sphere-seeded tissue sections at day 14. Expression of stem cell markers: ATP-binding cassette, sub-family G member 2, ATP binding cassette subfamily B member 5, tumour protein p63, transcript variant 1, N-terminal isoform, tumour protein p63, transcript variant 1, C-terminal isoform α, limbal niche marker Notch1, proliferation marker proliferating cell nuclear antigen, mesenchymal cell marker vimentin, adhesion molecules integrin subunit α3 and β1, myofibroblast marker alpha smooth muscle actin, epithelial markers laminin α1 and keratin 3, keratocyte marker keratocan, collagen type I, alpha 1 chain and collagen type I, alpha 2 chain genes in sphere-seeded normal and keratoconic 10 μm en face decellularised central corneal stromal tissue sections. Spheres were derived from two human donors and expression data at days 0 and 14, normalised to reference genes β-actin, glycreraldehyde-3-phosphate dehydrogenase, glucuronidase beta, hypoxanthine phosphoribosyltransferase 1, peptidylprolyl isomerase A and β2-microglobulin. Data is expressed as estimated fold difference between day 14 and day 0 based on raw data and plotted as the natural logarithm mean differences in fold expression ± standard deviation.
Figure 2
Figure 2
Cellular repopulation of the surface of en face keratoconic tissue sections. A: A stem cell-enriched sphere (arrow) was seeded onto a keratoconic decellularised central corneal stromal section (phase contrast image); B: Assessed for viability with Calcein-AM (green) at day 14 (fluorescence image). Montage imaging of the entire tissue section shows cells have repopulated the tissue section to complete confluence by day 14. Scale bar = 500 µm.
Figure 3
Figure 3
Cell morphology and migration patterns on the surface of sphere-seeded en face keratoconic tissue sections. A: Representative images of migrated cells over the surface of keratoconic tissue sections show cells from the centre of the sphere aligned radially while cells close to the tissue edge align parallel with the tissue edge (white arrows show cell orientations); B: When cells at one of the migrating edges are magnified and overexposed, fine cell projections can be seen connecting cells to neighbouring ones (orange arrows). Scale bar = 100 µm.
Figure 4
Figure 4
Adenosine triphosphate binding cassette subfamily B member 5 and α-smooth muscle actin expression in spheres and migrated cells seeded onto keratoconic tissue sections. A, B, C: Spheres seeded onto keratoconic tissue sections were fixed at day 0, 1 and 4 post-implantation and double primary antibody immunolabelled with putative stem cell marker ATP binding cassette subfamily B member 5 (ABCB5) (red) and myofibroblast marker alpha smooth muscle actin (αSMA) (green). Cell nuclei were counterstained with DAPI (blue). Confocal projection images of z stacks were taken. Spheres labelled positively with ABCB5 and αSMA at days 0 (A), 1 (B) and 4 (C); D: Migrated cells at days 1 and 4 appeared similar, a representative image at day 1 is shown; E: Spheres labelled with secondary antibody had no detectable red and green fluorescence when imaged at the same levels as A-C. Scale bar = 20 µm.
Figure 5
Figure 5
Cell viability of spheres and sphere-derived cells within implanted full-thickness corneal tissue. A-D: Decellularised full-thickness central corneal stromal tissues (corneal buttons) implanted with three spheres each and assessed for cell viability with Calcein-AM (green) were imaged at 50 × magnification with a fluorescence microscope and montaged to maintain detail of individual cells throughout the entire corneal button. Each circle represents the corneal button edge. Three days after implantation (day 3), spheres in keratoconic (A) and non-keratoconic (decompensated: normal anterior cornea with failed endothelium) (B) matrices are viable and have viable cells radiating from the sphere. At day 10, spheres in keratoconic (C) and non-keratoconic (D) matrices remain viable, and the viable cells have migrated further outward from the centre of the sphere. An exception to this was one sphere within non-keratoconic tissue, which showed reduced cell migration at day 10 compared with day 3 (yellow arrow, D); E-G: Panels E-G are magnified areas from D indicated by dotted squares (E = central square, F = top square, G = lower square). When spheres are implanted close to each other, cells align between them as if forming “cellular bridges” (white arrows, C). Cells near the centre of the sphere orientate radially from the centre of the sphere (E) while cells near the tissue edge are aligned parallel with the edge (F). Cells distant from both the nearest sphere and the tissue edge appear to lose their alignment (G). Scale bar = 1000 µm for A-D and 100 µm for E-G. Bright green fluorescence at left edge of tiles in montage (A) is artefactual.
Figure 6
Figure 6
Putative stem-cell marker tumour protein p63, transcript variant 1, N-terminal isoform and cell-proliferation marker 5-ethynyl-2'-deoxyuridine in cells within sphere-implanted-full-thickness tissue at day 10. A: Representative images of cross sections with spheres and cells derived from spheres implanted into full-thickness keratoconic and non-keratoconic central corneal buttons at day 10 show positive staining within the sphere for the putative stem cell marker tumour protein p63, transcript variant 1, N-terminal isoform (∆Np63α) (green); B: Cells stained without primary antibody (secondary antibody only control) show low green fluorescence. Cell nuclei are stained with DAPI (blue); C, D: Some, but not all cells show evidence of cell division (detected with ClickiT 5-ethynyl-2'-deoxyuridine (EdU) (red), a cell proliferation marker), as shown by pink cell nuclei in superimposed images of DAPI and EdU staining (C) and its equivalent image with red signal only (D); E: A negative control (EdU incubation without processing with its reaction solution) imaged at the same signal intensity as D is shown superimposed on DAPI for comparison. Scale bar = 20 µm.

Similar articles

Cited by

References

    1. Romero-Jiménez M, Santodomingo-Rubido J, Wolffsohn JS. Keratoconus: a review. Cont Lens Anterior Eye. 2010;33:157–66; quiz 205. - PubMed
    1. Sherwin T, Brookes NH. Morphological changes in keratoconus: pathology or pathogenesis. Clin Exp Ophthalmol. 2004;32:211–217. - PubMed
    1. Somodi S, Hahnel C, Slowik C, Richter A, Weiss DG, Guthoff R. Confocal in vivo microscopy and confocal laser-scanning fluorescence microscopy in keratoconus. Ger J Ophthalmol. 1996;5:518–525. - PubMed
    1. Sherwin T, Brookes NH, Loh IP, Poole CA, Clover GM. Cellular incursion into Bowman's membrane in the peripheral cone of the keratoconic cornea. Exp Eye Res. 2002;74:473–482. - PubMed
    1. Kenney MC, Nesburn AB, Burgeson RE, Butkowski RJ, Ljubimov AV. Abnormalities of the extracellular matrix in keratoconus corneas. Cornea. 1997;16:345–351. - PubMed