A sensor array for the discrimination of polycyclic aromatic hydrocarbons using conjugated polymers and the inner filter effect
- PMID: 32110311
- PMCID: PMC7020785
- DOI: 10.1039/c9sc03405f
A sensor array for the discrimination of polycyclic aromatic hydrocarbons using conjugated polymers and the inner filter effect
Abstract
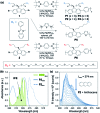
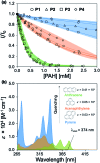
Natural and anthropogenic activities result in the production of polycyclic aromatic hydrocarbons (PAHs), persistent pollutants that negatively impact the environment and human health. Rapid and reliable methods for the detection and discrimination of these compounds remains a technological challenge owing to their relatively featureless properties, structural similarities, and existence as complex mixtures. Here, we demonstrate that the inner filter effect (IFE), in combination with conjugated polymer (CP) array-based sensing, offers a straightforward approach for the quantitative and qualitative profiling of PAHs. The sensor array was constructed from six fluorescent fluorene-based copolymers, which incorporate side chains with peripheral 2-phenylbenzimidazole substituents that provide spectral overlap with PAHs and give rise to a pronounced IFE. Subtle structural differences in copolymer structure result in distinct spectral signatures, which provide a unique "chemical fingerprint" for each PAH. The discriminatory power of the array was evaluated using linear discriminant analysis (LDA) and principal component analysis (PCA) in order to discriminate between 16 PAH compounds identified as priority pollutants by the US Environmental Protection Agency (EPA). This array is the first multivariate system reliant on the modulation of the spectral signatures of CPs through the IFE for the detection and discrimination of closely related polynuclear aromatic species.
This journal is © The Royal Society of Chemistry 2019.
Figures


Similar articles
-
Rapid and sensitive screening of multiple polycyclic aromatic hydrocarbons by a reusable fluorescent sensor array.J Hazard Mater. 2022 Feb 15;424(Pt C):127694. doi: 10.1016/j.jhazmat.2021.127694. Epub 2021 Nov 6. J Hazard Mater. 2022. PMID: 34785436
-
A Sensor Array for the Nanomolar Detection of Azo Dyes in Water.ACS Sens. 2020 Jun 26;5(6):1541-1547. doi: 10.1021/acssensors.0c00342. Epub 2020 Jun 9. ACS Sens. 2020. PMID: 32475110
-
A single recognition unit-based virtual sensor Array: Applying 3D fluorescence spectroscopy to inner filter effect-based sensing.Spectrochim Acta A Mol Biomol Spectrosc. 2024 Jan 15;305:123470. doi: 10.1016/j.saa.2023.123470. Epub 2023 Sep 27. Spectrochim Acta A Mol Biomol Spectrosc. 2024. PMID: 37776834
-
ATSDR evaluation of health effects of chemicals. IV. Polycyclic aromatic hydrocarbons (PAHs): understanding a complex problem.Toxicol Ind Health. 1996 Nov-Dec;12(6):742-971. doi: 10.1177/074823379601200601. Toxicol Ind Health. 1996. PMID: 9050165 Review.
-
Polycyclic aromatic hydrocarbons in fruits and vegetables: Origin, analysis, and occurrence.Environ Pollut. 2018 Mar;234:96-106. doi: 10.1016/j.envpol.2017.11.028. Epub 2017 Nov 21. Environ Pollut. 2018. PMID: 29172043 Review.
Cited by
-
Surface Thermal Behavior and RT CO Gas Sensing Application of an Oligoacenaphthylene with p-Hydroxyphenylacetic Acid Composite.ACS Omega. 2022 Oct 7;7(41):36307-36317. doi: 10.1021/acsomega.2c03897. eCollection 2022 Oct 18. ACS Omega. 2022. PMID: 36278056 Free PMC article.
-
Using Room Temperature Phosphorescence of Gold(I) Complexes for PAHs Sensing.Molecules. 2021 Apr 22;26(9):2444. doi: 10.3390/molecules26092444. Molecules. 2021. PMID: 33922155 Free PMC article.
-
A Diboronic Acid-Based Fluorescent Sensor Array for Rapid Identification of Lonicerae Japonicae Flos and Lonicerae Flos.Molecules. 2024 Sep 14;29(18):4374. doi: 10.3390/molecules29184374. Molecules. 2024. PMID: 39339369 Free PMC article.
-
A Collagen-Conducting Polymer Composite with Enhanced Chondrogenic Potential.Cell Mol Bioeng. 2021 Sep 28;14(5):501-512. doi: 10.1007/s12195-021-00702-y. eCollection 2021 Oct. Cell Mol Bioeng. 2021. PMID: 34777607 Free PMC article.
-
Multi-analyte sensing strategies towards wearable and intelligent devices.Chem Sci. 2022 Sep 24;13(42):12309-12325. doi: 10.1039/d2sc03750e. eCollection 2022 Nov 2. Chem Sci. 2022. PMID: 36382296 Free PMC article. Review.
References
-
- Harvey R. G., Polycyclic Aromatic Hydrocarbons, Wiley-VCH, New York, 1997.
- Abdel-Shafy H. I., Mansour M. S. M. Egypt. J. Pet. 2016;25:107.
-
- Kim K. H., Jahan S. A., Kabir E., Brown R. J. C. Environ. Int. 2013;60:71. - PubMed
- Mastral A. M., Callén M. S. Environ. Sci. Technol. 2000;34:3051.
-
- World Health Organization, WHO guidelines for indoor air quality: selected pollutants, WHO Regional Office for Europe, Copenhagen, 2010. - PubMed
- Menzie C. A., Potocki B. B., Santodonato J. Environ. Sci. Technol. 1992;26:1278.
-
- Dixon H. M., Scott R. P., Holmes D., Calero L., Kincl L. D., Waters K. M., Camann D. E., Calafat A. M., Herbstman J. B., Anderson K. A. Anal. Bioanal. Chem. 2018;410:3059. - PMC - PubMed
- Paulik L. B., Donald C. E., Smith B. W., Tidwell L. G., Hobbie K. A., Kincl L., Haynes E. N., Anderson K. A. Environ. Sci. Technol. 2016;50:7921. - PMC - PubMed
- Kumar S., Negi S., Maiti P. Environ. Sci. Pollut. Res. 2017;24:25810. - PubMed
-
- Wise S. A., Sander L. C., May W. E. J. Chromatogr. 1993;642:329.
- Lung S. C. C., Liu C. H. Sci. Rep. 2015;5:12992. - PMC - PubMed
- Purcaro G., Moret S., Miklavcic M. B., Conte L. S. J. Sep. Sci. 2012;35:922. - PubMed
- Dost K., Ideli C. Food Chem. 2012;133:193.
- Toriba A., Kuramae Y., Chetiyanukornkul T., Kizu R., Makino T., Nakazawa H., Hayakawa K. Biomed. Chromatogr. 2003;17:126. - PubMed
LinkOut - more resources
Full Text Sources
Other Literature Sources
Research Materials
Miscellaneous

