. 2020 Feb 14;6(7):eaax9935.
doi: 10.1126/sciadv.aax9935. eCollection 2020 Feb.

Evolution of brain lateralization: A shared hominid pattern of endocranial asymmetry is much more variable in humans than in great apes

Affiliations

Evolution of brain lateralization: A shared hominid pattern of endocranial asymmetry is much more variable in humans than in great apes

Simon Neubauer et al. Sci Adv. .

Abstract

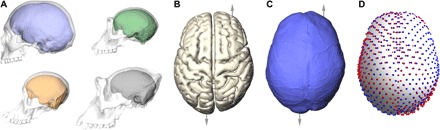
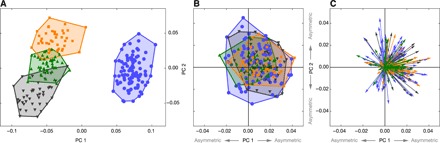
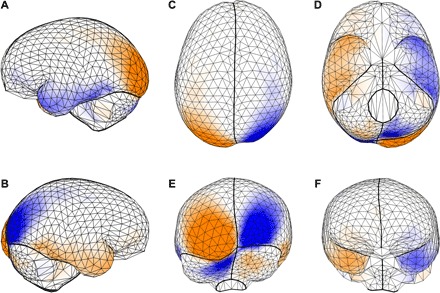
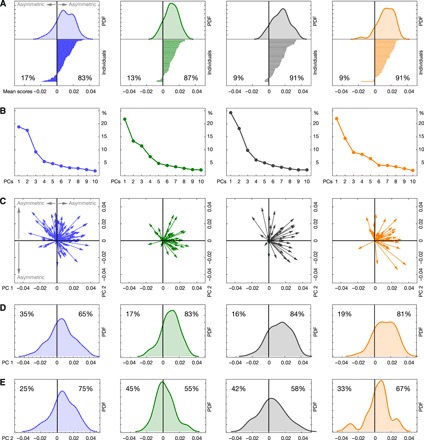
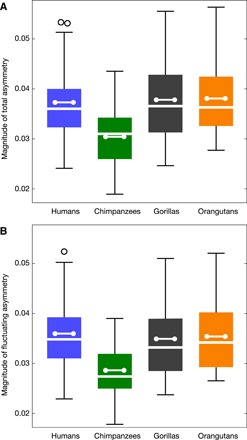
Brain lateralization is commonly interpreted as crucial for human brain function and cognition. However, as comparative studies among primates are rare, it is not known which aspects of lateralization are really uniquely human. Here, we quantify both pattern and magnitude of brain shape asymmetry based on endocranial imprints of the braincase in humans, chimpanzees, gorillas, and orangutans. Like previous studies, we found that humans were more asymmetric than chimpanzees, however so were gorillas and orangutans, highlighting the need to broaden the comparative framework for interpretation. We found that the average spatial asymmetry pattern, previously considered to be uniquely human, was shared among humans and apes. In humans, however, it was less directed, and different local asymmetries were less correlated. We, thus, found human asymmetry to be much more variable compared with that of apes. These findings likely reflect increased functional and developmental modularization of the human brain.


Figures

Fig. 1
Fig. 1. Brains, endocasts, and landmarks.
(A) Casts of the internal bony braincase (endocasts) approximate the size and outer shape of the brain in humans (blue), chimpanzees (green), gorillas (black), and orangutans (orange). (B and C) Asymmetries of the brain, such as frontal and occipital petalias (differential projections of the left and right side indicated by arrows), are observable also on the endocast. (D) In this study, the differences (black lines) between an endocranial landmark configuration (blue spheres) and its relabeled reflection (red spheres) were used as a measure for the magnitude and spatial pattern of shape asymmetry without the need to define a midsagittal plane or any other external reference system.
Fig. 2
Fig. 2. Symmetric and asymmetric variation of endocranial shape.
(A) Principal component (PC) analysis of symmetrized endocranial shape. PC 1 versus PC 2 (59.4 and 12.8% of total shape variation, respectively). (B) Principal component analysis of endocranial shape asymmetry. PC 1 versus PC 2 (18.8 and 13.8% of total shape asymmetry, respectively). (C) Principal component analysis of endocranial shape asymmetry such as in (B), but asymmetry PC scores of each individual are shown as an arrow that represents the individual deviations from symmetry (which corresponds to the origin of the coordinate system). Humans (n = 95) are shown in blue, chimpanzees (n = 47) in green, gorillas (n = 43) in black, and orangutans (n = 43) in orange.
Fig. 3
Fig. 3
Shared directional shape asymmetry pattern. PC 1 of endocranial shape asymmetry in Fig. 2B is shown as a triangulated surface mesh of the 935 (semi)landmarks in (A) left, (B) right, (C) superior, (D) inferior, (E) occipital, and (F) frontal views. The deformation from a symmetric endocranial shape represents the spatial pattern of shape asymmetry; orange surfaces have larger areas as compared with the other side, and blue surfaces have smaller areas. See also movie S1.
Fig. 4
Fig. 4. Asymmetric shape variation within taxa.
(A) Taxon-specific mean asymmetry. The distribution of individual scores along this asymmetry pattern is shown on top (PDF, probability density function); the actual individual scores are shown below as lines. (B) Scree plots for taxon-specific principal component analyses of shape asymmetry display the portion of variance explained by PCs 1 to 10. (C) Taxon-specific principal component (PC) analyses of endocranial shape asymmetry. For each taxon, PC 1 versus PC 2 is shown. PC scores are shown as arrows, representing deviations from symmetry (which corresponds to the origin of the coordinate system). (D and E) Distribution of individuals along the first two taxon-specific PCs. Humans (n = 95) are shown in blue, chimpanzees (n = 47) in green, gorillas (n = 43) in black, and orangutans (n = 43) in orange.
Fig. 5
Fig. 5. Magnitude of shape asymmetry.
(A) Magnitude of total asymmetry (box-whisker plots by taxon). (B) Magnitude of fluctuating asymmetry (box-whisker plots by taxon). Humans (n = 95) are shown in blue, chimpanzees (n = 47) in green, gorillas (n = 43) in black, and orangutans (n = 43) in orange. Whiskers show the range (outliers as open circles), box and white line show the three quartiles, and the dumbbell represents the average.

References

    1. Corballis M. C., Häberling I. S., The many sides of hemispheric asymmetry: A selective review and outlook. J. Int. Neuropsychol. Soc. 23, 710–718 (2017). - PubMed
    1. Toga A. W., Thompson P. M., Mapping brain asymmetry. Nat. Rev. Neurosci. 4, 37–48 (2003). - PubMed
    1. Kong X.-Z., Mathias S. R., Guadalupe T.; ENIGMA Laterality Working Group, Glahn D. C., Franke B., Crivello F., Tzourio-Mazoyer N., Fisher S. E., Thompson P. M., Francks C., Mapping cortical brain asymmetry in 17,141 healthy individuals worldwide via the ENIGMA Consortium. Proc. Natl. Acad. Sci. U.S.A. 115, E5154–E5163 (2018). - PMC - PubMed
    1. Xiang L., Crow T. J., Hopkins W. D., Gong Q., Roberts N., Human torque is not present in chimpanzee brain. Neuroimage 165, 285–293 (2018). - PubMed
    1. Xiang L., Crow T., Roberts N., Cerebral torque is human specific and unrelated to brain size. Brain Struct. Funct. 224, 1141–1150 (2019). - PMC - PubMed

Publication types

LinkOut - more resources