

Real-time forecasts of the COVID-19 epidemic in China from February 5th to February 24th, 2020
- PMID: 32110742
- PMCID: PMC7033348
- DOI: 10.1016/j.idm.2020.02.002
Real-time forecasts of the COVID-19 epidemic in China from February 5th to February 24th, 2020
Abstract
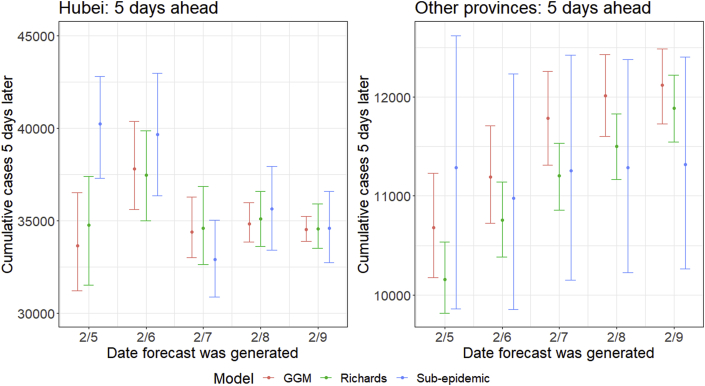
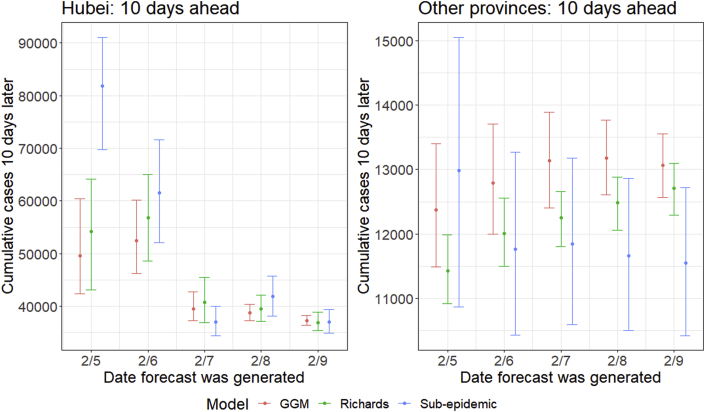
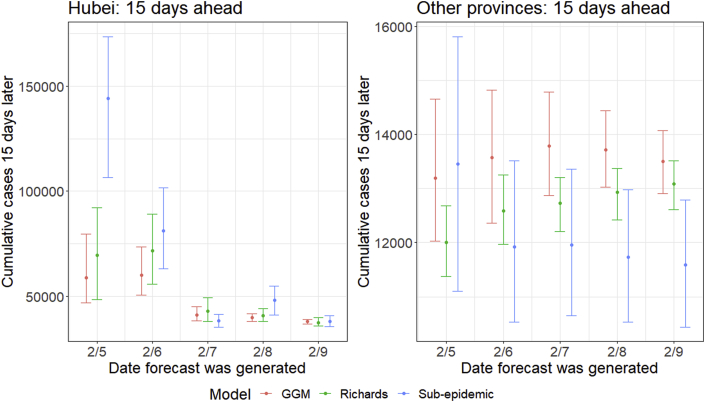
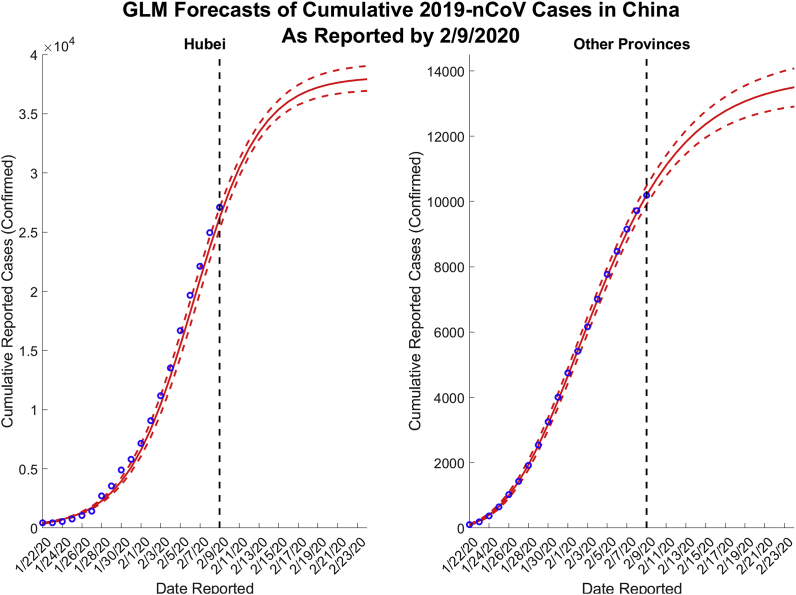
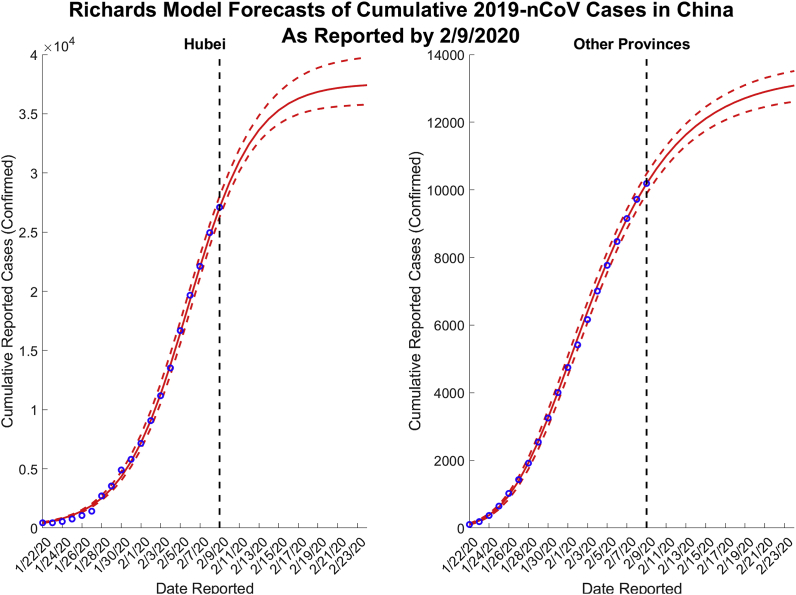
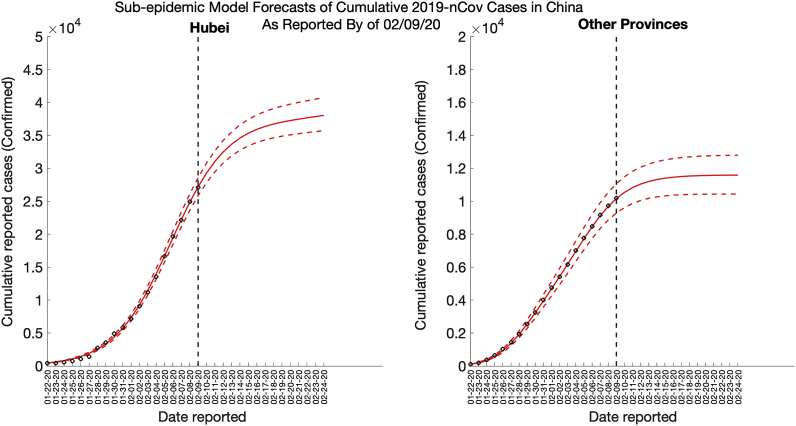
The initial cluster of severe pneumonia cases that triggered the COVID-19 epidemic was identified in Wuhan, China in December 2019. While early cases of the disease were linked to a wet market, human-to-human transmission has driven the rapid spread of the virus throughout China. The Chinese government has implemented containment strategies of city-wide lockdowns, screening at airports and train stations, and isolation of suspected patients; however, the cumulative case count keeps growing every day. The ongoing outbreak presents a challenge for modelers, as limited data are available on the early growth trajectory, and the epidemiological characteristics of the novel coronavirus are yet to be fully elucidated. We use phenomenological models that have been validated during previous outbreaks to generate and assess short-term forecasts of the cumulative number of confirmed reported cases in Hubei province, the epicenter of the epidemic, and for the overall trajectory in China, excluding the province of Hubei. We collect daily reported cumulative confirmed cases for the 2019-nCoV outbreak for each Chinese province from the National Health Commission of China. Here, we provide 5, 10, and 15 day forecasts for five consecutive days, February 5th through February 9th, with quantified uncertainty based on a generalized logistic growth model, the Richards growth model, and a sub-epidemic wave model. Our most recent forecasts reported here, based on data up until February 9, 2020, largely agree across the three models presented and suggest an average range of 7409-7496 additional confirmed cases in Hubei and 1128-1929 additional cases in other provinces within the next five days. Models also predict an average total cumulative case count between 37,415 and 38,028 in Hubei and 11,588-13,499 in other provinces by February 24, 2020. Mean estimates and uncertainty bounds for both Hubei and other provinces have remained relatively stable in the last three reporting dates (February 7th - 9th). We also observe that each of the models predicts that the epidemic has reached saturation in both Hubei and other provinces. Our findings suggest that the containment strategies implemented in China are successfully reducing transmission and that the epidemic growth has slowed in recent days.
Keywords: COVID-19; China; Coronavirus; Phenomenological models; Real-time forecasts.
© 2020 The Authors.
Conflict of interest statement
Authors declare no competing interests.
Figures
References
-
- Ai S., Zhu G., Tian F., Li H., Gao Y., Wu Y., Lin H. Population movement, city closure and spatial transmission of the 2019-nCoV infection in China. 2020. - DOI
-
- Chinese National Health Commission Reported cases of 2019-nCoV. https://ncov.dxy.cn/ncovh5/view/pneumonia?from=groupmessage&isappinstall... Retrieved from.
-
- Chinese National Health Committee Reported cases of 2019-nCoV. https://ncov.dxy.cn/ncovh5/view/pneumonia?from=groupmessage&isappinstall... Retrieved from.
-
- Bürger R., Chowell G., Lara-Díıaz L. Comparative analysis of phenomenological growth models applied to epidemic outbreaks. Math Biosci Eng. 2019;16(5):4250–4273. - PubMed
LinkOut - more resources
Full Text Sources
