. 2020 Feb 26;21(5):1582.
doi: 10.3390/ijms21051582.

Secreted Factors and EV-miRNAs Orchestrate the Healing Capacity of Adipose Mesenchymal Stem Cells for the Treatment of Knee Osteoarthritis

Affiliations

Secreted Factors and EV-miRNAs Orchestrate the Healing Capacity of Adipose Mesenchymal Stem Cells for the Treatment of Knee Osteoarthritis

Enrico Ragni et al. Int J Mol Sci. .

Abstract

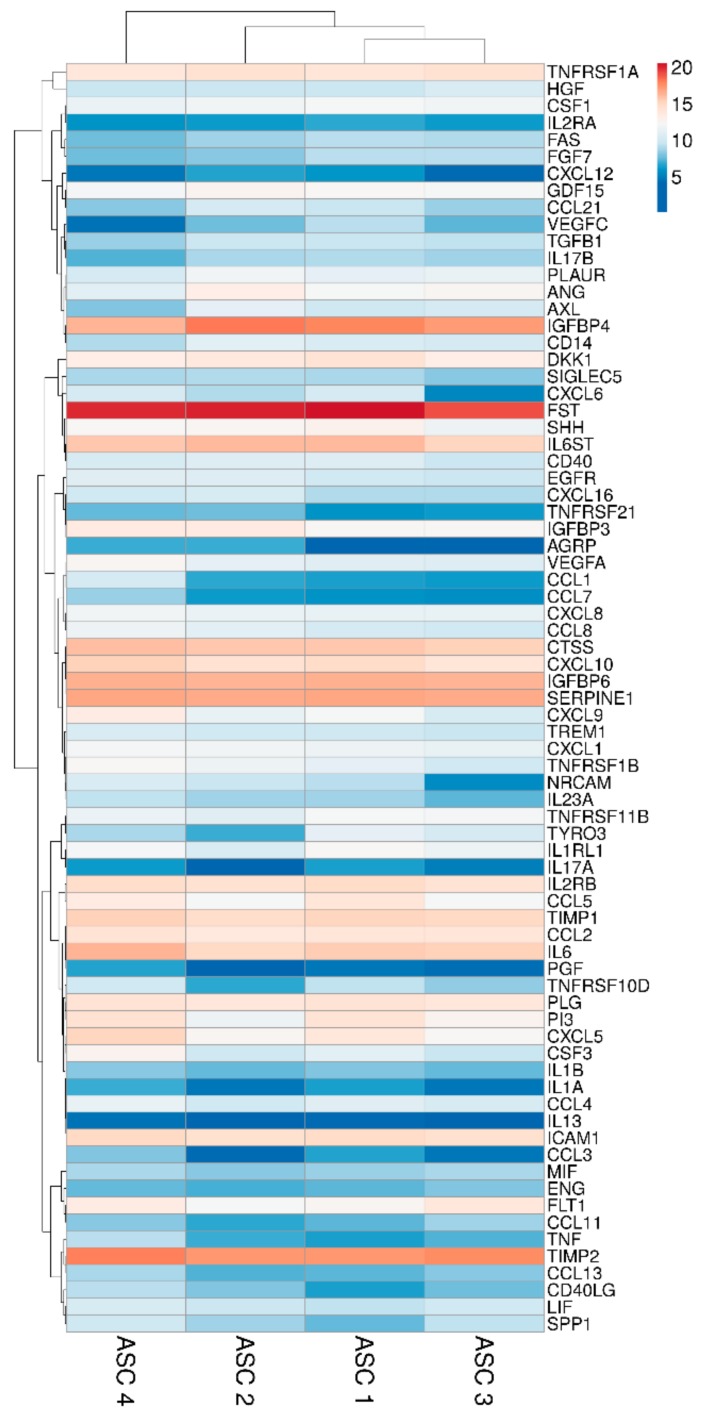
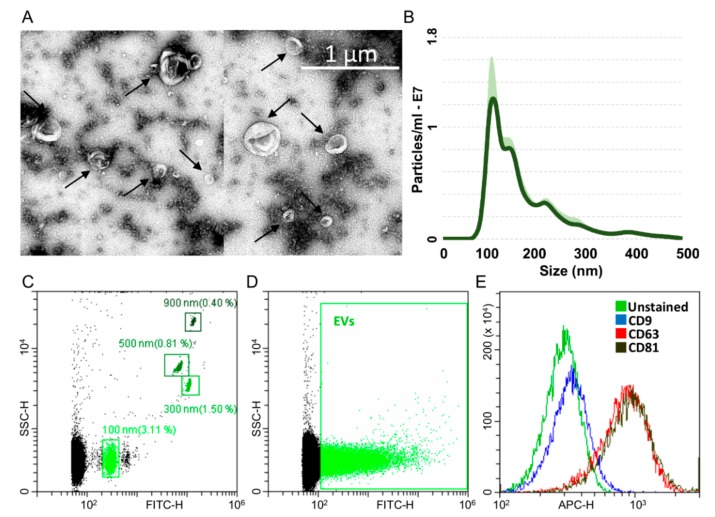
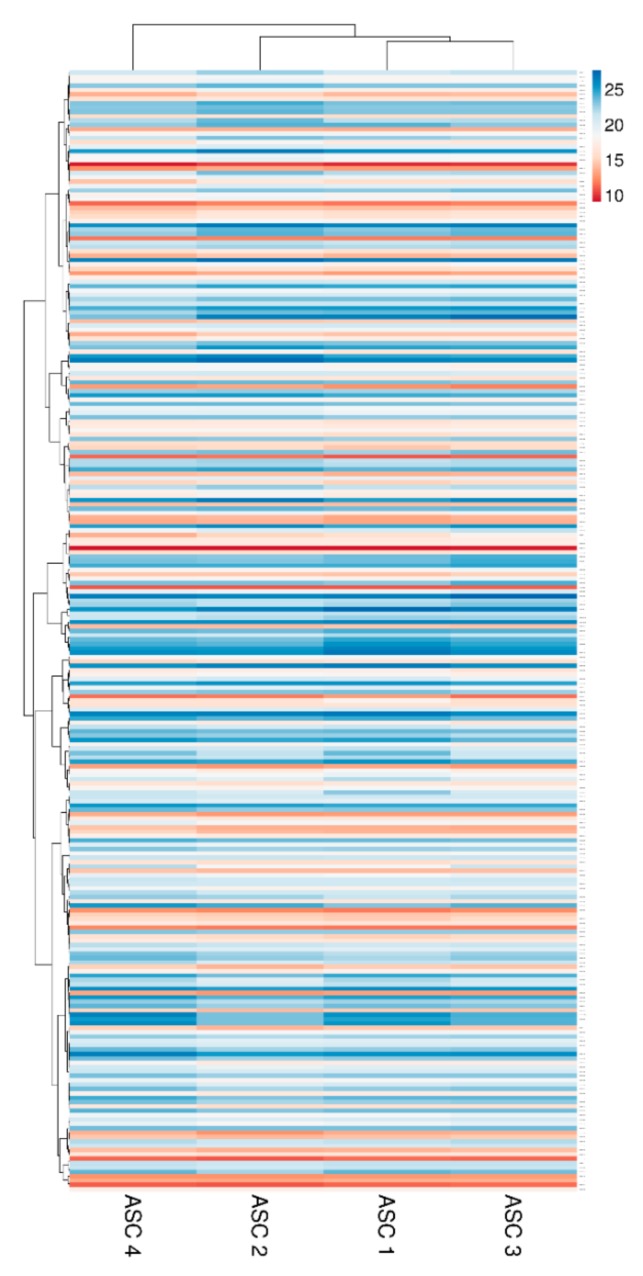
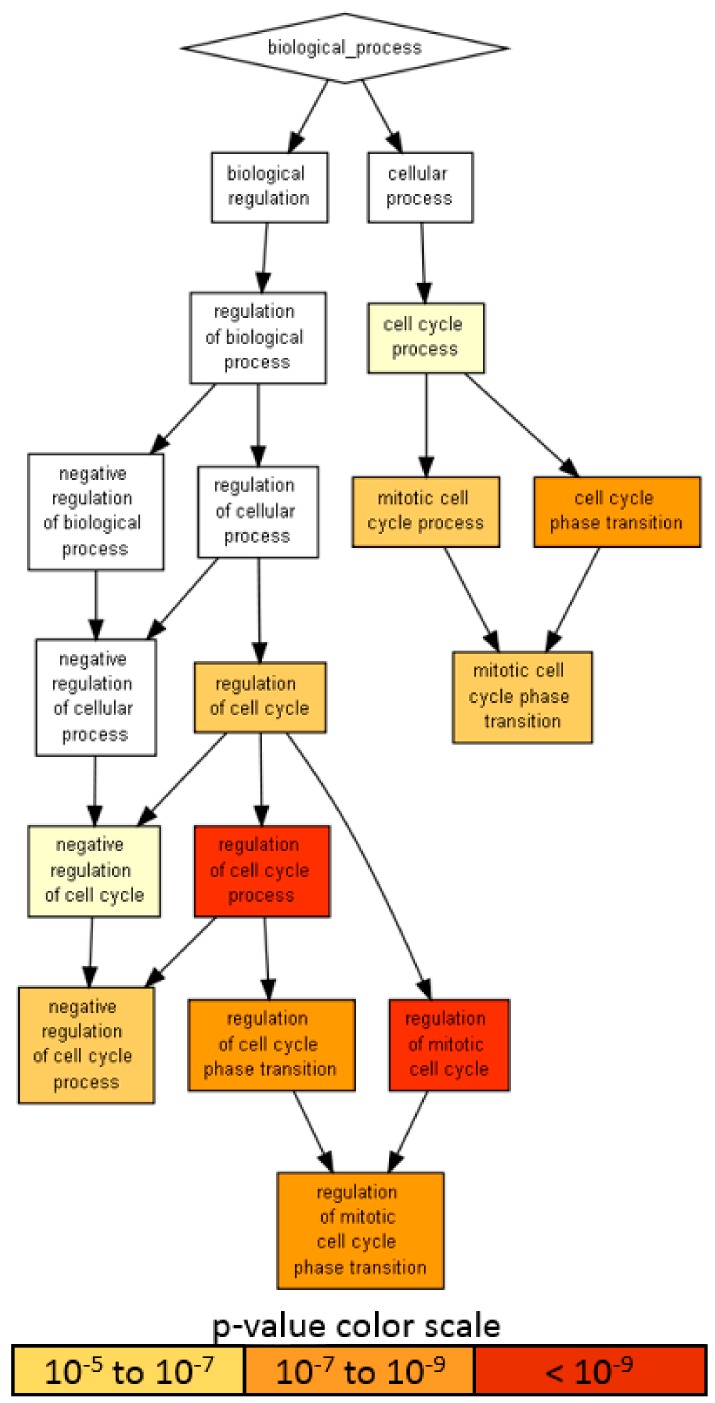
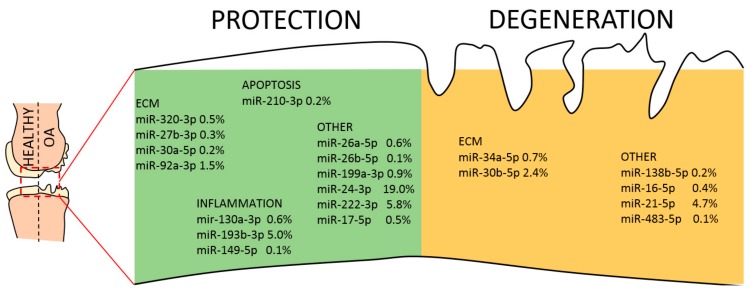
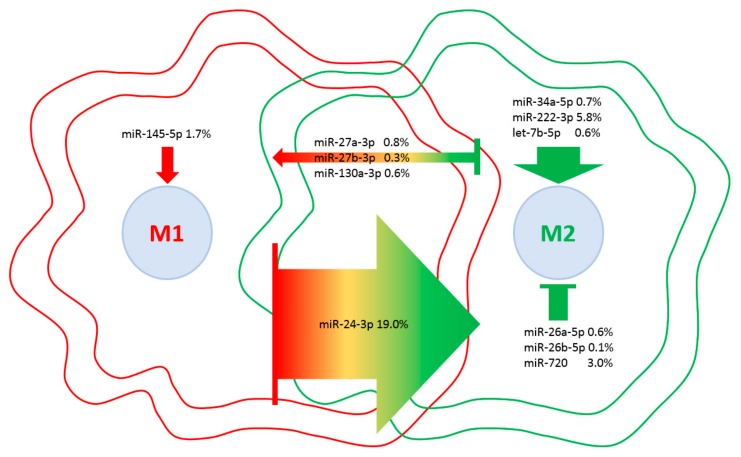
Mesenchymal stem cells (MSCs) derived from adipose tissue and used either as expanded cells or minimally manipulated cell preparations showed positive clinical outcomes in regenerative medicine approaches based on tissue restoration and inflammation control, like in osteoarthritis (OA). Recently, MSCs' healing capacity has been ascribed to the large array of soluble factors, including soluble cytokines/chemokines and miRNAs conveyed within extracellular vesicles (EVs). Therefore, in this study, 200 secreted cytokines, chemokines and growth factors via ELISA, together with EV-embedded miRNAs via high-throughput techniques, were scored in adipose-derived MSCs (ASCs) cultivated under inflammatory conditions, mimicking OA synovial fluid. Both factors (through most abundantly expressed TIMP1, TIMP2, PLG and CTSS) and miRNAs (miR-24-3p, miR-222-3p and miR-193b-3p) suggested a strong capacity for ASCs to reduce matrix degradation activities, as those activated in OA cartilage, and switch synovial macrophages, often characterized by an M1 inflammatory polarization, towards an M2 phenotype. Moreover, the crucial importance of selecting the target tissue is discussed, showing how a focused search may greatly improve potency prediction and explain clinical outcomes. In conclusion, herein presented data shed light about the way ASCs regulate cell homeostasis and regenerative pathways in an OA-resembling environment, therefore suggesting a rationale for the use of MSC-enriched clinical products, such as stromal vascular fraction and microfragmented adipose tissue, in joint pathologies.

Keywords: MSCs; cytokines; extracellular vesicles; fat tissue; joint; miRNAs; osteoarthritis.


Conflict of interest statement

The authors declare no conflicts of interest.

Figures

Figure 1
Figure 1
Surface marker expressions of adipose-derived MSCs (ASCs). After FSC/SSC gating and doublets removal (A), ASCs without and with osteoarthritis (OA) inflammation resulted positive for CD90/73/44 MSC markers (B) and negative for CD34/31/45 hemato/endothelial determinants (C). Red: unstained ASCs, green: stained ASCs and blue: stained inflamed (OA) ASCs. Representative cytograms of a single population are shown.
Figure 2
Figure 2
Heat map of ASCs-secreted factors across all samples. Heat map of hierarchical clustering analysis: the log2 values of 75 detected secreted factors after normalization per 106 ASCs. The sample clustering tree is shown at the top. The color scale shown in the map illustrates the absolute expression levels of factors across all samples: red shades = high expression levels (high log2(pg) per 106 ASCs) and blue shades = lower expression levels (low log2(pg) per 106 ASCs).
Figure 3
Figure 3
A visualization of the biological process gene ontology annotations using Gorilla for identified secreted factors. A) The background dataset used is composed of 200 human factors tested in the ELISA arrays (see Materials and Methods). Enrichment using the 18 factors expressed at > 10 ng per 106 ASCs is shown. B) Enrichment using the 57 factors expressed at < 10 ng per 106 ASCs is shown. The Gorilla settings were left at default values: p-value threshold of p < 10−3, organism Homo sapiens.
Figure 4
Figure 4
Characterization of ASC-EVs (extracellular vesicles). A) Transmission electron micrographs of ASC-EVs showing particles with characteristic cup-shaped morphology. B) Size distribution of nanoparticles by NanoSight particle-tracking analysis. C) Nanometric fluorescent beads with diameters of 100 nm, 300 nm, 500 nm and 900 nm used for flow cytometer calibration confirmed instrument sensitivity with respect to background. D) CFSE-stained ASC-EVs (green) with respect to background. E) Flow cytometry scoring CD63/81 EV marker positivity on CFSE-labeled ASC-EVs. CD9 resulted barely positive. One representative donor is shown.
Figure 5
Figure 5
Heat map of EV-miRNAs across all samples. Heat map of hierarchical clustering analysis of the normalized CRT values of detected miRNAs in ASC-EVs. Rows are centered. The sample clustering tree is shown at the top. The color scale shown in the map illustrates the absolute expression levels of factors across all samples: red shades = high expression levels (low CRT values) and blue shades = lower expression levels (high CRT values).
Figure 6
Figure 6
A visualization of the biological process gene ontology annotations using Gorilla for targets of abundant EV-miRNAs. The background dataset used is composed of the entire human genome. Enrichment using the 818 mRNAs verified as targets of EV-miRNAs in the first quartile of expression. The Gorilla settings were left at default values: p-value threshold of p < 10−6, organism Homo sapiens.
Figure 7
Figure 7
EV-miRNAs involved in protective or destructive mechanisms in the OA joint. Indication of miRNAs in the first quartile of expression in ASC-EVs and their role in cartilage homeostasis. miRNAs are divided per category and the relative amount of their genetic message shown.
Figure 8
Figure 8
EV-miRNAs involved in M1 or M2 polarization in macrophages. Indication of miRNAs in the first quartile of expression in ASC-EVs and their role in macrophage polarization. miRNAs are divided per category, and the relative amount of their genetic message is shown. Direction of arrows represents the guidance of polarization phenotype. Size of arrows reflects the genetic weight.

References

    1. Martel-Pelletier J., Barr A.J., Cicuttini F.M., Conaghan P.G., Cooper C., Goldring M.B., Goldring S.R., Jones G., Teichtahl A.J., Pelletier J.P. Osteoarthritis. Nat. Rev. Dis. Primers. 2016;2:16072. doi: 10.1038/nrdp.2016.72. - DOI - PubMed
    1. Fu K., Robbins S.R., McDougall J.J. Osteoarthritis: The genesis of pain. Rheumatology. 2018;57:iv43–iv50. doi: 10.1093/rheumatology/kex419. - DOI - PubMed
    1. Loeser R.F., Collins J.A., Diekman B.O. Ageing and the pathogenesis of osteoarthritis. Nat. Rev. Rheumatol. 2016;12:412–420. doi: 10.1038/nrrheum.2016.65. - DOI - PMC - PubMed
    1. Nelson A.E., Allen K.D., Golightly Y.M., Goode A.P., Jordan J.M. A systematic review of recommendations and guidelines for the management of osteoarthritis: The chronic osteoarthritis management initiative of the US bone and joint initiative. Semin. Arthritis Rheum. 2014;43:701–712. doi: 10.1016/j.semarthrit.2013.11.012. - DOI - PubMed
    1. Ferket B.S., Feldman Z., Zhou J., Oei E.H., Bierma-Zeinstra S.M., Mazumdar M. Impact of total knee replacement practice: Cost effectiveness analysis of data from the Osteoarthritis Initiative. BMJ. 2017;356:j1131. doi: 10.1136/bmj.j1131. - DOI - PMC - PubMed

MeSH terms