. 2020 Feb 28;21(1):76.
doi: 10.1186/s12859-020-3423-z.

Comparison of pathway and gene-level models for cancer prognosis prediction

Affiliations

Comparison of pathway and gene-level models for cancer prognosis prediction

Xingyu Zheng et al. BMC Bioinformatics. .

Abstract

Background: Cancer prognosis prediction is valuable for patients and clinicians because it allows them to appropriately manage care. A promising direction for improving the performance and interpretation of expression-based predictive models involves the aggregation of gene-level data into biological pathways. While many studies have used pathway-level predictors for cancer survival analysis, a comprehensive comparison of pathway-level and gene-level prognostic models has not been performed. To address this gap, we characterized the performance of penalized Cox proportional hazard models built using either pathway- or gene-level predictors for the cancers profiled in The Cancer Genome Atlas (TCGA) and pathways from the Molecular Signatures Database (MSigDB).

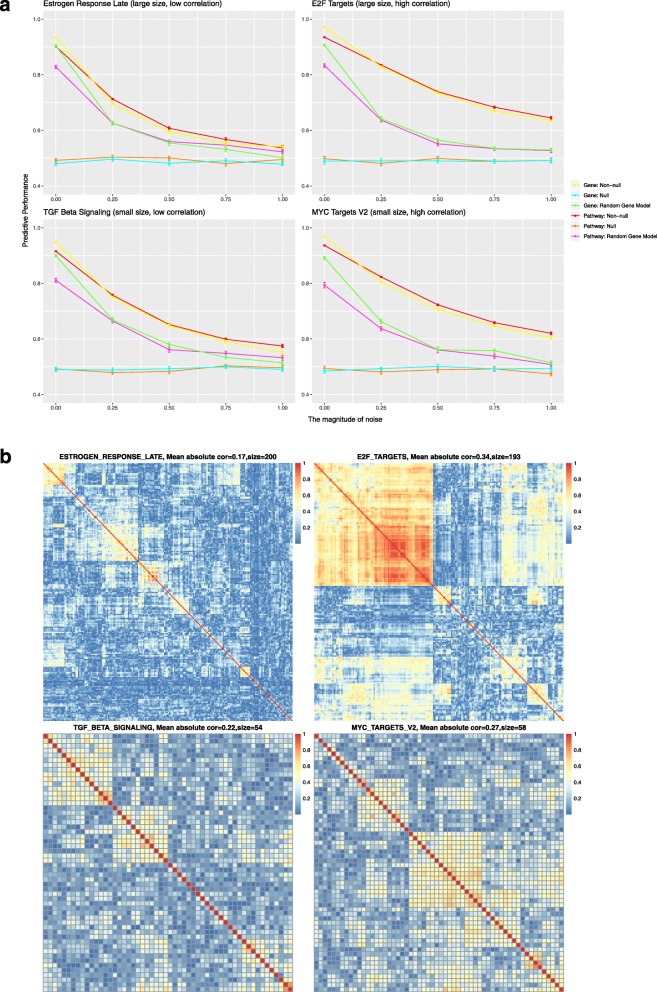
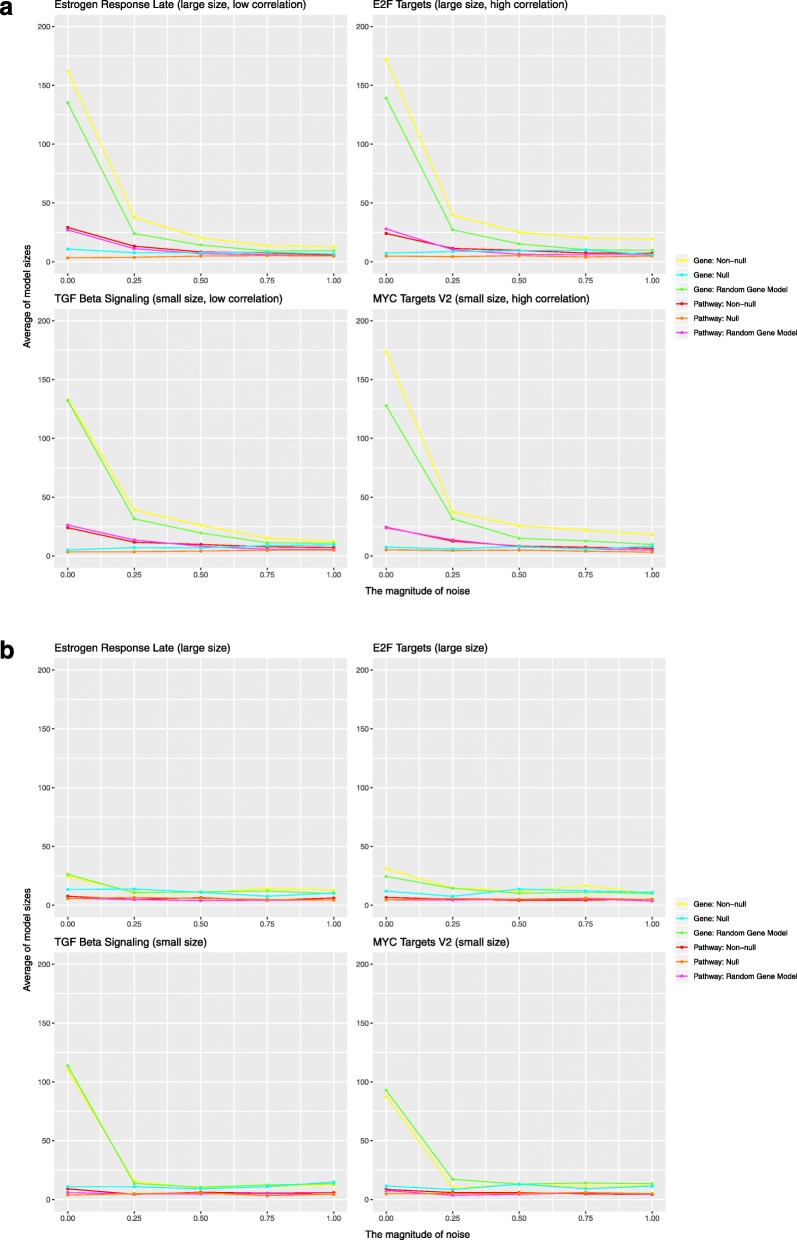
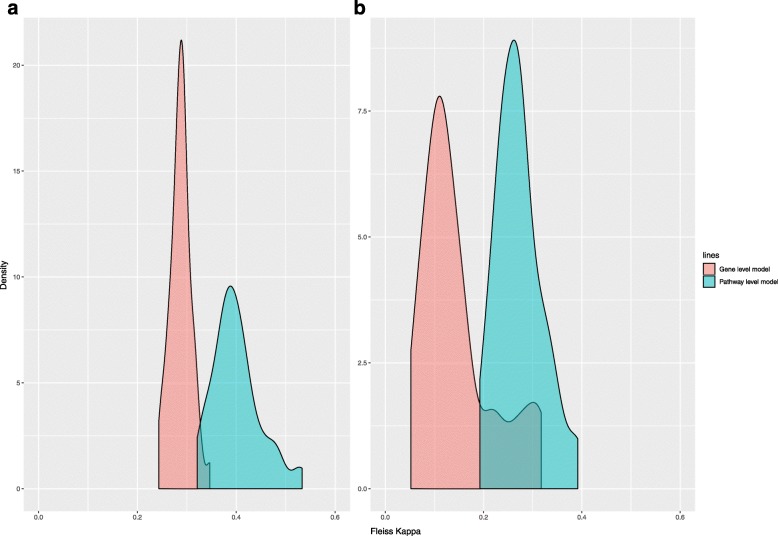
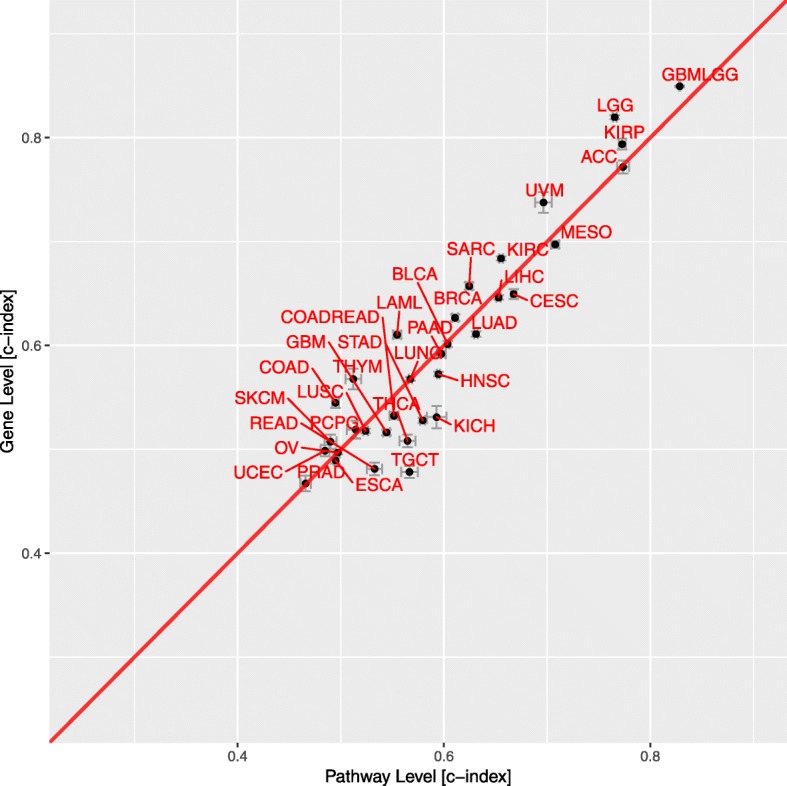
Results: When analyzing TCGA data, we found that pathway-level models are more parsimonious, more robust, more computationally efficient and easier to interpret than gene-level models with similar predictive performance. For example, both pathway-level and gene-level models have an average Cox concordance index of ~ 0.85 for the TCGA glioma cohort, however, the gene-level model has twice as many predictors on average, the predictor composition is less stable across cross-validation folds and estimation takes 40 times as long as compared to the pathway-level model. When the complex correlation structure of the data is broken by permutation, the pathway-level model has greater predictive performance while still retaining superior interpretative power, robustness, parsimony and computational efficiency relative to the gene-level models. For example, the average concordance index of the pathway-level model increases to 0.88 while the gene-level model falls to 0.56 for the TCGA glioma cohort using survival times simulated from uncorrelated gene expression data.

Conclusion: The results of this study show that when the correlations among gene expression values are low, pathway-level analyses can yield better predictive performance, greater interpretative power, more robust models and less computational cost relative to a gene-level model. When correlations among genes are high, a pathway-level analysis provides equivalent predictive power compared to a gene-level analysis while retaining the advantages of interpretability, robustness and computational efficiency.

Keywords: Cancer prognosis prediction; Gene expression data; Inter-gene correlation; L1 penalized regression model; Pathway analysis.


Conflict of interest statement

The authors declare that they have no competing interests.

Figures

Fig. 1
Fig. 1
Workflow for pathway-level models. In this study, TCGA was used as the source of gene expression data and MSigDB as the source of pathway definitions. The first step of the workflow converts the gene-level expression data matrix into pathway-level variables via the unsupervised single sample gene set method GSVA. After obtaining a pathway-level data matrix, nested cross validation was used to train and evaluate a Lasso-penalized Cox proportional hazards model. Cross validation was employed both for the training vs. test split and within each training fold for selection of the Lasso penalty parameter. With the selected pathways and estimated parameters, we performed prediction on the test data subset by applying the Cox proportional hazards regression model that had been identified in the training data subset
Fig. 2
Fig. 2
Workflow for gene-level models. In this study, TCGA was used as the source of gene expression data. The expression data used for the gene-level models was filtered to only contain the genes mapped to the pathways considered for the pathway-level models. Nested cross validation was used to train and evaluate a Lasso-penalized Cox proportional hazards model. Cross validation was employed both for the training vs. test split and within each training fold for selection of the Lasso penalty parameter. With the selected genes and estimated parameters, we performed prediction on the test data subset by applying the Cox proportional hazards regression model that had been identified in the training data subset
Fig. 3
Fig. 3
Random gene model design. In the random gene model, the survival time was associated with a group of random genes whose size was equal to the size of the pathway that was associated with survival time in the non-null model
Fig. 4
Fig. 4
Results of the simulation study based on gene expression data from the LGG cohort and representative pathways from the MSigDB Hallmark collection. a Each panel plots the predictive performance of the evaluated gene-level and pathway-level models for simulation studies that associated survival with one of four Hallmark pathways (Hallmark estrogen response late, Hallmark E2F targets, Hallmark TGF beta signaling and Hallmark MYC targets V2 respectively) selected to represent the four possible combinations of large or small pathway size and high or low average inter-gene correlation. In these plots, the Cox concordance index is plotted on the y-axis with the x-axis representing the standard deviation of the Gaussian noise added to the simulated survival times. The error bars represent the standard error over 20 replications. b Heatmaps that represent the inter-gene correlation structure of the four corresponding Hallmark pathways as computed on the LGG cohort gene expression data
Fig. 5
Fig. 5
Results of the simulation study based on gene expression data from the TCGA LGG cohort without inter-gene correlation and representative pathways from the MSigDB Hallmark collection. a The correlation in the gene expression data has been broken by randomly permuting the values for each gene. Each panel plots the predictive performance of the evaluated gene-level and pathway-level models for simulation studies that associated survival with one of four Hallmark pathways (Hallmark estrogen response late, Hallmark E2F targets, Hallmark TGF beta signaling and Hallmark MYC targets V2 respectively) selected to represent the four possible combinations of large or small pathway size and high or low average inter-gene correlation. In these plots, the Cox concordance index is plotted on the y-axis with the x-axis representing the standard deviation of the Gaussian noise added to the simulated survival times. The error bars represent the standard error over 20 replications. b Heatmaps that represent the lack of inter-gene correlation for the four corresponding Hallmark pathways after random permutation of the gene expression values
Fig. 6
Fig. 6
Correlation of single sample pathway scores. a Heatmap illustrating the correlation between the GSVA single sample scores for the pathways in the MSigDB Hallmark collection as computed using the TCGA LGG cohort gene expression data. b Heatmap illustrating the single sample pathway score correlations after breaking the inter-gene correlation structure
Fig. 7
Fig. 7
Average number of predictors in the non-null models. a Each plot shows the average number of predictors as a function of added noise for the simulation studies that did not alter the inter-gene correlation structure. b The average number predictors for the simulation studies where the inter-gene correlation structure was broken
Fig. 8
Fig. 8
Density distribution of Fleiss Kappa statistics across 50 pathways for the non-null models when there’s no noise in the simulation. Fifty pathways from hallmark collection have been separately used in the non-null model workflows for total 100 runs. Fleiss Kappa was calculated to measure the agreement among these 100 runs. a Distribution of Fleiss Kappa in the first simulation study. Pathway-level model has better model stability than gene-level model. b Distribution of Fleiss Kappa in the second simulation which broke the inter-gene correlation. Without inter-gene correlation, pathway-level model became more advantageous in model stability compared with gene-level model
Fig. 9
Fig. 9
Predictive performance of gene-level and pathway-level models for 33 TCGA cohorts. Each point represents the average Cox concordance index of 50 replications for the pathway-level and gene-level models for a given TCGA cohort. Error bars represent the standard error of the estimates across50 replications
Fig. 10
Fig. 10
The distribution of survival times for LGG, GBM, GBMLGG cohorts

Similar articles

Cited by

References

    1. Barillot E. Computational systems biology of Cancer. Boca Raton: CRC Press; 2012.
    1. Tandon AK, Clark GM, Chamness GC, Ullrich A, McGuire WL. HER-2/neu oncogene protein and prognosis in breast cancer. J Clin Oncol. 1989;7(8):1120–1128. - PubMed
    1. Verma M. Personalized medicine and cancer. J Pers Med. 2012;2(1):1–14. - PMC - PubMed
    1. Jenssen TK, Kuo WP, Stokke T, Hovig E. Associations between gene expressions in breast cancer and patient survival. Hum Genet. 2002;111(4–5):411–420. - PubMed
    1. Park MY, Hastie T. L1-regularization path algorithm for generalized linear models. J R Stat Soc Ser B Stat Methodol. 2007;69(4):659–677.