Multiple m6A RNA methylation modulators promote the malignant progression of hepatocellular carcinoma and affect its clinical prognosis
- PMID: 32111180
- PMCID: PMC7047390
- DOI: 10.1186/s12885-020-6638-5
Multiple m6A RNA methylation modulators promote the malignant progression of hepatocellular carcinoma and affect its clinical prognosis
Abstract
Background: Hepatocellular carcinoma (HCC) is the second most common cause of cancer-related death in the world. N6-methyladenosine (m6A) RNA methylation is dynamically regulated by m6A RNA methylation modulators ("writer," "eraser," and "reader" proteins), which are associated with cancer occurrence and development. The purpose of this study was to explore the relationships between m6A RNA methylation modulators and HCC.
Methods: First, using data from The Cancer Genome Atlas (TCGA) and International Cancer Genome Consortium (ICGC) databases, we compared the expression levels of 13 major m6A RNA methylation modulators between HCC and normal tissues. Second, we applied consensus clustering to the expression data on the m6A RNA methylation modulators to divide the HCC tissues into two subgroups (clusters 1 and 2), and we compared the clusters in terms of overall survival (OS), World Health Organization (WHO) stage, and pathological grade. Third, using least absolute shrinkage and selection operator (LASSO) regression, we constructed a risk signature involving the m6A RNA methylation modulators that affected OS in TCGA and ICGC analyses.
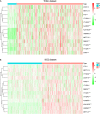
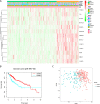
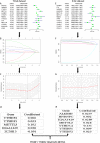
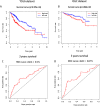
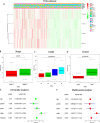
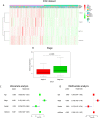
Results: We found that the expression levels of 12 major m6A RNA methylation modulators were significantly different between HCC and normal tissues. After dividing the HCC tissues into clusters 1 and 2, we found that cluster 2 had poorer OS, higher WHO stage, and higher pathological grade. Four m6A RNA methylation modulators (YTHDF1, YTHDF2, METTL3, and KIAA1429) affecting OS in the TCGA and ICGC analyses were selected to construct a risk signature, which was significantly associated with WHO stage and was also an independent prognostic marker of OS.
Conclusions: In summary, m6A RNA methylation modulators are key participants in the malignant progression of HCC and have potential value in prognostication and treatment decisions.
Keywords: Liver hepatocellular carcinoma; Prognosis; RNA methylation; m6A.
Conflict of interest statement
The authors declare that they have no competing interests.
Figures
Similar articles
-
The functional roles, cross-talk and clinical implications of m6A modification and circRNA in hepatocellular carcinoma.Int J Biol Sci. 2021 Jul 22;17(12):3059-3079. doi: 10.7150/ijbs.62767. eCollection 2021. Int J Biol Sci. 2021. PMID: 34421350 Free PMC article. Review.
-
Prognostic Value of an m6A RNA Methylation Regulator-Based Signature in Patients with Hepatocellular Carcinoma.Biomed Res Int. 2020 Jul 15;2020:2053902. doi: 10.1155/2020/2053902. eCollection 2020. Biomed Res Int. 2020. PMID: 32733931 Free PMC article.
-
The Cancer Genome Atlas (TCGA) based m6A methylation-related genes predict prognosis in hepatocellular carcinoma.Bioengineered. 2020 Dec;11(1):759-768. doi: 10.1080/21655979.2020.1787764. Bioengineered. 2020. PMID: 32631107 Free PMC article.
-
m6A RNA Methylation Regulators Elicit Malignant Progression and Predict Clinical Outcome in Hepatocellular Carcinoma.Dis Markers. 2021 Jun 4;2021:8859590. doi: 10.1155/2021/8859590. eCollection 2021. Dis Markers. 2021. PMID: 34234878 Free PMC article.
-
Roles of M6A Regulators in Hepatocellular Carcinoma: Promotion or Suppression.Curr Gene Ther. 2022;22(1):40-50. doi: 10.2174/1566523221666211126105940. Curr Gene Ther. 2022. PMID: 34825870 Review.
Cited by
-
Novel prognostic implications of YTH domain family 2 in resected hepatocellular carcinoma.Oncol Lett. 2021 Jul;22(1):538. doi: 10.3892/ol.2021.12799. Epub 2021 May 19. Oncol Lett. 2021. PMID: 34084217 Free PMC article.
-
The role of RNA modification in hepatocellular carcinoma.Front Pharmacol. 2022 Sep 2;13:984453. doi: 10.3389/fphar.2022.984453. eCollection 2022. Front Pharmacol. 2022. PMID: 36120301 Free PMC article. Review.
-
Role of N6-Methyladenosine (m6A) Methylation Regulators in Hepatocellular Carcinoma.Front Oncol. 2021 Oct 7;11:755206. doi: 10.3389/fonc.2021.755206. eCollection 2021. Front Oncol. 2021. PMID: 34692544 Free PMC article. Review.
-
The functional roles, cross-talk and clinical implications of m6A modification and circRNA in hepatocellular carcinoma.Int J Biol Sci. 2021 Jul 22;17(12):3059-3079. doi: 10.7150/ijbs.62767. eCollection 2021. Int J Biol Sci. 2021. PMID: 34421350 Free PMC article. Review.
-
Clinical significance of RNA methylation in hepatocellular carcinoma.Cell Commun Signal. 2024 Apr 2;22(1):204. doi: 10.1186/s12964-024-01595-w. Cell Commun Signal. 2024. PMID: 38566136 Free PMC article. Review.
References
MeSH terms
Substances
Grants and funding
LinkOut - more resources
Full Text Sources
Medical

