

Does sunlight drive seasonality of TB in Vietnam? A retrospective environmental ecological study of tuberculosis seasonality in Vietnam from 2010 to 2015
- PMID: 32111195
- PMCID: PMC7048025
- DOI: 10.1186/s12879-020-4908-0
Does sunlight drive seasonality of TB in Vietnam? A retrospective environmental ecological study of tuberculosis seasonality in Vietnam from 2010 to 2015
Abstract
Background: Tuberculosis (TB) is a major global health burden, with an estimated quarter of the world's population being infected. The World Health Organization (WHO) launched the "End TB Strategy" in 2014 emphasising knowing the epidemic. WHO ranks Vietnam 12th in the world of high burden countries. TB spatial and temporal patterns have been observed globally with evidence of Vitamin D playing a role in seasonality. We explored the presence of temporal and spatial clustering of TB in Vietnam and their determinants to aid public health measures.
Methods: Data were collected by the National TB program of Vietnam from 2010 to 2015 and linked to the following datasets: socio-demographic characteristics; climatic variables; influenza-like-illness (ILI) incidence; geospatial data. The TB dataset was aggregated by province and quarter. Descriptive time series analyses using LOESS regression were completed per province to determine seasonality and trend. Harmonic regression was used to determine the amplitude of seasonality by province. A mixed-effect linear model was used with province and year as random effects and all other variables as fixed effects.
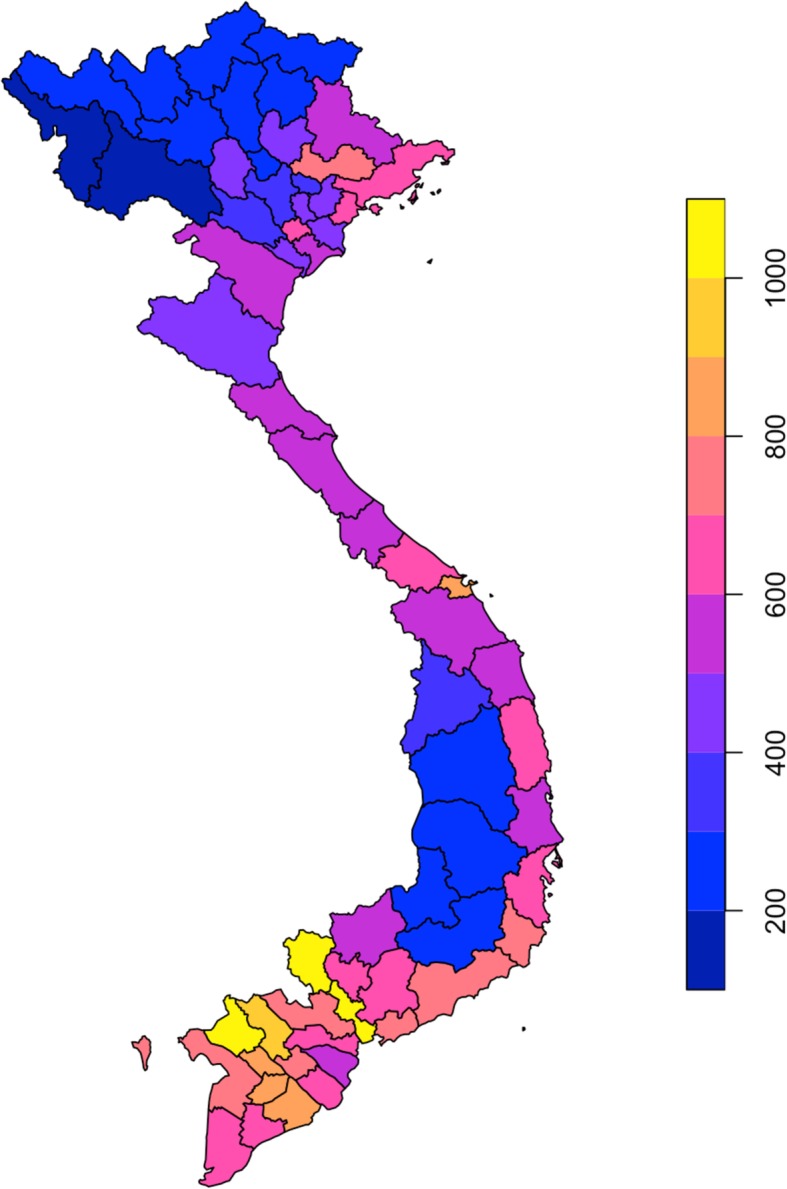
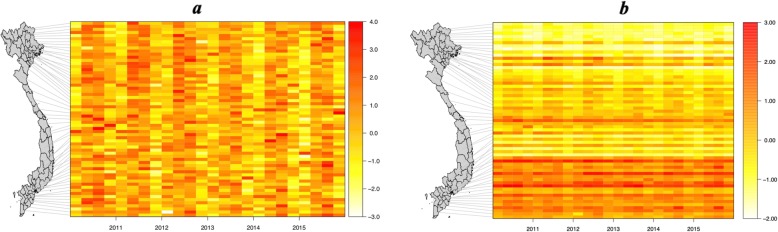
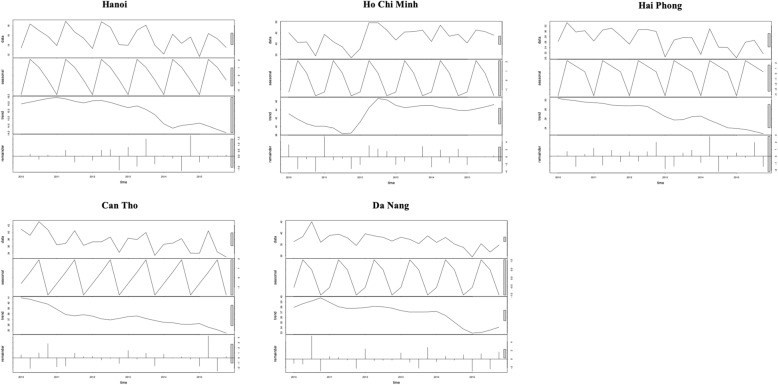
Results: There were 610,676 cases of TB notified between 2010 and 2015 in Vietnam. Heat maps of TB incidence per quarter per province showed substantial temporal and geospatial variation. Time series analysis demonstrated seasonality throughout the country, with peaks in spring/summer and troughs in autumn/winter. Incidence was consistently higher in the south, the three provinces with the highest incidence per 100,000 population were Tay Ninh, An Giang and Ho Chi Minh City. However, relative seasonal amplitude was more pronounced in the north. Mixed-effect linear model confirmed that TB incidence was associated with time and latitude. Of the demographic, socio-economic and health related variables, population density, percentage of those under 15 years of age, and HIV infection prevalence per province were associated with TB incidence. Of the climate variables, absolute humidity, average temperature and sunlight were associated with TB incidence.
Conclusion: Preventative public health measures should be focused in the south of Viet Nam where incidence is highest. Vitamin D is unlikely to be a strong driver of seasonality but supplementation may play a role in a package of interventions.
Keywords: Meteorological; Seasonality; Sunshine; Tuberculosis; Vietnam.
Conflict of interest statement
The authors declare that they have no competing interests.
Figures

Similar articles
-
The relationship between seasonality, latitude and tuberculosis notifications in Pakistan.BMC Infect Dis. 2021 Feb 25;21(1):210. doi: 10.1186/s12879-021-05899-x. BMC Infect Dis. 2021. PMID: 33632152 Free PMC article.
-
Seasonality of absolute humidity explains seasonality of influenza-like illness in Vietnam.Epidemics. 2015 Dec;13:65-73. doi: 10.1016/j.epidem.2015.06.002. Epub 2015 Aug 28. Epidemics. 2015. PMID: 26616043
-
Spatiotemporal Patterns of Tuberculosis in Hunan Province, China.Int J Environ Res Public Health. 2021 Jun 24;18(13):6778. doi: 10.3390/ijerph18136778. Int J Environ Res Public Health. 2021. PMID: 34202504 Free PMC article.
-
Tuberculosis.In: Holmes KK, Bertozzi S, Bloom BR, Jha P, editors. Major Infectious Diseases. 3rd edition. Washington (DC): The International Bank for Reconstruction and Development / The World Bank; 2017 Nov 3. Chapter 11. In: Holmes KK, Bertozzi S, Bloom BR, Jha P, editors. Major Infectious Diseases. 3rd edition. Washington (DC): The International Bank for Reconstruction and Development / The World Bank; 2017 Nov 3. Chapter 11. PMID: 30212088 Free Books & Documents. Review.
-
Rising HIV infection rates in Ho Chi Minh City herald emerging AIDS epidemic in Vietnam.AIDS. 1997 Sep;11 Suppl 1:S5-13. AIDS. 1997. PMID: 9376101 Review.
Cited by
-
Spatial Analysis of Drug-Susceptible and Multidrug-Resistant Cases of Tuberculosis, Ho Chi Minh City, Vietnam, 2020-2023.Emerg Infect Dis. 2024 Mar;30(3):499-509. doi: 10.3201/eid3003.231309. Emerg Infect Dis. 2024. PMID: 38407176 Free PMC article.
-
Temperature and humidity associated with increases in tuberculosis notifications: a time-series study in Hong Kong.Epidemiol Infect. 2020 Dec 28;149:e8. doi: 10.1017/S0950268820003040. Epidemiol Infect. 2020. PMID: 33436107 Free PMC article.
-
Retrospective Cohort Study of Effects of the COVID-19 Pandemic on Tuberculosis Notifications, Vietnam, 2020.Emerg Infect Dis. 2022 Mar;28(3):684-692. doi: 10.3201/eid2803.211919. Emerg Infect Dis. 2022. PMID: 35202526 Free PMC article.
-
Predicting Tuberculosis Risk in Cattle, Buffaloes, Sheep, and Goats in China Based on Air Pollutants and Meteorological Factors.Animals (Basel). 2024 Dec 22;14(24):3704. doi: 10.3390/ani14243704. Animals (Basel). 2024. PMID: 39765608 Free PMC article.
-
Tuberculosis epidemiological trend in Sousse, Tunisia during twenty years (2000-2019).Libyan J Med. 2022 Dec;17(1):2003968. doi: 10.1080/19932820.2021.2003968. Libyan J Med. 2022. PMID: 34802395 Free PMC article.
References
-
- Shah M, Reed C. Complications of tuberculosis. Curr Opin Infect Dis. 2014;27(5):403–410. - PubMed
-
- WHO . Executive summary World Health Organisation. 2018. Global Tuberculosis Report.
-
- Organisation WH. The End TB Strategy: Global strategy and targets for tuberculosis prevention, care and control after 2015: World Health Organisation; 2014. May 2014. Contract No.: A67/11. www.who.int/tb/strategy/End_TB_Strategy.pdf.
-
- WHO . World Health Organisation. 2019. TB country profile.
MeSH terms
Grants and funding
LinkOut - more resources
Full Text Sources
Medical
