. 2020 Feb 28;12(1):23.
doi: 10.1186/s13073-020-00723-8.

Comprehensive characterization of cell-free tumor DNA in plasma and urine of patients with renal tumors

Affiliations

Comprehensive characterization of cell-free tumor DNA in plasma and urine of patients with renal tumors

Christopher G Smith et al. Genome Med. .

Abstract

Background: Cell-free tumor-derived DNA (ctDNA) allows non-invasive monitoring of cancers, but its utility in renal cell cancer (RCC) has not been established.

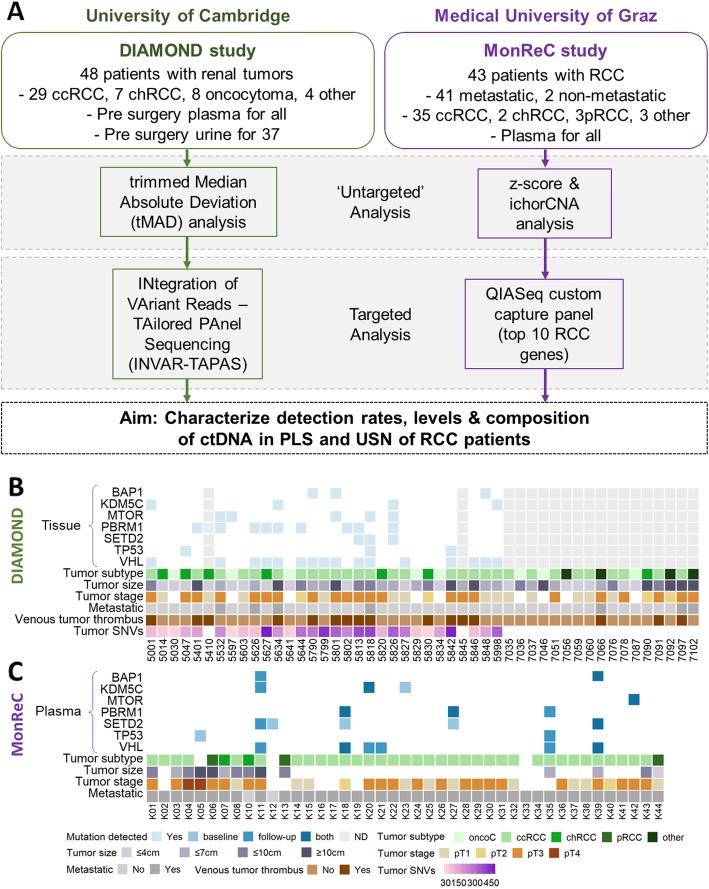
Methods: Here, a combination of untargeted and targeted sequencing methods, applied to two independent cohorts of patients (n = 91) with various renal tumor subtypes, were used to determine ctDNA content in plasma and urine.

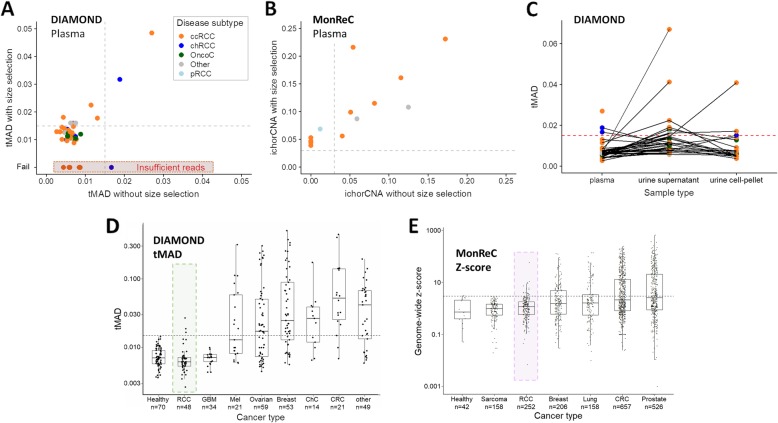
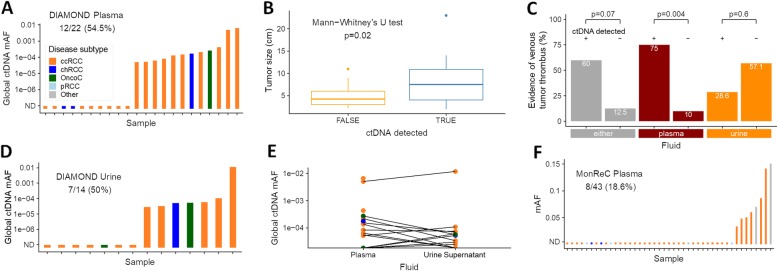
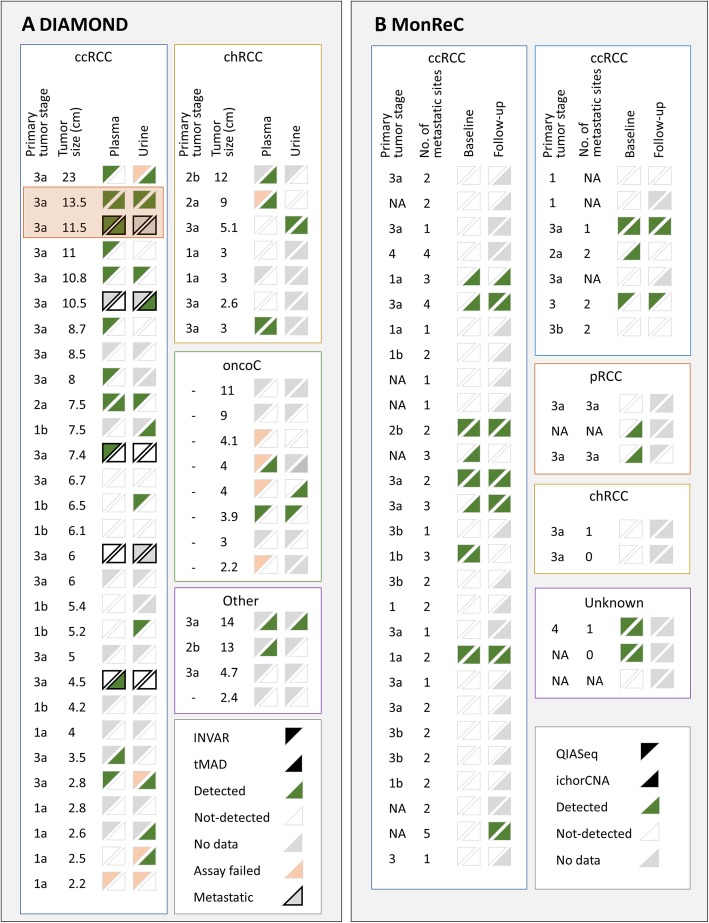
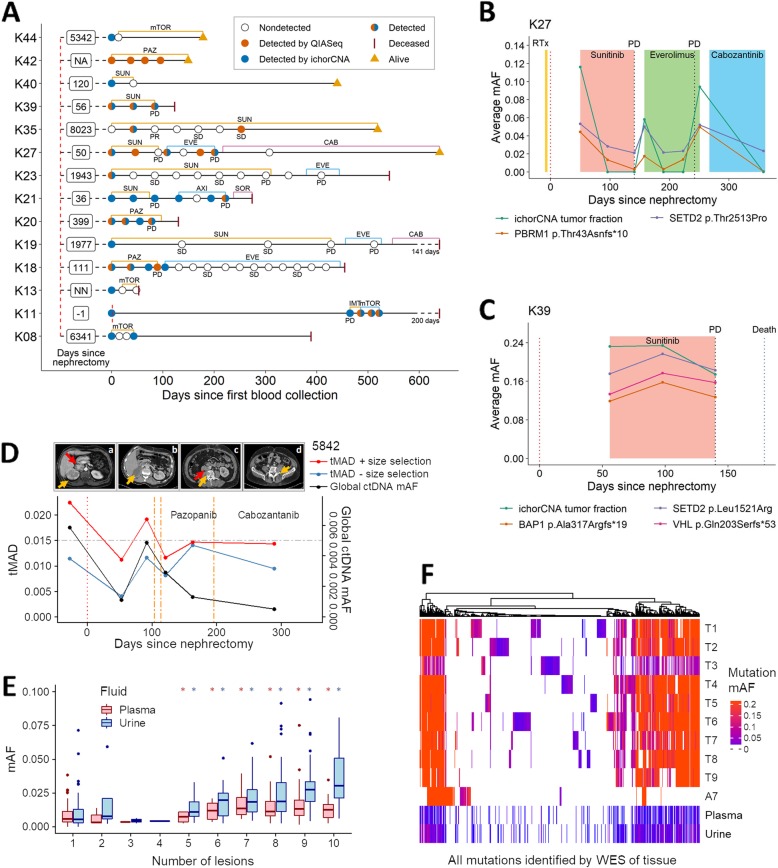
Results: Our data revealed lower plasma ctDNA levels in RCC relative to other cancers of similar size and stage, with untargeted detection in 27.5% of patients from both cohorts. A sensitive personalized approach, applied to plasma and urine from select patients (n = 22) improved detection to ~ 50%, including in patients with early-stage disease and even benign lesions. Detection in plasma, but not urine, was more frequent amongst patients with larger tumors and in those patients with venous tumor thrombus. With data from one extensively characterized patient, we observed that plasma and, for the first time, urine ctDNA may better represent tumor heterogeneity than a single tissue biopsy. Furthermore, in a subset of patients (n = 16), longitudinal sampling revealed that ctDNA can track disease course and may pre-empt radiological identification of minimal residual disease or disease progression on systemic therapy. Additional datasets will be required to validate these findings.

Conclusions: These data highlight RCC as a ctDNA-low malignancy. The biological reasons for this are yet to be determined. Nonetheless, our findings indicate potential clinical utility in the management of patients with renal tumors, provided improvement in isolation and detection approaches.

Keywords: Cell-free tumor DNA (ctDNA); Heterogeneity; Personalized analysis; Predictive biomarker; Renal cancer.


Conflict of interest statement

GDS has received educational grants from Pfizer, AstraZeneca, and Intuitive Surgical, consultancy fees from Merck, Pfizer, EUSA Pharma, and CMR Surgical, travel expenses from Pfizer and speaker fees from Pfizer. NR is a cofounder and shareholder of Inivata Ltd., a cancer genomics company that commercializes ctDNA analysis. TE and AM are employees of AstraZeneca and TE has received research support from AstraZeneca, Bayer, and Pfizer. Inivata and AstraZeneca had no role in the conceptualization, study design, data collection, and analysis, decision to publish, or preparation of the manuscript. Cancer Research UK has filed patent applications protecting methods described in this manuscript. CGS, FM, KH, JCMW, CEM, NR, and other authors may be listed as co-inventors on patent application numbers 1803596.4 (“Improvements in variant detection”), 1818159.4 (“Enhanced detection of target DNA by fragment size analysis”), and other potential patents describing methods for the analysis of DNA fragments and applications of ctDNA. EH receives funds for the Christian Doppler Laboratory for Liquid Biopsies for Early Detection of Cancer from Freenome and PreAnalytiX. The remaining authors declare that they have no competing interests.

Figures

Fig. 1
Fig. 1
Study design, patient characteristics, and tumor genomic profile. a ctDNA analysis in RCC patients was applied to two patient cohorts, DIAMOND and MonReC. Initially, untargeted sequencing methods were applied to samples. For DIAMOND, tMAD analysis of sWGS data was applied. For MonReC, a combination of z-score analyses of mFAST-SeqS data and ichorCNA analysis of sWGS data was applied. Subsequently, targeted sequencing methods were used. For DIAMOND, INVAR-TAPAS was applied to patient plasma (n = 29) and urine (n = 20). For MonReC, a QIASeq custom capture panel targeting the 10 most commonly mutated genes in RCC patients was applied. b For DIAMOND, plasma (n = 48) and urine (n = 37) were collected from patients with a range of tumor subtypes and stages. Specifically, 29 ccRCCs (11/1/16 stage I, II, and III respectively), 7 chRCCs (2/2/3 stage I, II, and III), 8 oncocytomas, 1 patient with papillary RCC (stage III), 1 patient with a MiT family translocation RCC (stage II), and 2 patients with oncocytic renal neoplasm. Shown, in descending order, are tumor tissue mutation status of frequently mutated RCC genes (pale blue cubes indicate that a mutation was detected, white space indicates that no mutation was detected, gray columns indicate that tissue was not available for that patient), tumor subtype, tumor size, tumor stage, metastatic at baseline, evidence of venous tumor thrombus, and number of tumor SNVs (targeted for INVAR-TAPAS). c For MonReC, plasma (n = 43) was collected from 41 patients with metastatic RCC and two with localized RCC. Shown, in descending order, are plasma mutation status (after QIASeq, blue, medium blue and dark blue cubes indicate that a mutation was detected at baseline, during follow-up, or at both time points respectively) of frequently mutated RCC genes, tumor subtype, tumor size, and metastatic at time of sampling. More comprehensive versions of b and c are provided in Additional file 1: Fig. S15
Fig. 2
Fig. 2
ctDNA detection using untargeted assays. a Distribution of tMAD scores across DIAMOND plasma samples (x-axis). Data points are colored according to disease subtype. A tMAD score of > 0.015 (gray dashed line) indicates SCNA, and thus ctDNA. ctDNA was detected in 3/48 (6.3%) plasma samples. Data on the y-axis show tMAD scores for the same plasma samples after in silico size selection for sequencing reads 90–150 bp in length. On average, the tMAD score increased 2.2-fold (range 1.25–4.83) and led to ctDNA detection in 8 additional patient samples, resulting in ctDNA detection in 11/48 (22.9%) DIAMOND patients. Four patient samples had insufficient sequencing reads after size selection for tMAD analysis (red highlight). b Tumor fraction of MonReC ctDNA-positive plasma samples (n = 14), as calculated by ichorCNA, before and after in silico size selection for sequencing reads 90–150 bp in length. On average, tumor fraction increased 2.2-fold (range 0.9–5.7) and revealed six patients with detected ctDNA, in addition to the eight patient samples detected without size selection. c Plot showing distribution of tMAD scores across DIAMOND plasma (no size selection), urine supernatant (USN), and urine cell pellet (UCP) samples. Samples from the same patient are connected by gray lines. The detection threshold is indicated by a red dashed line. d tMAD and e z-score distribution of RCC samples were compared to samples from other cancer types collected at the University of Cambridge [19] and Medical University of Graz respectively. Renal samples are highlighted. GBM = glioblastoma, Mel = melanoma, ChC = cholangiocarcinoma, CRC = colorectal cancer. A similar comparison was carried out using the ichorCNA metric (Additional file 1: Fig. S7C)
Fig. 3
Fig. 3
ctDNA detection using targeted assays. a Application of INVAR-TAPAS to DIAMOND plasma samples. ctDNA was detected in plasma of 12/22 (54.5%) patients, with global ctDNA mAF (gmAF) shown on the y-axis. Disease subtype is indicated by bar color, see insert for figure legend. b Assessment of the correlation between primary tumor size (diameter, cm), and ctDNA detection. Detection was via tMAD and/or INVAR-TAPAS, and in either fluid. This observation was driven by plasma (Additional file 1: Fig. S11A) with no apparent relationship in urine (Additional file 1: Fig. S11B). c ctDNA detection in plasma by INVAR-TAPAS was significantly more frequent amongst patients with venous tumor thrombus as compared to those without. This was not the case when considering ctDNA in urine or ctDNA in either fluid (Additional file 1: Fig. S12A-C). d INVAR-TAPAS was applied to DIAMOND USN samples. ctDNA was detected in 7/14 (50%) patients. e Comparison of gmAF of plasma and USN samples. In patients for whom we had access to both fluids, lines connect data points (Spearman’s rho = 0.28, p = 0.3). f Summary of targeted sequence analysis using a 10-gene QIASeq panel. Mutations at baseline were detected in 8/43 (18.6%) MonReC plasma samples. The y-axis denotes mAF which ranged from 3.5 × 10−2–0.15 (if two or more mutations were detected, the mean was calculated)
Fig. 4
Fig. 4
Summary of ctDNA detection in all patients and all biofluids. a Summary of ctDNA detection in baseline plasma (left of triangle box pair) and urine (right of pair) of DIAMOND ccRCC (left), chRCC (top right), and oncocytoma (oncoC, middle right) patients. Four patients with “other” disease subtypes are also shown (“other,” bottom right). Samples are ranked in descending order according to tumor size (cm). For each data point, the upper left triangle shows the results of INVAR-TAPAS analysis and the bottom right the results of tMAD analysis. Green triangles indicate samples in which ctDNA was detected, white triangles indicate samples in which ctDNA was not detected, gray triangles indicate no data available (because the assay was not applied to that sample, or no sample was available), and pink triangles indicate failed assay. Data points with a black outline indicate patients with metastatic disease at the time of sampling. DIAMOND patients 5842 and 5634 (longitudinal section) are highlighted with an orange box. b Summary of ctDNA detection in baseline (left of triangle box pair) and follow-up (right of pair) plasma of MonReC patients. Each subtype is shown in a separate box (ccRCC, clear cell; pRCC, papillary; chRCC, chromophobe; NA, unknown). The upper left triangle shows the results of QIASeq analysis, the bottom right the results of ichorCNA analysis. Triangle color, as above. Forty-one patients had metastatic disease and, where data was available, the number of metastatic sites is indicated. ctDNA detection are plotted alongside patient characteristics in Additional file 1: Fig. S15
Fig. 5
Fig. 5
Longitudinal ctDNA analysis and assessment of intratumoral heterogeneity in plasma and urine. a Longitudinal cfDNA assessment of MonReC patients with metastatic RCC. Shown are disease courses of patients who had detected ctDNA with QIASeq and/or ichorCNA analysis. Time between nephrectomy and first blood draw is indicated in days (NA, not available; NN, no nephrectomy). Type and duration of treatment (mTOR = mTOR inhibitor; PAZ = pazopanib, SUN = sunitinib; EVE = everolimus; CAB = cabozantinib; AXI = axitinib; SOR = sorafenib; IMT = immune therapy) are indicated by colored lines. Most patients had detected ctDNA at progression (PD), whereas during stable disease (SD) or response (partial response, PR) ctDNA was undetected. b, c Plots demonstrating dynamic changes in ctDNA in longitudinal plasma from MonReC patients K27 and K39 respectively. Further details and patient specific plots are in Additional file 1: Fig. S17. d tMAD (left y-axis) and INVAR-TAPAS (right) analysis of plasma taken throughout the clinical course of DIAMOND patient 5842. Following nephrectomy (scan a; orange arrow = right renal tumor, red arrow = tumor thrombus), while INVAR-TAPAS global ctDNA levels (black line) drop, it remains detected (gmAF = 9.5 × 10–4) at day 53, indicating residual disease. Conversely, imaging did not detect residual disease at day 16 (b; normal renal fossa). ctDNA levels rise with disease spread, before falling again upon the commencement of radio- and chemotherapy. Of note, ctDNA levels continue to fall despite evidence of clinical progression. Further details are provided in Additional file 1: Fig. S18A-B. tMAD values before (blue line) and after (red line, gray circles = detected ctDNA) size selection are shown. Urine data are shown in Additional file 1: Fig. S18C. e Comparison of baseline ctDNA mAF in plasma (red) and USN (blue) and the number of tumor regions that mutation was observed in after multi-region sampling of 5842. *indicates significant difference as compared to mutations detected in just one region. f Heatmap of mutations detected across 10 tumor biopsies (T1–T9 = fresh frozen, A7 = FFPE) and baseline fluid samples from 5842, with vertical colored lines indicating individual SNVs. Hierarchical clustering was by mutation according to Euclidean distance. Color intensity corresponds to mutation mAF. While mutations show different representation in pre-surgery fluids (Additional file 1: Fig. S23), all mutation clusters, even those private to individual regions, are represented by at least one mutation in plasma and urine (Additional file 1: Fig. S24)

References

    1. CRUKstatistics: https://www.cancerresearchuk.org/health-professional/cancer-statistics/s.....
    1. Gerlinger M, Rowan AJ, Horswell S, Math M, Larkin J, Endesfelder D, Gronroos E, Martinez P, Matthews N, Stewart A, et al. Intratumor heterogeneity and branched evolution revealed by multiregion sequencing. N Engl J Med. 2012;366(10):883–892. doi: 10.1056/NEJMoa1113205. - DOI - PMC - PubMed
    1. Stewart GD, O'Mahony FC, Laird A, Eory L, Lubbock AL, Mackay A, Nanda J, O'Donnell M, Mullen P, McNeill SA, et al. Sunitinib treatment exacerbates intratumoral heterogeneity in metastatic renal cancer. Clin Cancer Res. 2015;21(18):4212–4223. doi: 10.1158/1078-0432.CCR-15-0207. - DOI - PubMed
    1. Turajlic S, Xu H, Litchfield K, Rowan A, Chambers T, Lopez JI, Nicol D, O'Brien T, Larkin J, Horswell S, et al. Tracking cancer evolution reveals constrained routes to metastases: TRACERx renal. Cell. 2018;173(3):581–594. doi: 10.1016/j.cell.2018.03.057. - DOI - PMC - PubMed
    1. Yong E. Cancer biomarkers: written in blood. Nature. 2014;511(7511):524–526. doi: 10.1038/511524a. - DOI - PubMed

Publication types