. 2020 Mar;99(3):1663-1677.
doi: 10.1016/j.psj.2019.11.028. Epub 2020 Jan 22.

Intestinal inflammation induced by dextran sodium sulphate causes liver inflammation and lipid metabolism disfunction in laying hens

Affiliations

Intestinal inflammation induced by dextran sodium sulphate causes liver inflammation and lipid metabolism disfunction in laying hens

T Nii et al. Poult Sci. 2020 Mar.

Abstract

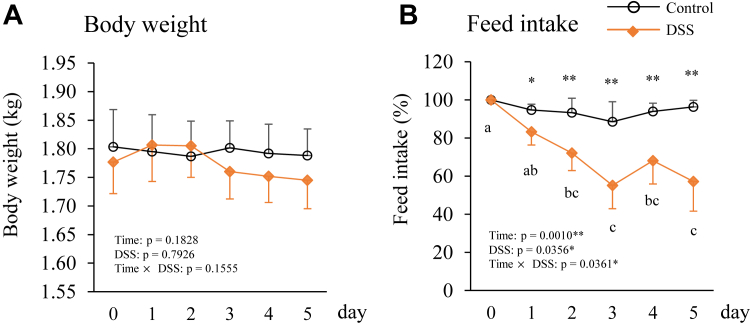
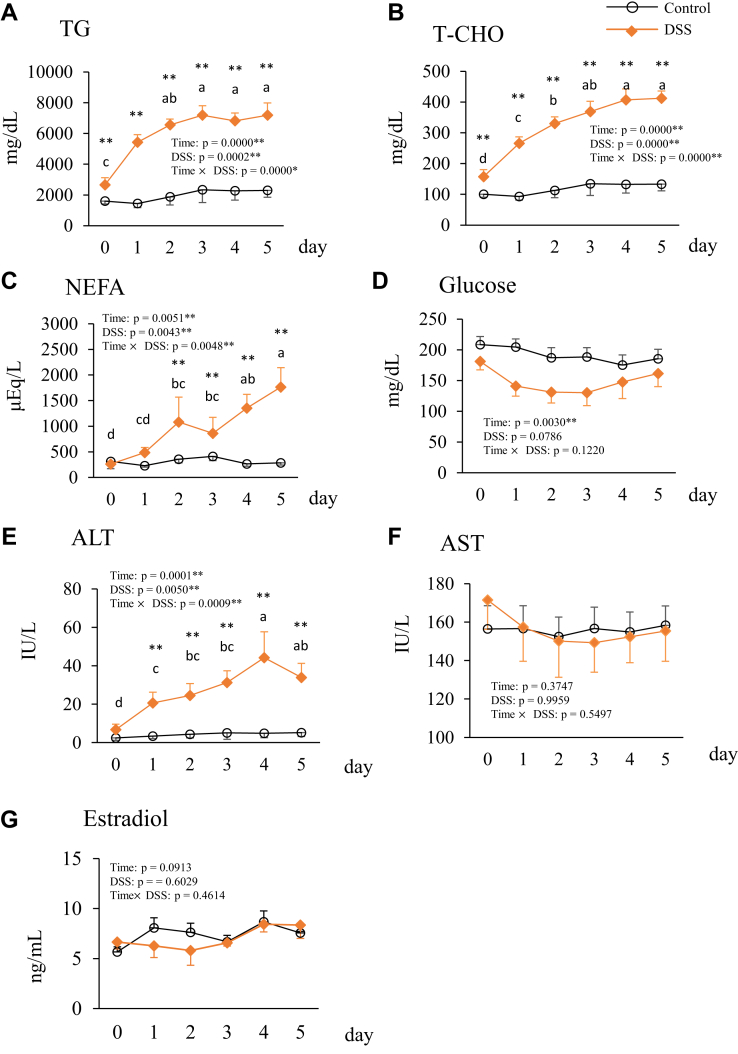
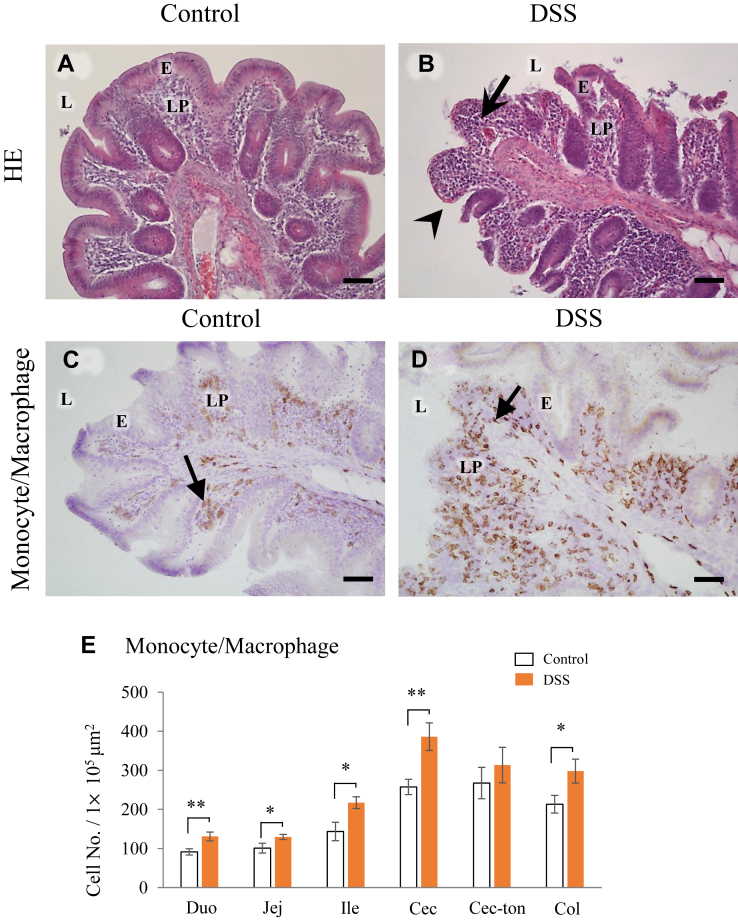
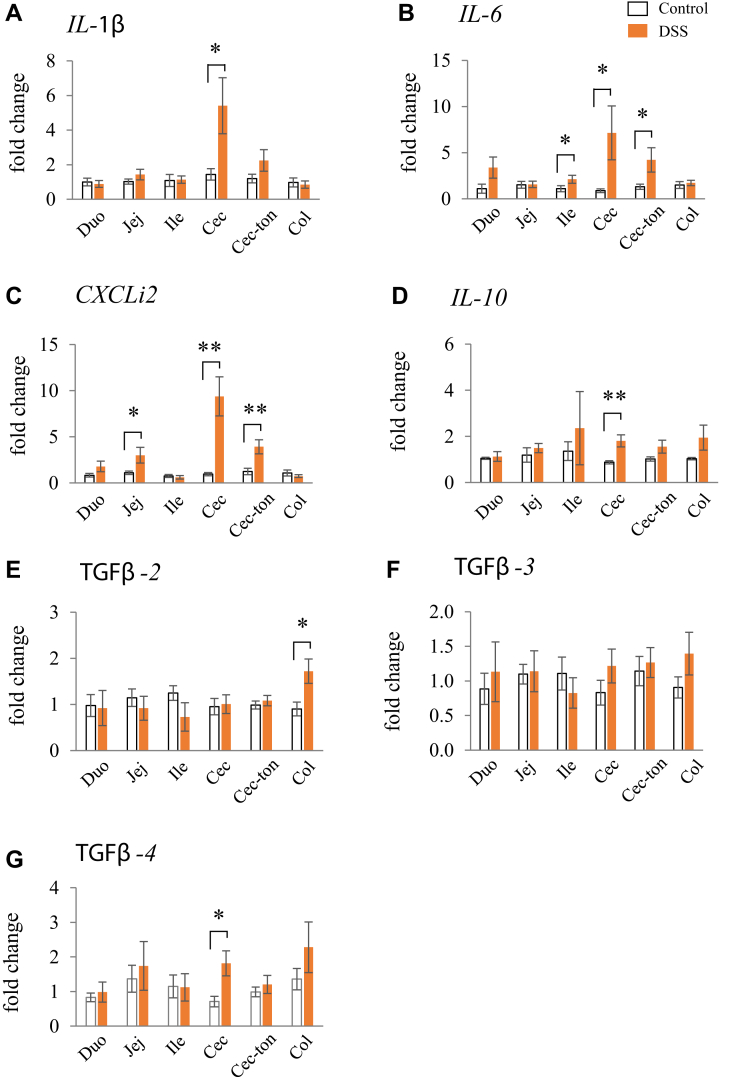
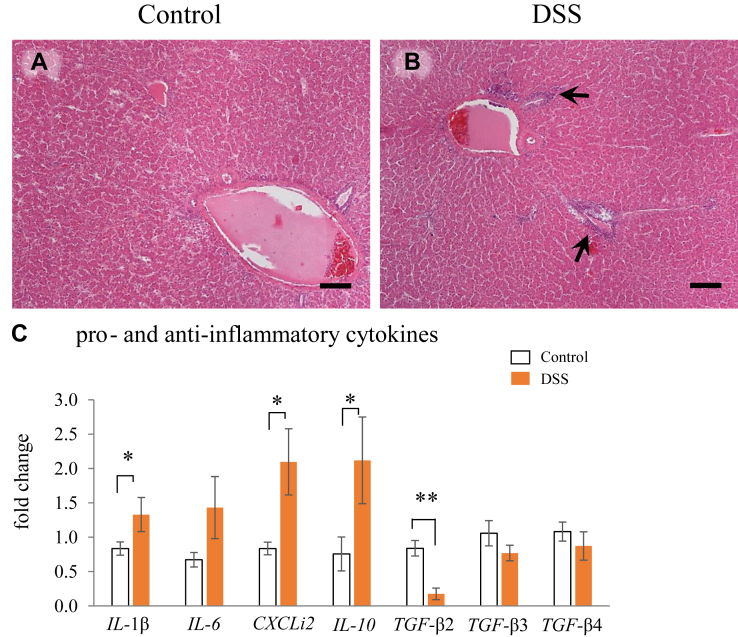
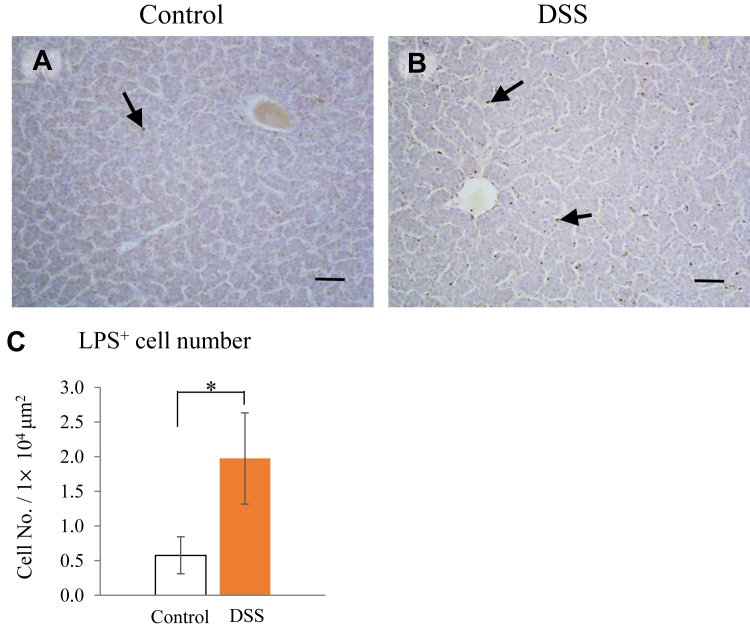
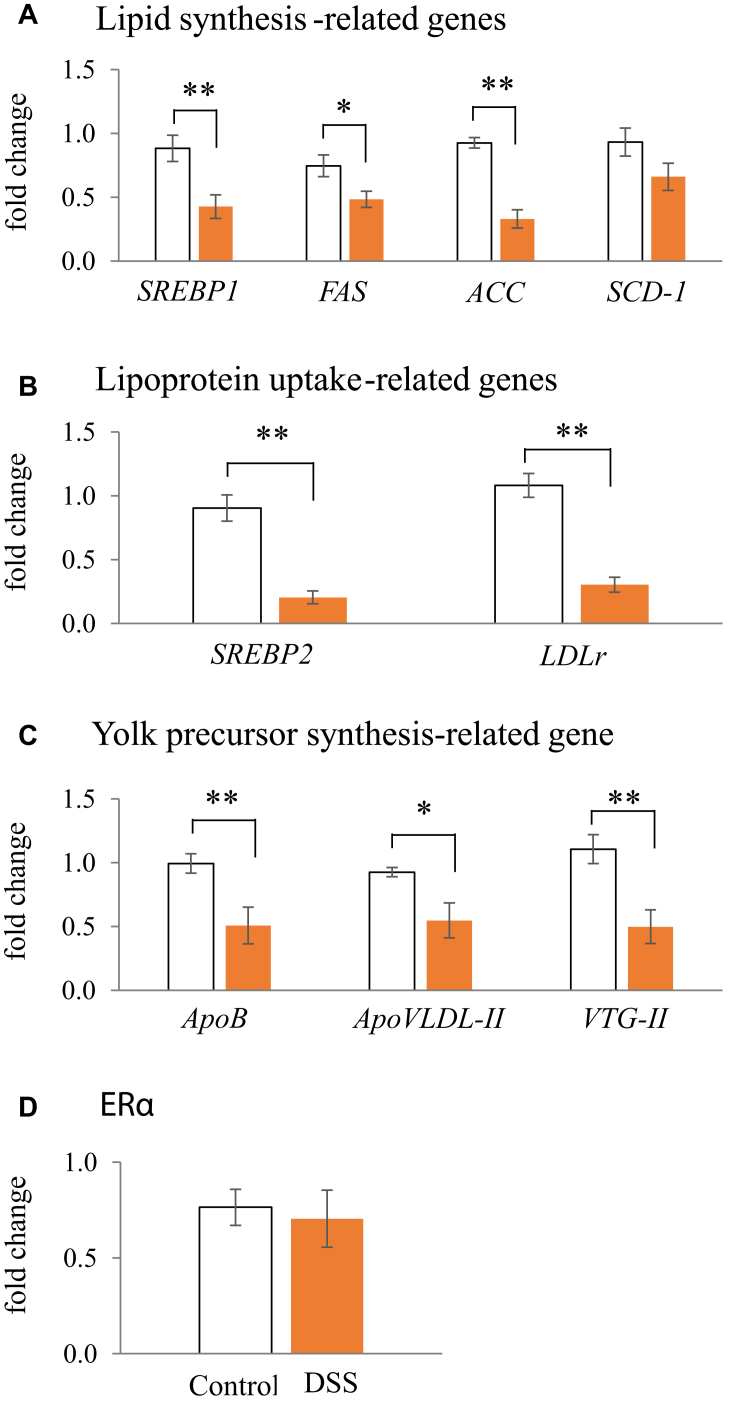
Gut inflammation caused by various factors including microbial infection leads to disorder of absorption of dietary nutrients and decrease in egg production in laying hens. We hypothesized that intestinal inflammation may affect egg production in laying hens through its impact on liver function. Dextran sodium sulphate (DSS) is known to induce intestinal inflammation in mammals, but whether it also induces inflammation in laying hens is not known. The goal of this study was to assess whether oral administration of DSS is a useful model of intestinal inflammation in laying hens and to characterize the effects of intestinal inflammation on egg production using this model. White Leghorn hens (350-day old) were administrated with or without 0.9 g of DSS/kg BW in drinking water for 5 D (n = 8, each). All laid eggs were collected, and their whole and eggshell weights were recorded. Blood was collected every day and used for biochemical analysis. Liver and intestinal tissues (duodenum, jejunum, ileum, cecum, cecal-tonsil, and colon) were collected 1 D after the final treatment. These tissue samples were used for histological analysis and PCR analysis. Oral administration of DSS in laying hens caused 1) histological disintegration of the cecal mucosal epithelium and increased monocyte/macrophage infiltration and IL-1β, IL-6, CXCLi2, IL-10, and TGFβ-4 gene expression; 2) decreased egg production; 3) increased leukocyte infiltration and IL-1β, CXCLi2, and IL-10 expression in association with a high frequency of lipopolysaccharide-positive cells in the liver; and 4) decreased expression of genes related to lipid synthesis, lipoprotein uptake, and yolk precursor production. These results suggested that oral administration of DSS is a useful method for inducing intestinal inflammation in laying hens, and intestinal inflammation may reduce egg production by disrupting egg yolk precursor production in association with liver inflammation.

Keywords: dextran sodium sulphate; egg production; egg yolk precursor; intestinal inflammation; liver inflammation.


Figures

Figure 1
Figure 1
Changes in body weight (A) and feed intake (B) during the experimental period in hens orally administered with dextran sodium sulphate (DSS group) or water (control group). Body weight and feed intake were measured at the same time every day. The open circle plots are the control group, and the orange rhombus plots are the DSS group. The body weights are presented as the measured value (kg) (A), and feed intake is presented as rate of change from the value on day 0 (as a percentage) ± SEM (n = 8) (B). Double asterisks (**) indicate significant differences between the control and DSS groups (P < 0.01). Lowercase superscript letters indicate significant differences among time points (P < 0.05).
Figure 2
Figure 2
Changes in the blood plasma parameters triglyceride (TG; A), total cholesterol (T-CHO; B), nonesterified fatty acid (NEFA; C), glucose (D), alanine aminotransferase (ALT) (E), aspartate aminotransferase (AST; F), and estradiol-17β (G) during the experimental period in hens administered with dextran sodium sulphate (DSS group) or water (control group). Open circle plots are the control group, and the orange rhombus plots are the DSS group. Values are the mean ± SEM (n = 8). Asterisks (*, **) indicate significant differences between the control and DSS groups at the same time point (P < 0.05 and P < 0.01, respectively). Lower case letters indicate significant differences between time points (P < 0.05).
Figure 3
Figure 3
Micrographs showing the histology of the cecum in hens orally administered with dextran sodium sulphate (DSS group) or water (control group), and the effects of DSS on the localization of monocytes/macrophages in intestinal tissues. The cecum of hens in the control (A) and DSS (B) groups. Hematoxylin-Eosin (HE) staining. Leukocytes are distributed in the lamina propria in the cecum of hens in the DSS group (arrows). The luminal epithelial cells of the cecum in the DSS group had disintegrated or were lost (arrow head). Frozen sections of the cecum of hens in the control (C) and DSS (D) groups stained with an antimonocyte/macrophage antibody. Monocytes/macrophages are in the lamina propria (triangle arrows) in all sections (data not shown). E = mucosal epithelium; L = lumen; LP = lamina propria. Scale bars = 50 μm. (E) Frequencies of monocytes/macrophages in the lamina propria of all intestinal segments. Open bars are the control group, and orange filled bars are the DSS group. Values are the number of monocytes/macrophages in an area of 1 × 105 μm2 (n = 8). Asterisks (*, **) indicate significant differences between the control and DSS groups (P < 0.05 and P < 0.01, respectively).
Figure 4
Figure 4
Effects of dextran sodium sulphate (DSS) on the mRNA expression of proinflammatory (A, B and C) and anti-inflammatory (D, E, F and G) cytokines in the mucosal tissues of the duodenum, jejunum, ileum, cecum, cecal-tonsil, and colon. Open bars are the control group, and orange filled bars are the DSS group. Values are the fold change in target gene expression compared with a standard duodenum sample from the control group (n = 8). Target gene expression was normalized to the house-keeping gene RPS17. Asterisks (*, **) indicate significant differences between the water (control) and DSS-treated groups (P < 0.05 and P < 0.01, respectively).
Figure 5
Figure 5
Effects of oral administration of dextran sodium sulphate (DSS) on hepatic inflammation in hens. (A and B) Micrographs showing the histology of the livers of hens treated with water (A; control group) and DSS (B; DSS group). Leukocytes were mainly localized around the veins and arteria in the liver in the DSS group (arrows). Hematoxylin-Eosin (HE) staining. Scale bars = 50 μm. Effects of oral administration of DSS on the mRNA expression of proinflammatory and anti-inflammatory cytokines (C). Open bars are the control group, and orange filled bars are the DSS group. Values are the fold change in the target gene expression compared to that in a standard sample from the control group (n = 8). Target gene expression is normalized to the house-keeping gene RPS17. Asterisks (*, **) indicate significant difference between the control and DSS groups (P < 0.05 and P < 0.01, respectively).
Figure 6
Figure 6
Effects of dextran sodium sulphate (DSS) administration on the localization of lipopolysaccharide (LPS)+ cells in the liver. (A and B) Paraffin sections of the livers from hens in the control (A) and DSS (B) groups stained with an anti-LPS antibody. LPS+ cells are in the connective tissue surrounding the vessels (arrows). Scale bars = 50 μm. (C) Frequencies of LPS+ cells in the liver. Open bars are the control group, and orange filled bars are the DSS group. Values are the number of LPS+ cells in a 1 × 104 μm2 area (n = 8). An asterisk (*) indicates a significant difference between the water (control) and DSS groups (P < 0.05).
Figure 7
Figure 7
Effects of dextran sodium sulphate (DSS) on the mRNA expression of lipid synthesis–related genes (A), lipoprotein uptake–related genes (B), yolk precursor–related genes (C), and estrogen receptor (D) in the liver of hens. Open bars are the control group, and orange filled bars are the DSS group. Values are the fold change in the target gene expression as compared to that in a standard sample from the control group (n = 8). Target gene expression is normalized to the house-keeping gene RPS17. Asterisks (*, **) indicate significant differences between the water (control) and DSS groups (P < 0.05 and P < 0.01, respectively).

References

    1. Alvarenga R.R., Zangeronimo M.G., Pereira L.J., Rodrigues P.B., Gomide E.M. Lipoprotein metabolism in poultry. World Poult. Sci. J. 2011;67:431–440.
    1. Araki Y., Sugihara H., Hattori T. In vitro effects of dextran sulfate sodium on a Caco-2 cell line and plausible mechanisms for dextran sulfate sodium-induced colitis. Oncol. Rep. 2006;16:1357–1362. - PubMed
    1. Babyatsky M.W., Rossiter G., Podolsky D.K. Expression of transforming growth factors alpha and beta in colonic mucosa in inflammatory bowel disease. Gastroenterology. 1996;110:975–984. - PubMed
    1. Banerjee A., Bizzaro D., Burra P., Di Liddo R., Pathak S., Arcidiacono D., Cappon A., Bo P., Conconi M.T., Crescenzi M., Pinna C.M., Parnigotto P.P., Alison M.R., Sturniolo G.C., D'Inca R., Russo F.P. Umbilical cord mesenchymal stem cells modulate dextran sulfate sodium induced acute colitis in immunodeficient mice. Stem Cell Res. Ther. 2015;6:79. - PMC - PubMed
    1. Barker K.A., Hampe A., Stoeckle M.Y., Hanafusa H. Transformation-associated cytokine 9E3/CEF4 is chemotactic for chicken peripheral blood mononuclear cells. J. Virol. 1993;67:3528–3533. - PMC - PubMed

Substances