. 2020 May;32(5):1519-1535.
doi: 10.1105/tpc.19.00455. Epub 2020 Feb 28.

SHORTROOT-Mediated Intercellular Signals Coordinate Phloem Development in Arabidopsis Roots

Affiliations

SHORTROOT-Mediated Intercellular Signals Coordinate Phloem Development in Arabidopsis Roots

Hyoujin Kim et al. Plant Cell. 2020 May.

Abstract

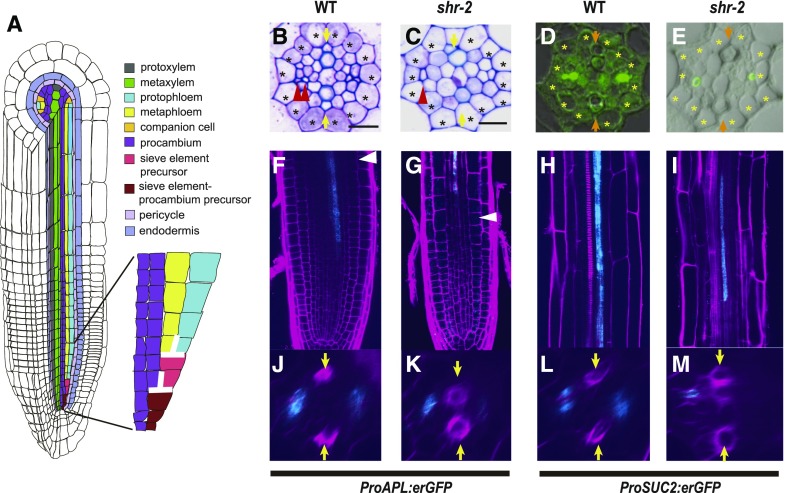
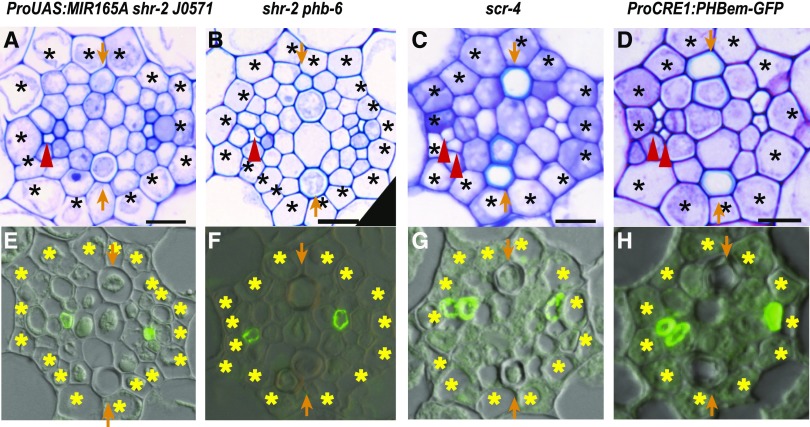
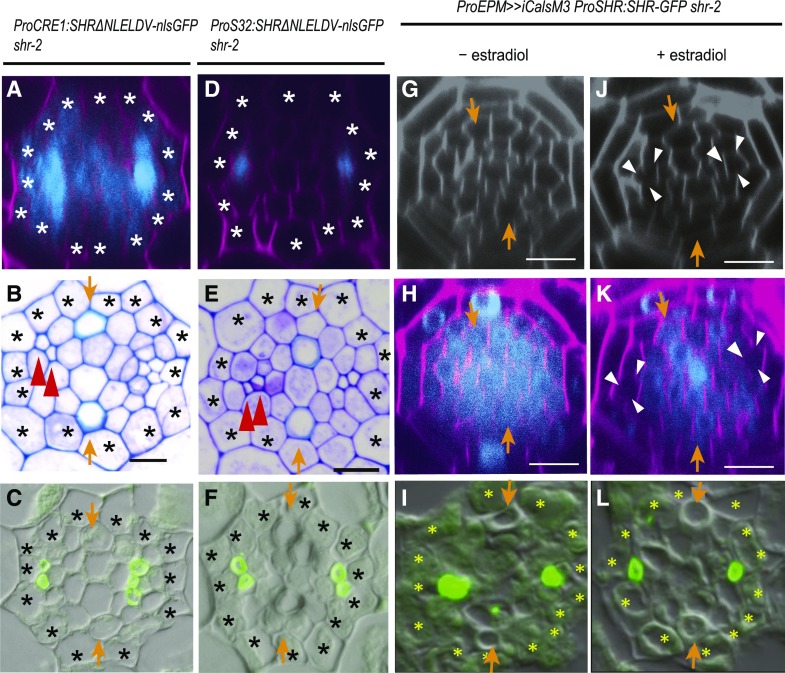
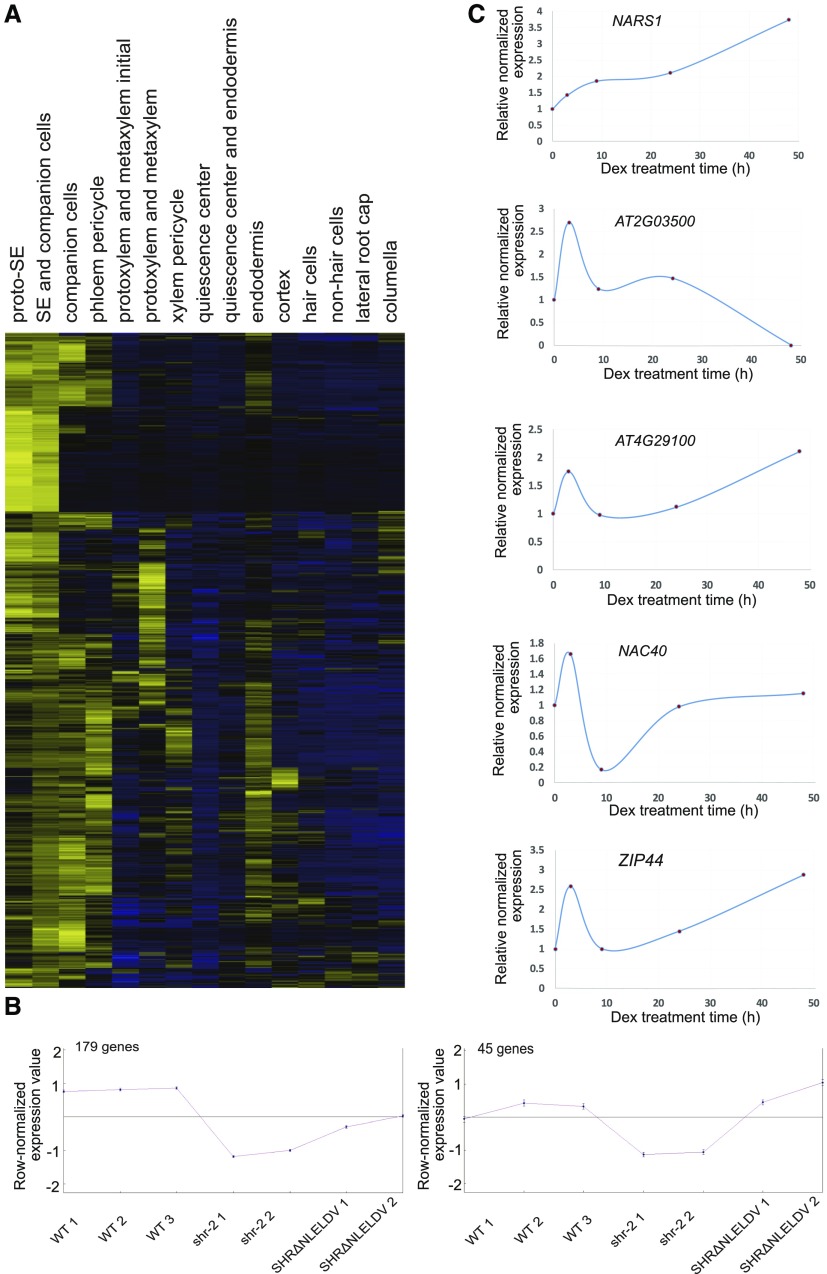
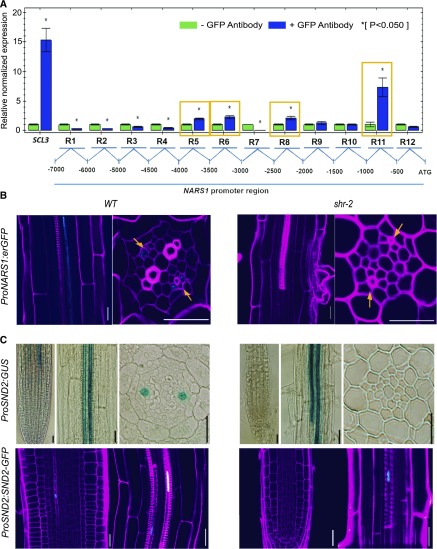
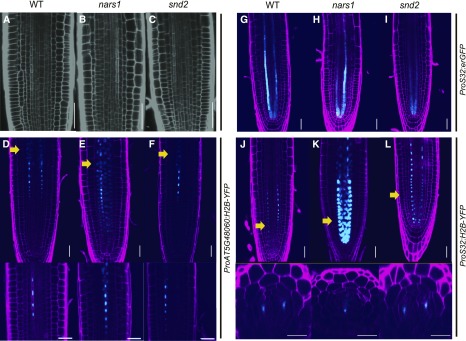
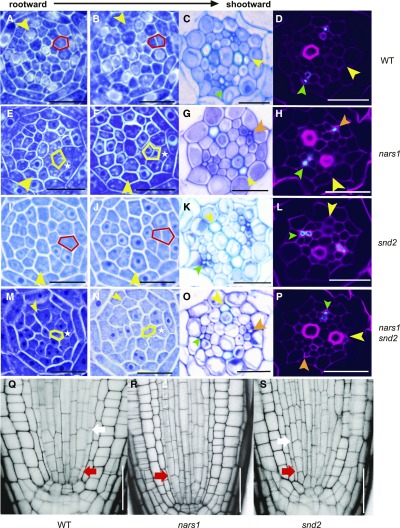
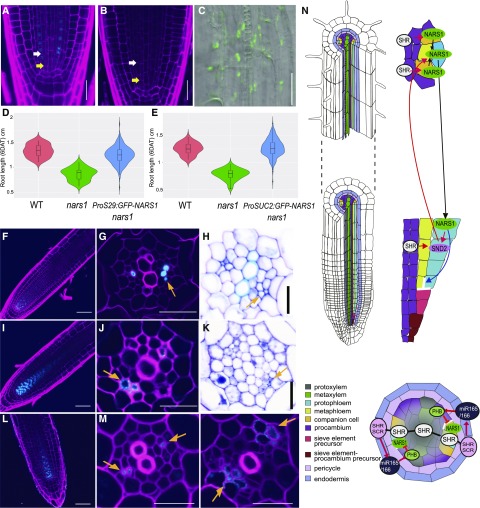
Asymmetric cell division (ACD) and positional signals play critical roles in the tissue patterning process. In the Arabidopsis (Arabidopsis thaliana) root meristem, two major phloem cell types arise via ACDs of distinct origins: one for companion cells (CCs) and the other for proto- and metaphloem sieve elements (SEs). The molecular mechanisms underlying each of these processes have been reported; however, how these are coordinated has remained elusive. Here, we report a new phloem development process coordinated via the SHORTROOT (SHR) transcription factor in Arabidopsis. The movement of SHR into the endodermis regulates the ACD for CC formation by activating microRNA165/6, while SHR moving into the phloem regulates the ACD generating the two phloem SEs. In the phloem, SHR sequentially activates NAC-REGULATED SEED MORPHOLOGY 1 (NARS1) and SECONDARY WALL-ASSOCIATED NAC DOMAIN PROTEIN 2 (SND2), and these three together form a positive feedforward loop. Under this regulatory scheme, NARS1, generated in the CCs of the root differentiation zone, establishes a top-down signal that drives the ACD for phloem SEs in the meristem. SND2 appears to function downstream to amplify NARS1 via positive feedback. This new regulatory mechanism expands our understanding of the sophisticated vascular tissue patterning processes occurring during postembryonic root development.plantcell;32/5/1519/FX1F1fx1.


Figures

Figure 1.
Figure 1.
SHR Regulates Phloem Development in the Arabidopsis Root. (A) A schematic diagram showing the Arabidopsis root anatomy and asymmetric cell divisions of two precursor cells for phloem sieve element formation, as indicated by the flipped T shape in white. Comparison of phloem development between wild-type and shr-2 roots. (B) and (C) Transverse sections through the maturation zones of wild-type (B) and shr-2 (C) roots, stained with toluidine blue. Scale bar = 10 μm. Asterisks, pericycle position; arrows, xylem axis; red arrowheads, sieve elements. WT, wild type. (D) and (E) Immunolocalization of the SE-ENOD in wild-type (D) and shr-2 (E) roots. Asterisks, pericycle position; arrows, xylem axis. WT, wild type. (F) to (M) Expression of of two representative phloem markers. ProAPL:erGFP in the wild type ([F] and [J]) and shr-2 ([G] and [K]), and expression of ProSUC2:erGFP in wild type ([H] and [L]) and shr-2 ([I] and [M]). Arrows, xylem axis; red arrowheads, sieve elements; white arrowheads, beginning of the transition zone of the root. WT, wild type.
Figure 2.
Figure 2.
PHABULOSA Suppresses Procambial Cell Divisions for Companion Cell Development. Toluidine blue–stained transverse sections and immunolabeled SE-ENOD of ProUAS:MIR165A shr J0571 ([A] and [E]), shr-2 phb-6 ([B] and [F]), scr-4 ([C] and [G]) and ProCRE1:PHBem-GFP ([D] and [H]) are shown. Scale bar = 10 µm; asterisks, pericycle position; arrows, xylem axis; arrow heads, SEs.
Figure 3.
Figure 3.
SHR Movement into the Phloem Pole Is Required for Asymmetric Cell Divisions for Sieve Element Development. (A) to (L) Confocal cross sections of the root meristematic zone of ProCRE1:SHRΔNLELDV-nlsGFP shr-2 (A) and ProS32:SHRΔNLELDV-nlsGFP shr-2 (D) show the GFP signal indicating the expression pattern of the nonmobile SHR protein. Toluidine blue–stained transverse sections and immunolocalization of the SE-ENOD of ProCRE1:SHRΔNLELDV-nlsGFP shr-2 ([B] and [C]) and ProS32:SHRΔNLELDV-nlsGFP shr-2 ([E] and [F]) are shown. Confocal cross sections of the root meristematic zone and immunolocalization of the SE-ENOD of ProEPM>>iCalsM3 ProSHR:SHR-GFP shr-2 ([G] to [L]) are also shown. (G) to (I) Without an estradiol treatment, SHR movement and SE development are normal. (J) to (L) Images taken 2 d after a treatment with 10 µM of estradiol. The phloem pole, indicated by white arrowheads, does not show SHR-GFP. Scale bar = 10 µm; asterisks, pericycle position; arrows, xylem axis; arrowheads, SEs.
Figure 4.
Figure 4.
Genome-Wide Meta-Analysis and Time-Course Induction Experiments Identify Phloem-Enriched Transcription Factors Downstream of SHR. (A) Root expression of genes that are enriched in the phloem cell types. (B) Centroid graphs of two QT clusters for which phloem-enriched genes under the regulation of SHR in the stele were identified. (C) Time-course expression changes of putative direct target genes of SHR in the ProSHR:SHR-GR shr-2 line in response to different Dex treatment durations.
Figure 5.
Figure 5.
SHR Regulates NARS1 and SND2 Expression in the Phloem. (A) ChIP real-time qPCR analysis for testing the direct binding of SHR to the NARS1 promoter. A ChIP was performed in roots of 5-DAT ProSHR:SHR-GFP shr-2 seedlings. SCL3 is a positive control. (B) Expression pattern of NARS1 in the wild type (WT) Col-0 (left) and shr-2 (right). (C) Expression pattern of SND2 in the wild type Col-0 (left) and shr-2 (right). The transcriptional expression pattern of SND2 was visualized with the GUS system (ProSND2:GUS). The expression of the translational GFP fusion system, ProSND2:SND2-GFP, shows a pattern identical to that of transcriptional fusion in the wild type. Scale bar = 20 μm.
Figure 6.
Figure 6.
Analysis of Protophloem Lineage and Differentiation in the Wild Type, nars1, and snd2. (A) to (C) Protophloem differentiation in the root meristem, visualized by propidium iodide staining of the wild type (WT) (A), nars1 (B), and snd2 (C). (D) to (F) Nucleus morphologies in the protophloem cell files, visualized with ProAT5G48060:H2B-YFP for the WT (D), nars1 (E), and snd2 (F). The elongating protophloem undergoing nuclear lysis is marked by the yellow arrow (top) and is magnified (bottom). No noticeable difference in the timing of nuclear lysis is found. (G) to (I) ProS32:erGFP expressed in WT (G), nars1 (H), and snd2 (I). (J) to (L) Cell lineage analysis of the phloem pole using H2B-YFP expressed under the S32 promoter in the WT (J), nars1 (K), and snd2 (L). H2B-GFP is found broadly in the meristem zone of nars1, indicating a change in the division patterns of cells in the early phloem lineage. Cross sections of meristems of three genotypes on the regions marked with yellow arrows (bottom). Scale bar = 20 μm.
Figure 7.
Figure 7.
Analysis of Cell Division Patterns for Phloem Sieve Element Development in the Wild Type, nars1 and snd2. (A) to (P) Analysis of division patterns of phloem SE precursors in the roots of the wild type (WT; [A] to [D]), nars1 ([E] to [H]), snd2 ([I] and [L]) and the nars1 snd2 double mutant ([M] to [P]). Analysis of cell division patterns using consecutive cross-sections in WT ([A] and [B]), nars1 ([E] and [F]), snd2 ([I] and [J]) and snd2 nars1 double mutant ([M] and [N]) and resulting cell organization in the root differentiation zone ([C], [G], [K] and [O]). SE-ENOD immunolocalization shows two differentiated phloem SEs in WT (D) and snd2 (L) but only one in nars1 (H) and nars1 snd2 (P). (Q) to (S) Confocal images of wild-type (Q), nars1 (R), and snd2 (S) root meristems. Phloem precursor cells in the wild type and snd2 divide twice, whereas that in nars1 divides only once. Yellow arrowhead, xylem axis; green arrowhead, pole with two phloem SEs; orange arrowhead, pole with one phloem SE; red arrow, ACD of the procambium-phloem initial; white arrow, ACD of the phloem SE initial; Scale bar = 20 μm.
Figure 8.
Figure 8.
Functional Analysis of NARS1 as a Potential Top-Down Signal for Asymmetric Cell Divisions of Sieve Element Precursors and a Proposed Molecular Model. (A) to (C) Analysis of the division recovery of phloem SE precursors in the roots of ProS29:GFP-NARS1 nars1 (A) and ProSUC2:GFP-NARS1 nars1 ([B] and [C]). (D) and (E) Analysis of the root length recovery process of ProS29:GFP-NARS1 nars1 [three independent homozygous T3 lines (n = 263), wild type (WT; n = 32) and nars1 (n = 50); (D)] and ProSUC2:GFP-NARS1 nars1 (three independent homozygous T3 lines [n = 256], WT [n = 35] and nars1 [n = 50]; [E]). (F) to (H) Transgenic roots expressing ProCRE1:GFP-NARS1 Col-0. (I) to (K) Transgenic roots expressing ProCRE1:SND2-GFP Col-0. (L) and (M) Transgenic roots expressing ProCRE1:GFP-NARS1 shr-2. Longitudinal views of the root meristem expressing GFP-NARS1 (F, L) and SND2-GFP (I) are shown. (G), (J), and (M) SE-ENOD immunolocalization. (H) and (K) Toluidine blue staining. (N) Proposed model of phloem development initiated by SHR in Arabidopsis roots. The regulatory scheme shown on the longitudinal axis illustrates the positive feedforward regulatory loop composed of SHR, NARS1, and SND2 and the positive feedback regulation between NARS1 and SND2. In the cross section, the repression of NARS1 by PHB is shown. Red arrow, gene regulation; black arrow, intercellular movement. In (A) and (B), yellow arrows indicate the ACDs of procambium-phloem SE precursors, and white arrows indicate the ACDs of phloem SE precursors. Orange arrows in (G), (H), (J), (K), and (M) indicate ectopic phloem SEs. Scale bar = 20 μm.
None

Comment in

References

    1. Abrash E.B., Bergmann D.C.(2009). Asymmetric cell divisions: a view from plant development. Dev. Cell 16: 783–796. - PubMed
    1. Baum S.F., Dubrovsky J.G., Rost T.L.(2002). Apical organization and maturation of the cortex and vascular cylinder in Arabidopsis thaliana (Brassicaceae) roots. Am. J. Bot. 89: 908–920. - PubMed
    1. Berger F., Haseloff J., Schiefelbein J., Dolan L.(1998). Positional information in root epidermis is defined during embryogenesis and acts in domains with strict boundaries. Curr. Biol. 8: 421–430. - PubMed
    1. Birnbaum K., Jung J.W., Wang J.Y., Lambert G.M., Hirst J.A., Galbraith D.W., Benfey P.N.(2005). Cell type-specific expression profiling in plants via cell sorting of protoplasts from fluorescent reporter lines. Nat. Methods 2: 615–619. - PubMed
    1. Blob B., Heo J.O., Helariutta Y.(2018). Phloem differentiation: An integrative model for cell specification. J. Plant Res. 131: 31–36. - PMC - PubMed

Publication types

MeSH terms