. 2020 Sep 4;295(36):12822-12839.
doi: 10.1074/jbc.RA120.012601. Epub 2020 Feb 28.

The tetraspanin Tspan15 is an essential subunit of an ADAM10 scissor complex

Affiliations

The tetraspanin Tspan15 is an essential subunit of an ADAM10 scissor complex

Chek Ziu Koo et al. J Biol Chem. .

Abstract

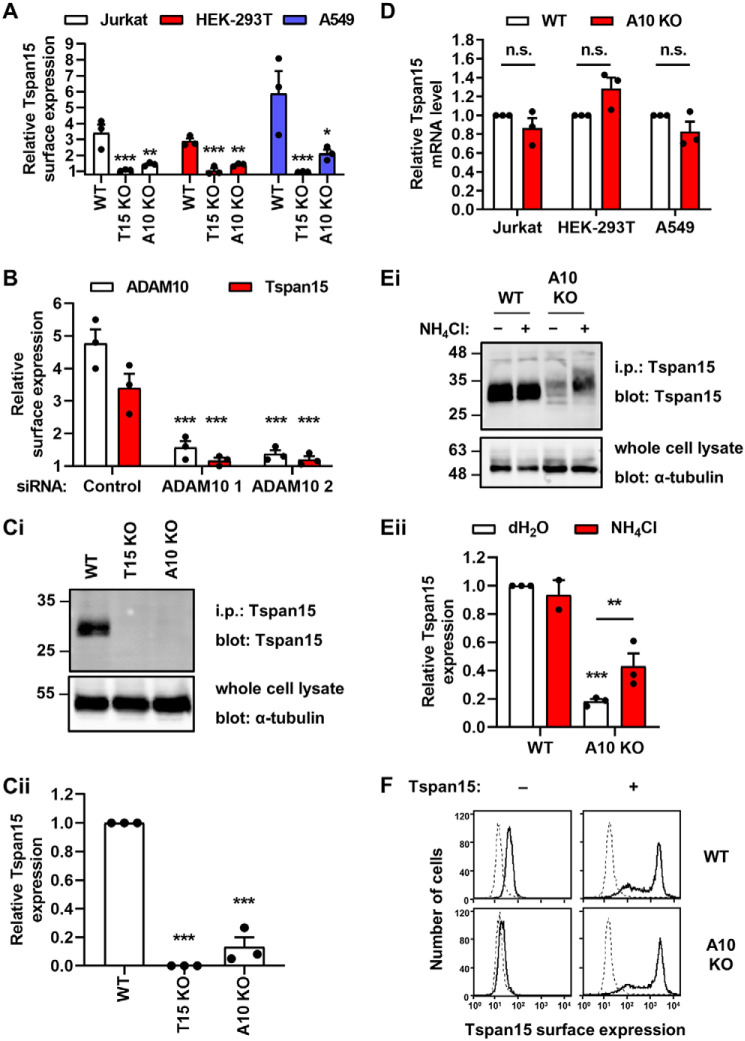
A disintegrin and metalloprotease 10 (ADAM10) is a transmembrane protein essential for embryonic development, and its dysregulation underlies disorders such as cancer, Alzheimer's disease, and inflammation. ADAM10 is a "molecular scissor" that proteolytically cleaves the extracellular region from >100 substrates, including Notch, amyloid precursor protein, cadherins, growth factors, and chemokines. ADAM10 has been recently proposed to function as six distinct scissors with different substrates, depending on its association with one of six regulatory tetraspanins, termed TspanC8s. However, it remains unclear to what degree ADAM10 function critically depends on a TspanC8 partner, and a lack of monoclonal antibodies specific for most TspanC8s has hindered investigation of this question. To address this knowledge gap, here we designed an immunogen to generate the first monoclonal antibodies targeting Tspan15, a model TspanC8. The immunogen was created in an ADAM10-knockout mouse cell line stably overexpressing human Tspan15, because we hypothesized that expression in this cell line would expose epitopes that are normally blocked by ADAM10. Following immunization of mice, this immunogen strategy generated four Tspan15 antibodies. Using these antibodies, we show that endogenous Tspan15 and ADAM10 co-localize on the cell surface, that ADAM10 is the principal Tspan15-interacting protein, that endogenous Tspan15 expression requires ADAM10 in cell lines and primary cells, and that a synthetic ADAM10/Tspan15 fusion protein is a functional scissor. Furthermore, two of the four antibodies impaired ADAM10/Tspan15 activity. These findings suggest that Tspan15 directly interacts with ADAM10 in a functional scissor complex.

Keywords: ADAM; ADAM10; Tspan14; Tspan15; a disintegrin and metalloprotease; membrane protein; metalloproteinase; molecular cell biology; monoclonal antibody; shedding; tetraspanin.


Conflict of interest statement

The authors declare that they have no conflicts of interest with the contents of this article

Figures

Figure 1.
Figure 1.
Generation of human Tspan15-expressing MEFs as an immunogen and validation of resulting mouse anti-human Tspan15 mAbs. A, ADAM10-knockout MEFs (−) and ADAM10-knockout MEFs stably overexpressing FLAG-tagged Tspan15 (+) were lysed in 1% Triton X-100 lysis buffer and subjected to anti-FLAG (top) and anti-α-tubulin (bottom) Western blotting. B, WT and Tspan15-KO Jurkat human T cells were analyzed by flow cytometry with tissue culture supernatant for each of the four mouse anti-human Tspan15 hybridomas (1C12, 4A4, 5D4, or 5F4; solid line) or with mouse IgG1 as a negative control (dotted line). Histograms are representative of two independent experiments. C, HEK-293T cells were transfected with FLAG-tagged human TspanC8 expression constructs (except for Tspan10, which was of mouse origin) or an empty vector control (−), lysed in 1% Triton X-100 lysis buffer and Western blotted with tissue culture supernatants for each of the four Tspan15 hybridomas, or a positive control FLAG antibody. Blots are representative of three independent experiments. D, human platelets were lysed in 1% digitonin lysis buffer and subjected to immunoprecipitation (i.p.) with the four Tspan15 mAbs or a negative control mouse IgG1, followed by anti-ADAM10 and anti-Tspan15 (5D4) Western blotting (top panels). The faint additional band in the 5F4 lane corresponds to light chain from the immunoprecipitating mAb (data not shown). To quantitate the data, the amount of ADAM10 co-immunoprecipitated was normalized to the amount of immunoprecipitated Tspan15 with each antibody (bottom). Error bars, S.E. from three independent experiments.
Figure 2.
Figure 2.
The four Tspan15 mAbs bind to similar epitopes in the large extracellular loop. A, Tspan15-knockout HEK-293T cells were transfected with GFP-tagged Tspan5 with the large extracellular loop of Tspan15 (T5-LEL15) or the reciprocal chimeric expression construct (T15-LEL5). Cells were stained with the four Tspan15 mAbs (1C12, 4A4, 5D4, or 5F4), Tspan5 mAb (TS5-2), or negative control mouse IgG1, followed by allophycocyanin-conjugated anti-mouse antibody and flow cytometry analyses. B, A549 cells were preincubated with one of the four unlabeled Tspan15 mAbs or MOPC-21 negative control mouse IgG1 for 30 min and stained with Alexa Fluor® 647–conjugated Tspan15 mAbs. Antibody binding, relative to unstained cells, was quantitated by flow cytometry. Data were log-transformed and statistically analyzed by a two-way ANOVA with Tukey's multiple-comparison test. Error bars, S.E. from three independent experiments (***, p < 0.001 for control compared with each of the mAb preincubations). C, amino acid sequence alignment of the C-terminal half of human (h) and mouse (m) Tspan15 large extracellular loop region with Clustal Omega (61). Sequence differences are shown in red, and sequences exchanged in the four mutant constructs are indicated by horizontal lines above the line-up. D, Tspan15-knockout HEK-293T cells were transfected with FLAG-tagged human Tspan15, mouse Tspan15, four chimeric constructs with human Tspan15 residues replaced by corresponding mouse residues, a chimeric construct comprising mouse Tspan15 with three residues of the corresponding human sequence, or an empty vector control (−). Cells were lysed in 1% Triton X-100 lysis buffer and subjected to anti-Tspan15 or anti-FLAG Western blotting. Data are representative of three experiments, from which quantitation demonstrated no significant detection of mouse Tspan15 or the FSV to LNA and reciprocal chimera (data not shown). E, predicted structure of human Tspan15, showing the location of epitopes recognized by Tspan15 mAbs (olive) and other residues that differ from mouse Tspan15 (magenta) in the extracellular region (cyan).
Figure 3.
Figure 3.
Tspan15 mAbs 1C12 and 4A4 partially inhibit ADAM10/Tspan15 activity. Ai, WT, ADAM10-knockout (A10 KO), and Tspan15-knockout (T15 KO) HEK-293T cells were transfected with a VE-cadherin expression construct. Cells were treated with 10 μm DAPT to prevent post-ADAM10 proteolysis by γ-secretase, followed by 2 mm NEM for 30 min to activate ADAM10. Cells were lysed in 1% Triton X-100 lysis buffer and subjected to Western blotting with an antibody against the cytoplasmic tail of VE-cadherin. No C-terminal fragment was detected in the absence of NEM (data not shown). Aii, VE-cadherin cleavage data were quantitated to calculate the percentage cleaved. Data were arcsine-transformed and statistically analyzed by a one-way ANOVA with a Dunnett's multiple-comparison test (***, p < 0.001 compared with WT). Error bars, S.E. from three independent experiments. B, WT HEK-293T cells were transfected with VE-cadherin, treated with Tspan15 mAbs or MOPC-21 negative control mAb for 30 min, and stimulated with NEM as described for A. The cleavage of VE-cadherin was detected by Western blotting and quantitated as described in A for mAbs 1C12 (Bi), 4A4 (Bii), 5D4 (Biii), and 5F4 (Biv). Error bars, S.E. from three independent experiments (*, p < 0.05; ***, p < 0.001 compared with controls).
Figure 4.
Figure 4.
Tspan15 and ADAM10 co-localize on the cell surface. Ai, A549 cells were fixed and stained with anti-ADAM10 mAb (red) and either anti-Tspan15 mAb 5D4 (green) or anti-CD9 mAb 1AA2 (green). ADAM10, Tspan15, and CD9 on the basal membrane were imaged using TIRF microscopy. Images shown are representative of 48 fields of view from four independent experiments (scale bar, 10 μm). Aii, the degree of co-localization between ADAM10 and Tspan15 or CD9 was determined using Manders' coefficients to measure the proportion of overlapping pixels contained within total ADAM10 signal in the red channel (M1) and total Tspan15 or CD9 signal in the green channel (M2). Data were arcsine-transformed and statistically analyzed by a one-way ANOVA with Tukey's multiple-comparison test to compare M1 and M2, within and between Tspan15 and CD9 (***, p < 0.001 for all pairwise comparisons). Error bars, S.E.
Figure 5.
Figure 5.
ADAM10 is the principal Tspan15-interacting protein in HEK-293T cells. WT and Tspan15-KO HEK-293T cells were lysed in 1% digitonin lysis buffer and immunoprecipitated with Tspan15 mAb 1C12 cross-linked to protein G–Sepharose beads. Proteins were identified by LC-MS/MS. Proteomic profiles of WT and Tspan15-KO HEK-293T immunoprecipitates are presented in a volcano plot to identify differentially expressed proteins. The minus log10-transformed p value of each protein was plotted against the log2-transformed protein label-free quantification ratio between the Tspan15 co-immunoprecipitation of WT samples and the control co-immunoprecipitation of Tspan15-KO samples. Proteins with significant -fold change (p < 0.05) are depicted in red; blue dots represent proteins with no significant changes in expression. A permutation-based false discovery rate estimation was applied and visualized as hyperbolic curves in gray.
Figure 6.
Figure 6.
Tspan15 protein expression requires ADAM10. A, Tspan15 surface expression in WT, Tspan15-KO and ADAM10-KO Jurkat, HEK-293T, and A549 cell lines were analyzed by flow cytometry with anti-Tspan15 mAb 1C12 or mouse IgG1 negative control antibody. Tspan15 surface expression is presented as the geometric mean fluorescence intensity of Tspan15 staining relative to the control staining. Error bars, S.E. from three independent experiments. Data were log-transformed and statistically analyzed by a one-way ANOVA with Dunnett's multiple-comparison test (*, p < 0.05; **, p < 0.01; ***, p < 0.001 compared with WT). B, HUVECs were transfected with two different ADAM10 siRNAs or a negative control siRNA, and surface expression of ADAM10 and Tspan15 was measured by flow cytometry and analyzed as described in A. Ci, WT, Tspan15-KO and ADAM10-KO Jurkat cells were lysed in 1% Triton X-100 lysis buffer, immunoprecipitated with anti-Tspan15 mAb 5D4, and Western blotted with the same antibody. Whole-cell lysates were blotted with anti-α-tubulin mAb. Cii, Tspan15 levels from Ci were quantitated and normalized to WT expression. Error bars, S.E. from three independent experiments. Data were log-transformed and statistically analyzed by a one-way ANOVA with Tukey's multiple-comparison test (***, p < 0.001 compared with WT). D, Tspan15 mRNA level in WT and ADAM10-KO Jurkat, HEK-293T, and A549 cells were assessed by qRT-PCR and presented relative to GAPDH housekeeping gene expression. Error bars, S.E. from three independent experiments. Data were log-transformed and statistically analyzed by a two-way ANOVA followed by Tukey's multiple-comparison test (n.s., not significant). Ei, WT and ADAM10-KO A549 cells were treated with 50 mm ammonium chloride lysosomal inhibitor or vehicle control for 20 h. Cells were lysed in 1% Triton X-100 lysis buffer, and Tspan15 immunoprecipitates and whole-cell lysates were Western blotted as described in Ci. Eii, Tspan15 levels from Ei were quantitated, normalized against tubulin levels, and presented relative to WT expression. Data were log-transformed and statistically analyzed by a two-way ANOVA with Tukey's multiple-comparison test (**, p < 0.01; ***, p < 0.001 compared with WT). Error bars, S.E. from three independent experiments, except for WT cells treated with ammonium chloride, which were from two experiments. F, WT and ADAM10-KO HEK-293T cells were transfected with empty vector control (−) or Tspan15 (+) expression constructs. Tspan15 surface expression was measured by flow cytometry as described in A. Histograms are representative of four independent experiments.
Figure 7.
Figure 7.
The requirement of Tspan15 for ADAM10 surface expression is cell type–dependent. A, ADAM10 surface expression in WT, ADAM10-KO and Tspan15-KO Jurkat, HEK-293T, and A549 cells was measured by flow cytometry and quantitated as described in Fig. 4A. B, HUVECs were transfected with two different Tspan15 siRNAs or negative control siRNA, and surface expression of ADAM10 was measured by flow cytometry and analyzed as described in Fig. 6A.
Figure 8.
Figure 8.
ADAM10 and Tspan15 form dynamic BiFC complexes. A, schematic representation of ADAM10 tagged with the C-terminal half of sfGFP (sfGFP-C), Tspan15 tagged with the N-terminal half of sfGFP (sfGFP-N), and the predicted ADAM10/Tspan15 BiFC dimer. Solid ovals, N-glycosylation. B, HEK-293T cells were transfected with the ADAM10 and Tspan15 BiFC expression constructs, fixed, and stained with Alexa Fluor® 647–conjugated Tspan15 mAb 5D4 and analyzed by confocal microscopy. The image shown is representative of middle plane sections taken from two independent experiments (scale bar, 10 μm). C and D, FCS measurements from the upper membrane of HEK-293T expressing the ADAM10/Tspan15 BiFC complexes were used to determine the average particle concentration (C) and diffusion coefficient (D) of the complexes. E, fluorescence fluctuations from the FCS reads were also subjected to PCH analysis to obtain the average molecular brightness (ϵ) of particles within the confocal volume. The FCS data were separated into groups that preferentially fit to a one-component or a two-component PCH model with dimmer and brighter subcomponents. Data were obtained from 43 individual measurements from three independent experiments. Error bars, S.E.; N, number of particles; cpm, counts per molecule. Data were log-transformed and statistically analyzed by a one-way ANOVA followed by Tukey's multiple-comparison test (***, p < 0.001).
Figure 9.
Figure 9.
A synthetic ADAM10/Tspan15 fusion protein is a functional scissor. A, schematic representation of the synthetic ADAM10/Tspan15 fusion protein that has the C terminus of ADAM10 physically linked to the N terminus of Tspan15. Solid ovals, N-glycosylation. B, ADAM10/Tspan15 double-KO HEK-293T cells were transfected with the ADAM10/Tspan15 fusion construct, lysed in 1% digitonin lysis buffer in the presence of 10 μm ADAM10 inhibitor GI254023X, to prevent post-lysis autoproteolysis, and Western blotted for ADAM10 and Tspan15. C, cells described in B were assessed for surface expression of Tspan15 (green) and ADAM10 (red) by flow cytometry. Black traces represent isotype control staining. D, ADAM10/Tspan15 double-KO HEK-293T cells were transfected with the indicated expression constructs and analyzed by confocal microscopy using anti-ADAM10 (green) and Tspan15 (red) mAbs. The cells were nonpermeabilized, and images are maximum intensity projections of confocal z-stacks. Scale bar (top left image), 30 μm. Ei, ADAM10/Tspan15 double-KO HEK-293T cells were co-transfected with alkaline phosphatase–tagged betacellulin (BTC) and Tspan15, ADAM10, ADAM10 and Tspan15, the ADAM10/Tspan15 fusion, or an empty vector control. Cells were stimulated with 2 mm NEM or vehicle control, and alkaline phosphatase activity was measured in the supernatant and whole-cell lysates to quantitate the percentage of BTC shed. Data were arcsine-transformed and statistically analyzed with a two-way ANOVA followed by Tukey's multiple-comparison test (***, p < 0.001 compared with empty vector-transfected control). Eii, transfected cells were assessed for surface expression of ADAM10 by flow cytometry, and the data were quantitated and analyzed using a paired t test (*, p < 0.05).

References

    1. Lichtenthaler S. F., Lemberg M. K., and Fluhrer R. (2018) Proteolytic ectodomain shedding of membrane proteins in mammals-hardware, concepts, and recent developments. EMBO J. 37, 10.15252/embj.201899456 - DOI - PMC - PubMed
    1. Wetzel S., Seipold L., and Saftig P. (2017) The metalloproteinase ADAM10: a useful therapeutic target? Biochim. Biophys. Acta Mol. Cell Res. 1864, 2071–2081 10.1016/j.bbamcr.2017.06.005 - DOI - PubMed
    1. Termini C. M., and Gillette J. M. (2017) Tetraspanins function as regulators of cellular signaling. Front. Cell Dev. Biol. 5, 34 10.3389/fcell.2017.00034 - DOI - PMC - PubMed
    1. van Deventer S. J., Dunlock V. E., and van Spriel A. B. (2017) Molecular interactions shaping the tetraspanin web. Biochem. Soc. Trans. 45, 741–750 10.1042/BST20160284 - DOI - PubMed
    1. Zimmerman B., Kelly B., McMillan B. J., Seegar T. C. M., Dror R. O., Kruse A. C., and Blacklow S. C. (2016) Crystal structure of a full-length human tetraspanin reveals a cholesterol-binding pocket. Cell 167, 1041–1051.e11 10.1016/j.cell.2016.09.056 - DOI - PMC - PubMed

Publication types

Associated data