. 2020 Feb 28;11(2):154.
doi: 10.1038/s41419-020-2348-9.

Pharmacological LRH-1/Nr5a2 inhibition limits pro-inflammatory cytokine production in macrophages and associated experimental hepatitis

Affiliations

Pharmacological LRH-1/Nr5a2 inhibition limits pro-inflammatory cytokine production in macrophages and associated experimental hepatitis

Juliane Schwaderer et al. Cell Death Dis. .

Abstract

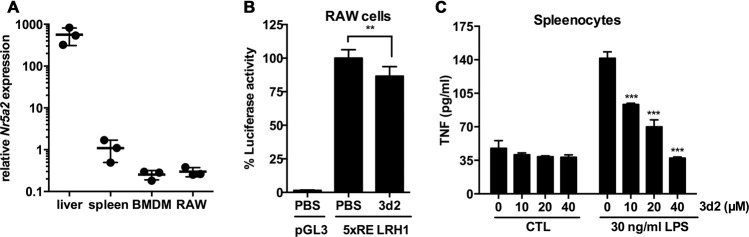
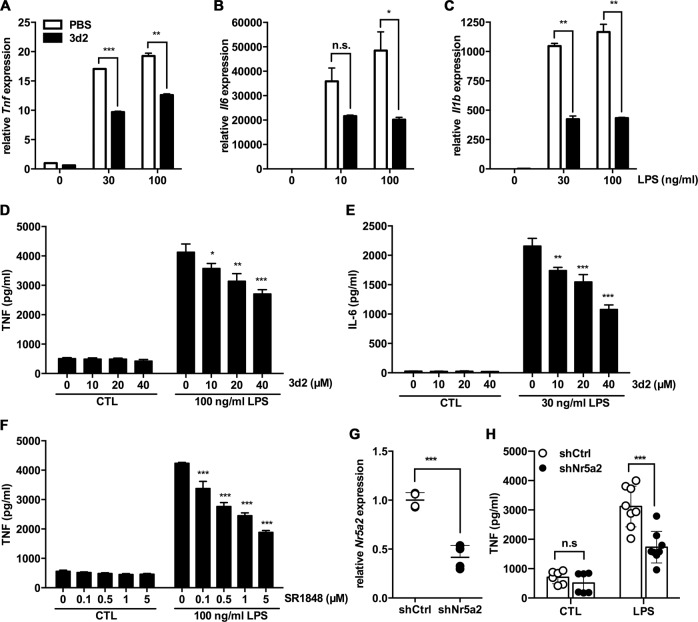
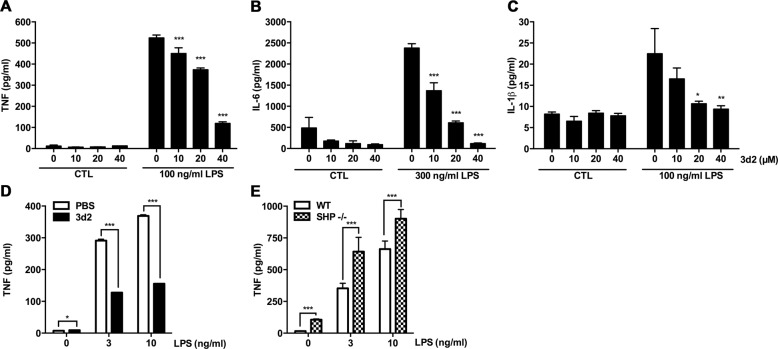
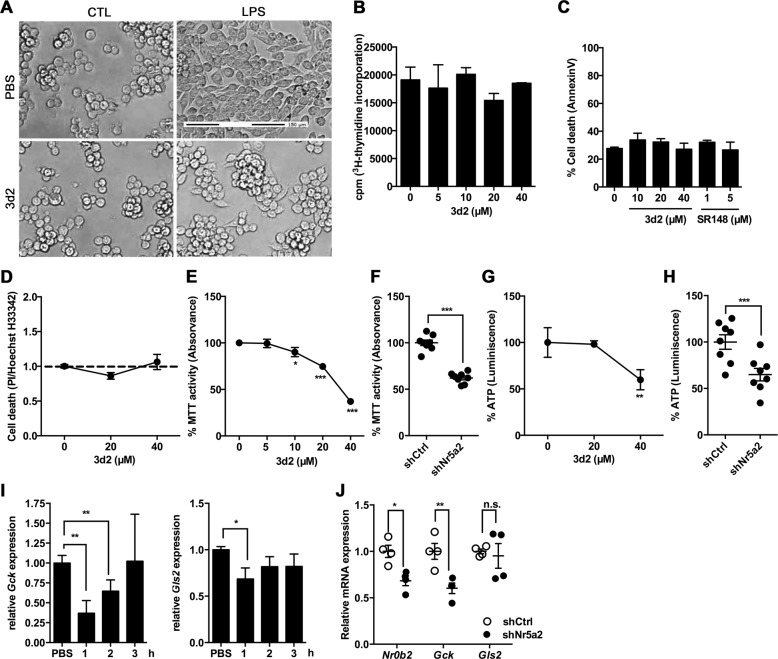
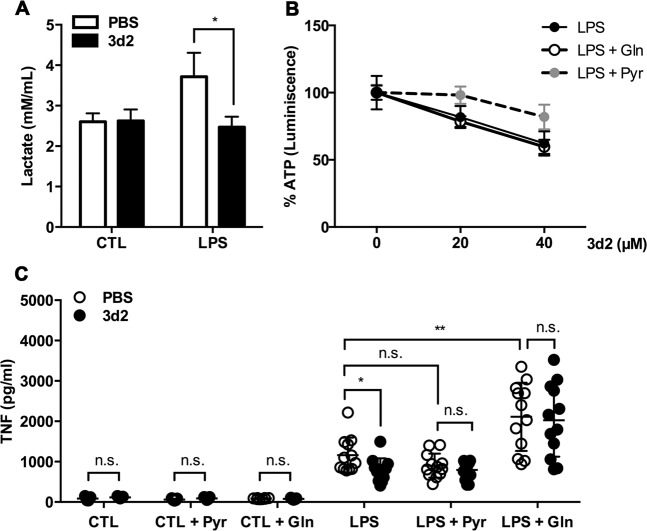
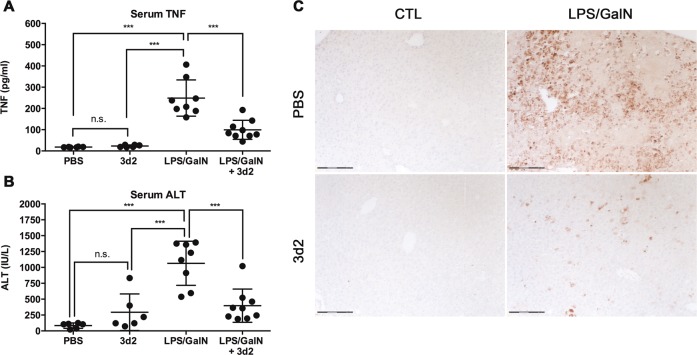
Liver receptor homolog-1 (LRH-1, Nr5a2) is an orphan nuclear receptor mainly expressed in tissues of endodermal origin, where its physiological role has been extensively studied. LRH-1 has been implicated in liver cell differentiation and proliferation, as well as glucose, lipid, and bile acid metabolism. In addition, increasing evidence highlights its role in immunoregulatory processes via glucocorticoid synthesis in the intestinal epithelium. Although the direct function of LRH-1 in immune cells is fairly elucidated, a role of LRH-1 in the regulation of macrophage differentiation has been recently reported. In this study, we aimed to investigate the role of LRH-1 in the regulation of pro-inflammatory cytokine production in macrophages. Our data demonstrate that pharmacological inhibition, along with LRH-1 knockdown, significantly reduced the lipopolysaccharide (LPS)-induced production of pro-inflammatory cytokines in the macrophage line RAW 264.7 cells, as well as in primary murine macrophages. This inhibitory effect was found to be independent of defects of LRH-1-regulated cell proliferation or toxic effects of the LRH-1 inhibitors. In contrast, LRH-1 inhibition reduced the mitochondrial ATP production and metabolism of macrophages through downregulation of the LRH-1 targets glucokinase and glutminase-2, and thus impairing the LPS-induced macrophage activation. Interestingly, in vivo pharmacological inhibition of LRH-1 also resulted in reduced tumor necrosis factor (TNF) production and associated decreased liver damage in a macrophage- and TNF-dependent mouse model of hepatitis. Noteworthy, despite hepatocytes expressing high levels of LRH-1, pharmacological inhibition of LRH-1 per se did not cause any obvious liver damage. Therefore, this study proposes LRH-1 as an emerging therapeutic target in the treatment of inflammatory disorders, especially where macrophages and cytokines critically decide the extent of inflammation.


Conflict of interest statement

The authors declare that they have no conflict of interest.

Figures

Fig. 1
Fig. 1. LRH-1 expression and activity in macrophages.
a Relative Nr5a2 mRNA expression in the liver, spleen, and bone marrow-derived macrophages (BMDM) from wild-type C57BL/6 mice, as well as in the macrophage cell line RAW 264.7 (RAW). Results are shown as relative to murine Gapdh mRNA expression. Mean values (bars) and individual data points from three mice, resp. cell samples, per group are shown. b Endogenous LRH-1-dependent transcriptional activity in RAW 264.7 cells. Cells were transfected with the LRH-1 luciferase reporter construct (5 × RE LRH-1) or an empty luciferase reporter (pGL3) and treated with vehicle (PBS) or 3d2 (40 μM). Mean values of triplicates ± SD of two independent experiments are shown. Luciferase activity was normalized to untreated cells (t test; **p < 0.01). c TNF protein levels measured in the supernatant of splenocytes from wild-type C57BL/6 mice and pre-treated for 2 h with indicated concentrations of 3d2, prior to stimulation with control buffer (CTL) or LPS (30 ng/ml). Mean values of triplicates ± SD of a representative experiment (n = 3) are shown (one-way ANOVA, ***p < 0.001).
Fig. 2
Fig. 2. LRH-1 inhibition reduces the pro-inflammatory cytokine production in LPS-stimulated RAW 264.7 cells.
mRNA expression levels of a Tnf, b Il6, and c Il1b in RAW 264.7 cells pre-treated for 2 h with vehicle (PBS) or 3d2 (40 μM) and subsequently stimulated with control buffer (CTL) or LPS at indicated concentrations for 18 h. Results are shown as relative to murine Gapdh mRNA expression. Mean values of triplicates ± SD of three independent experiments are shown (t test; **p < 0.01, ***p < 0.001). d TNF and e IL-6 secreted levels in the supernatant of RAW 264.7 cells pre-treated with indicated concentrations of 3d2 for 2 h and subsequently stimulated with control buffer (CTL) or LPS at indicated concentrations for 18 h. f TNF secreted levels in the supernatant of RAW 264.7 cells pre-treated for 2 h with SR1848 at indicated concentrations, prior to stimulation with control buffer (CTL) or LPS at indicated concentrations for 18 h. Mean values of triplicates ± SD of a representative experiment (n = 3) are shown (one-way ANOVA, *p < 0.05, **p < 0.01, ***p < 0.001). g Quantification of mRNA levels of Nr5a2 in RAW 264.7 cells transduced with shRNA against Nr5a2 (shNr5a2) or shRNA control (shCtrl). Data are shown as relative to murine Actb mRNA and expressed as fold change to shCtrl cells. h TNF produced in RAW 264.7 cells transduced with shNr5a2 or shCtrl control and subsequent treated with control buffer (CTL) or LPS (30 ng/mL) for 18 h. Dots show technical replicates and bars means ± SD of data pooled from two independent experiment (two-way ANOVA, *p < 0.05, **p < 0.01, ***p < 0.001, n.s., not significant).
Fig. 3
Fig. 3. LRH-1 regulates the pro-inflammatory cytokine production in LPS-stimulated bone marrow-derived macrophages and Kupffer cells.
a TNF, b IL-6, and c IL-1β secreted protein levels in the supernatant of bone marrow-derived macrophages (BMDMs) pre-treated for 2 h with vehicle (PBS) or 3d2 (40 μM) and subsequently stimulated with control buffer (CTL) or LPS at indicated concentrations for 18 h. Mean values of triplicates ± SD of a representative experiment (n = 3) are shown (one-way ANOVA *p < 0.05, **p < 0.01, ***p < 0.001). d TNF protein levels in the supernatant of isolated Kupffer cells from wild-type C57BL/6 mice after 2 h pre-treatment with vehicle (PBS) or 3d2 (40 μM) and subsequently stimulated for 18 h with LPS at indicated concentrations. Mean values of triplicates ± SD of one representative experiment (n = 3) are shown (t test; *p < 0.05, ***p < 0.001). e TNF protein levels in the supernatant of BMDMs generated from wild-type C57BL/6 (WT) or SHP-deficient (SHP−/−) mice and stimulated for 18 h with LPS at indicated concentrations. Mean values of triplicates ± SD of a representative experiment (n = 3) are shown (t test; *p < 0.05, ***p < 0.001).
Fig. 4
Fig. 4. LRH-1 inhibition reduces mitochondrial activity in RAW 264.7 cells.
a Representative microscopy images of RAW 264.7 cells pre-incubated for 2 h with 3d2 (40 μM) or vehicle (PBS), prior to stimulation with control buffer (CTL) or LPS (30 ng/ml) for 18 h (scale bar: 150 μm). b [3H]thymidine incorporation as representative of proliferation rate of RAW 264.7 cells after treatment with 3d2 at indicated concentrations. Results shown as radioactive-dependent scintillation counts per minute (c.p.m.). c Cell death analysis (AnnexinV staining) in 3d2- or SR1840-treated cells. d Cell death detection by propidium iodide (PI):Hoechst dye (H33342) ratio in 3d2-treated RAW 264.7 cells. Values have been normalized to untreated cells (dashed line). Mean values of triplicates ± SD of a representative experiment (n = 3) are shown. e MTT assay analysis of the general mitochondrial activity and g ATP levels in RAW 264.7 cells after overnight treatment with 3d2 at the indicated concentrations. Results are shown as normalized data to the untreated control. Mean values of triplicates ± SD of a representative experiment (n = 3) are shown (one-way ANOVA ***p < 0.001). f MTT assay analysis and h ATP levels in RAW 264.7 cells transduced with shRNA against Nr5a2 (shNr5a2) or shRNA control (shCtrl), and shown as relative to untargeted controls (shCtrl). Technical replicates ± SD of a representative experiment (n = 3) are shown (t test, ***p < 0.001). i mRNA expression levels of Gck and Gls in RAW 264.7 cells after treatment with vehicle (PBS) or 3d2 (40 μM) at indicated time points. j mRNA levels of Nr0b2 (SHP), Gck, and Gls2 in RAW 264.7 cells transduced with shRNA against Nr5a2 (shNr5a2) or shRNA control (shCtrl). Results are shown as relative to murine βactin mRNA expression and normalized to untreated or untargeted controls. i Mean values of triplicates or j technical replicates ± SD of two independent experiments are shown (one-way ANOVA (i) or t test (j), *p < 0.05, **p < 0.01, n.s. = not significant).
Fig. 5
Fig. 5. LRH-1 inhibition limits glycolysis and glutaminolysis in RAW 264.7 cells.
a Lactate produced in RAW 264.7 cells supernatant after 2 h pre-treatment with 3d2 (40 μM) or control buffer (PBS), and subsequently stimulated with control buffer (CTL) or LPS (30 ng/ml) for 18 h. Mean values of triplicates ± SD of a representative experiment (n = 2) are shown (t test; *p < 0.05). b ATP levels of RAW 264.7 cells after pre-treatment for 2 h with control buffer (CTL) or 3d2 at indicated concentrations in the medium at normal conditions, or medium supplemented with 8 mM pyruvate (Pyr) or 4 mM l-glutamine (Gln), following 18 h stimulation with LPS (30 ng/ml). The percentage of ATP was normalized to the untreated control. Mean values of triplicates ± SD of a representative experiment (n = 3) are shown. c TNF levels in the supernatant of RAW 264.7 cells pre-treated for 2 h with vehicle (PBS) or 3d2 (40 μM), following 18 h stimulation with control buffer (CTL) or LPS (30 ng/ml) in normal culture medium, or medium supplemented with 8 mM pyruvate (Pyr) or 4 mM Gln. Pooled values (three to four technical replicates) of three independent experiments ± SD are shown (t test or two-way ANOVA; *p < 0.05, **p < 0.01, n.s. = not significant).
Fig. 6
Fig. 6. LRH-1 inhibition protects from TNF-dependent hepatitis.
Wild-type C57BL/6 mice (n = 6–9 per group) were pre-treated with vehicle (PBS) or 3d2 (50 mg/kg body weight) i.p. injections for 1 h and then challenged by i.p. injections of LPS (0.2 mg) and GalN (40 mg). Serum was harvested for the analysis of a TNF protein concentrations and b transaminase (ALT) levels (t test; ***p < 0.001, n.s. = not significant). c Immunohistochemical detection of cleaved caspase-3-positive, apoptotic hepatocytes in liver sections from untreated (CTL) or LPS/GalN i.p. injected mice pre-treated with PBS or 3d2 as described above (scale bar: 150 μm).

Similar articles

Cited by

References

    1. Stein S, Schoonjans K. Molecular basis for the regulation of the nuclear receptor LRH-1. Curr. Opin. Cell Biol. 2015;33:26–34. doi: 10.1016/j.ceb.2014.10.007. - DOI - PubMed
    1. Xu P, et al. LRH-1-dependent programming of mitochondrial glutamine processing drives liver cancer. Genes Dev. 2016;30:1255–1260. doi: 10.1101/gad.277483.116. - DOI - PMC - PubMed
    1. Oosterveer MH, et al. LRH-1-dependent glucose sensing determines intermediary metabolism in liver. J. Clin. Invest. 2012;122:2817–2826. doi: 10.1172/JCI62368. - DOI - PMC - PubMed
    1. Matsukuma KE, Wang L, Bennett MK, Osborne TF. A key role for orphan nuclear receptor liver receptor homologue-1 in activation of fatty acid synthase promoter by liver X receptor. J. Biol. Chem. 2007;282:20164–20171. doi: 10.1074/jbc.M702895200. - DOI - PubMed
    1. Lee YK, et al. Liver receptor homolog-1 regulates bile acid homeostasis but is not essential for feedback regulation of bile acid synthesis. Mol. Endocrinol. 2008;22:1345–1356. doi: 10.1210/me.2007-0565. - DOI - PMC - PubMed

Publication types

MeSH terms