. 2020 Feb 28;11(1):1109.
doi: 10.1038/s41467-020-14898-6.

Structure of the processive human Pol δ holoenzyme

Affiliations

Structure of the processive human Pol δ holoenzyme

Claudia Lancey et al. Nat Commun. .

Abstract

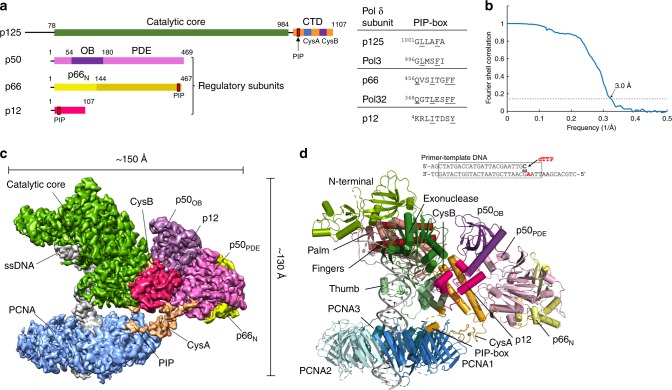
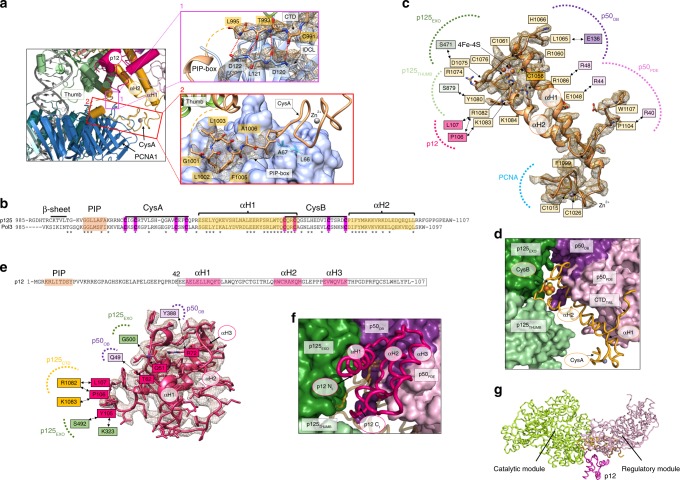
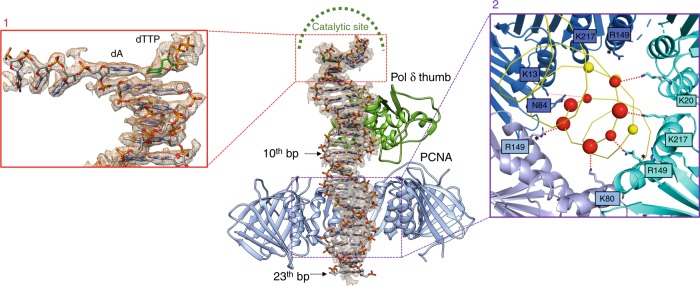
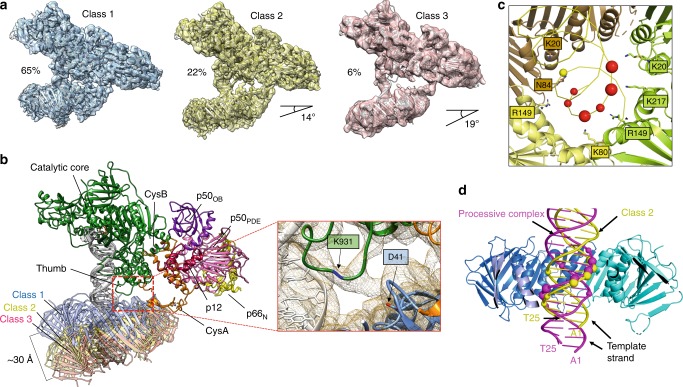
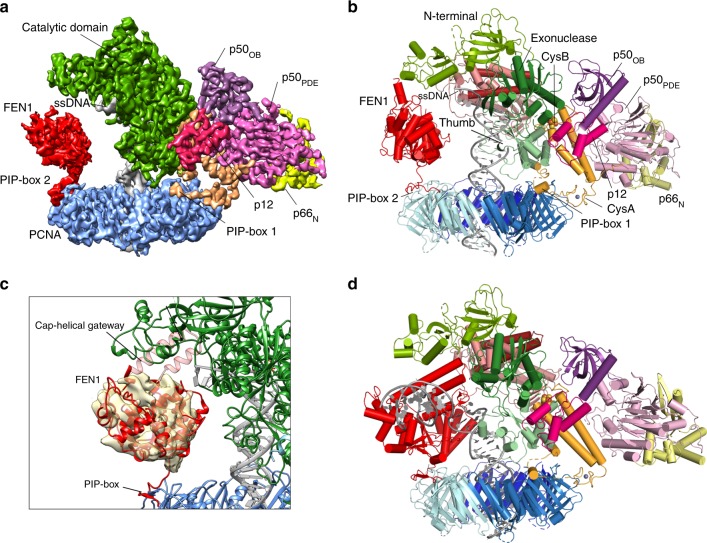
In eukaryotes, DNA polymerase δ (Pol δ) bound to the proliferating cell nuclear antigen (PCNA) replicates the lagging strand and cooperates with flap endonuclease 1 (FEN1) to process the Okazaki fragments for their ligation. We present the high-resolution cryo-EM structure of the human processive Pol δ-DNA-PCNA complex in the absence and presence of FEN1. Pol δ is anchored to one of the three PCNA monomers through the C-terminal domain of the catalytic subunit. The catalytic core sits on top of PCNA in an open configuration while the regulatory subunits project laterally. This arrangement allows PCNA to thread and stabilize the DNA exiting the catalytic cleft and recruit FEN1 to one unoccupied monomer in a toolbelt fashion. Alternative holoenzyme conformations reveal important functional interactions that maintain PCNA orientation during synthesis. This work sheds light on the structural basis of Pol δ's activity in replicating the human genome.


Conflict of interest statement

The authors declare no competing interests.

Figures

Fig. 1
Fig. 1. Cryo-EM structure of the processive Pol δ–DNA–PCNA complex.
a Domain organization of the four subunits of human Pol δ and amino acid sequence of PCNA-interacting (PIP-box) motifs. CTD C-terminal domain, OB oligonucleotide binding domain, PDE phosphodiesterase domain. b Gold-standard Fourier shell correlation for the Cryo-EM reconstruction of the Pol δ–DNA–PCNA complex, showing the resolution estimation using the 0.143 criterion. c Cryo-EM density map of the Pol δ–DNA–PCNA complex colored by domain. d Structure of the Pol δ–DNA–PCNA complex colored by domain and sequence of the DNA primer/template substrate. The region of the substrate that was modelled is boxed.
Fig. 2
Fig. 2. Cryo-EM density and model of selected regions of the Pol δ–DNA–PCNA complex.
a Map regions showing the critical interactions tethering the polymerase to PCNA. Models are colored by domain. Inset 1: main-chain hydrogen bonds between the CTD of p125 and the IDCL of PCNA, indicated as red dotted lines. Residues involved in the interactions are labeled and colored by domain. Amino acid side chains are not shown. Inset 2: interaction between the p125 PIP-box and PCNA. b Sequence alignment of the CTD of human and Saccharomyches cerevisiae Pol δ and motifs. Asterisks correspond to conserved residues. Conserved cysteines in CysA and CysB motifs are highlighted in magenta. c Map region and model of the CTD of p125. Interfacial residues are boxed and colored by domain. Residues participating in polar interactions are connected by double-headed arrows. Some of the amino acid side chains are omitted for clarity. d Model region showing the pocket between the p125 and p50 subunits, where the CTD is inserted. p125 and p50 domains are shown as surfaces, and the CTD as a ribbon. The FeS cofactor and zinc ion in the CTD are shown as spheres. The p12 subunit was removed for clarity. e Map region and model of the p12 subunit of Pol δ, and p12 amino acid sequence and motifs. The segment of the p12 sequence that was modelled is boxed. Interfacial residues are boxed and colored by domain. Residues participating in polar interactions are connected by double-head arrows. f Model region showing the position of p12 relative to the holoenzyme. p12 and CTD are shown as ribbons and the latter is shown with enhanced transparency. p125 and p50 domains are shown as surfaces. g Model of human Pol δ in ribbon representation, showing the p12 subunit connecting the catalytic and regulatory modules.
Fig. 3
Fig. 3. Interaction of the processive Pol δ holoenzyme with DNA.
Map region around dsDNA and model, showing that DNA is held in place by the polymerase thumb domain, and stabilized by the PCNA central channel. The N-terminal, palm and fingers domains of Pol δ and the PCNA monomer in the foreground are removed for clarity. Inset 1: Cryo-EM map region and model of primer/template DNA in the Pol δ active site. The terminal adenine in the primer strand and paired incoming dTTP are labeled. Inset 2: PCNA interactions with DNA. PCNA subunits are shown as cartoons and colored in different shades of blue. DNA is shown as a yellow ribbon. DNA phosphates within a coulombic interaction distance (<6 Å) from PCNA residues are shown as spheres. Interacting phosphates on the template and primer strands are shown in red and yellow, respectively. Phosphates closer than 5 Å are shown with a larger sphere diameter. PCNA interacting residues are shown as sticks and labeled. The asterisk indicates that the side chain of R149 is flexible, but could approach a phosphate group at a distance <6 Å.
Fig. 4
Fig. 4. Alternative conformers of Pol δ holoenzyme.
a Three representative EM 3D classes showing increasing tilting of the PCNA ring relative to the polymerase. The percentage values indicated next to the EM reconstructions correlate with the proportion of particles assigned to the three 3D classes and represent an estimate of the prevalence of each conformation in the data set. b Overlay of the models corresponding to the EM reconstructions shown in a. Inset: close up of the EM map of Class 1 showing the contact between the Pol δ thumb domain and PCNA loops. Residues K931 in the Pol δ loop and D41 in the PCNA loop are labelled. Density of K931 side chain is missing, indicating that K931 participates in a flexible interaction with PCNA. c PCNA interactions with DNA in Class 2. PCNA subunits are shown as cartoons and colored in different shades. DNA is shown as a yellow ribbon. DNA phosphates within a coulombic interaction distance (<6 Å) from PCNA residues are shown as spheres. Interacting phosphates on the template and primer strands are shown in yellow and red, respectively. Phosphates closer than 5 Å are shown with a larger sphere diameter. PCNA interacting residues are shown as sticks and labeled. d Side-view of the processive complex and Class 2 structures aligned using PCNA. The polymerase component is hidden for clarity. PCNA subunits are shown in different shades of blue and the subunit in the foreground is hidden. DNA molecules in the processive and Class 2 complexes are shown as purple and yellow ribbons, respectively. Phosphates interacting with PCNA residues are shown as spheres. Terminal bases of the DNA substrates are labelled.
Fig. 5
Fig. 5. Cryo-EM structure of the Pol δ–DNA–PCNA–FEN1 complex.
a Cryo-EM map of the complex colored by domains. b Complex model colored by domains. c Close-up showing the map region around FEN1 filtered to 6 Å resolution. d Proposed toolbelt model for Pol δ and FEN1 bound to PCNA processing an Okazaki fragment.

References

    1. Hübscher U, Maga G, Spadari S. Eukaryotic DNA polymerases. Annu. Rev. Biochem. 2002;71:133–163. doi: 10.1146/annurev.biochem.71.090501.150041. - DOI - PubMed
    1. Burgers PMJ, Kunkel TA. Eukaryotic DNA replication fork. Annu. Rev. Biochem. 2017;86:417–438. doi: 10.1146/annurev-biochem-061516-044709. - DOI - PMC - PubMed
    1. Yeeles JTP, Janska A, Early A, Diffley JFX. How the Eukaryotic replisome achieves rapid and efficient DNA replication. Mol. Cell. 2017;65:105–116. doi: 10.1016/j.molcel.2016.11.017. - DOI - PMC - PubMed
    1. Schauer GD, O’Donnell ME. Quality control mechanisms exclude incorrect polymerases from the eukaryotic replication fork. Proc. Natl Acad. Sci. 2017;114:675–680. doi: 10.1073/pnas.1619748114. - DOI - PMC - PubMed
    1. Clausen AR, Williams JS, Kunkel TA. Measuring ribonucleotide incorporation into DNA in vitro and in vivo. Methods Mol. Biol. 2017;1300:123–139. doi: 10.1007/978-1-4939-2596-4_9. - DOI - PMC - PubMed

Publication types