. 2020 Feb 28;11(1):1110.
doi: 10.1038/s41467-020-14906-9.

Melittin-lipid nanoparticles target to lymph nodes and elicit a systemic anti-tumor immune response

Affiliations

Melittin-lipid nanoparticles target to lymph nodes and elicit a systemic anti-tumor immune response

Xiang Yu et al. Nat Commun. .

Abstract

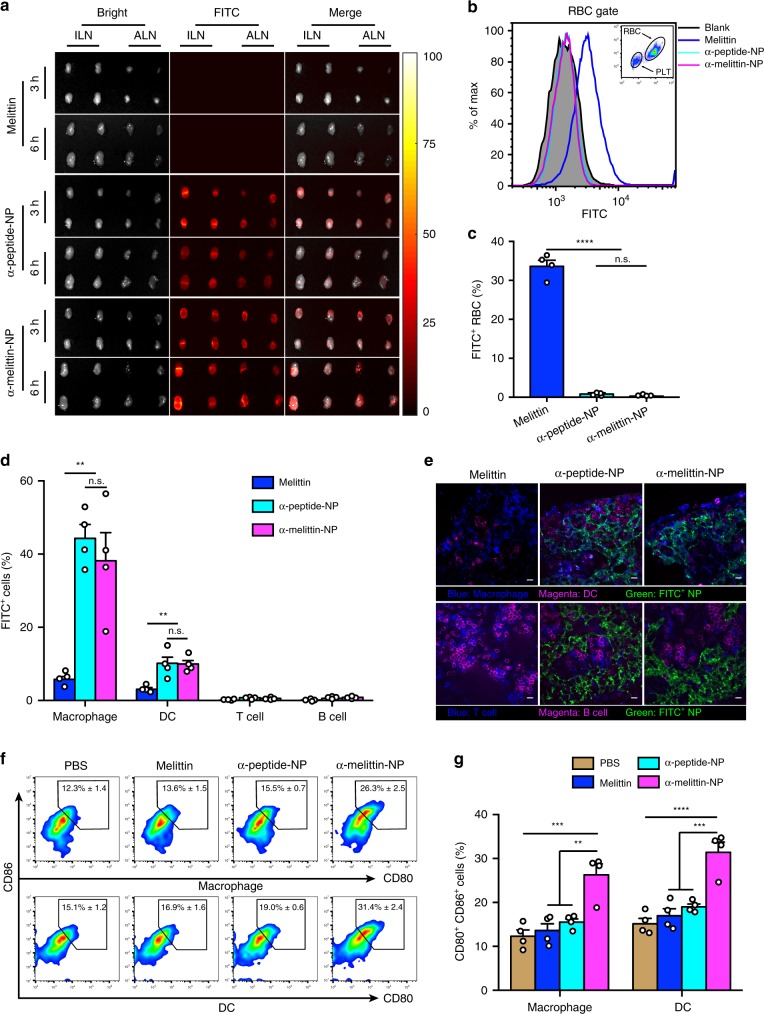
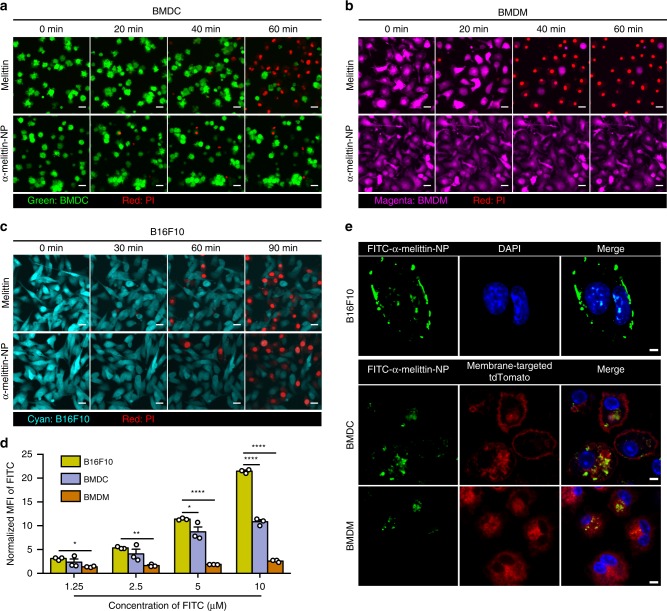
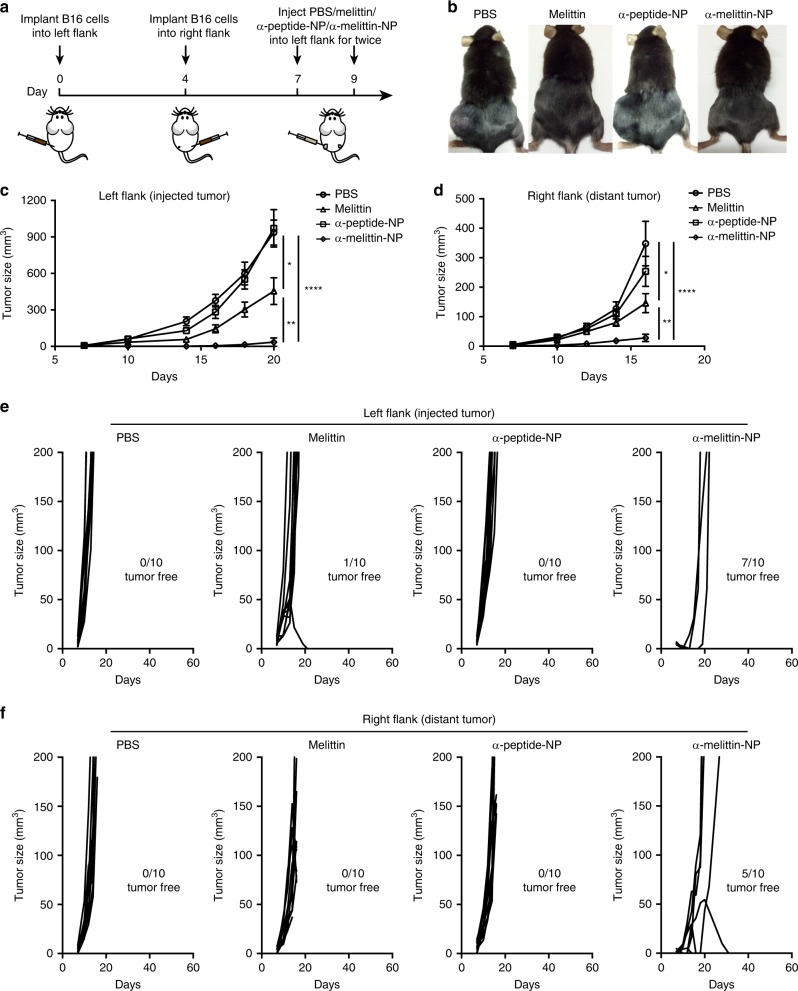
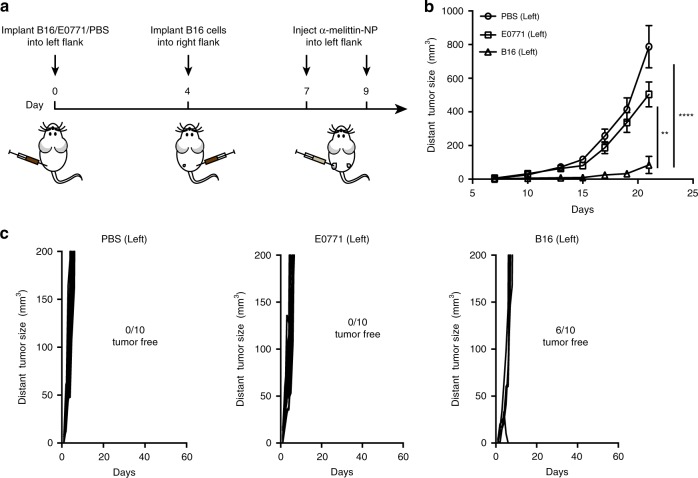
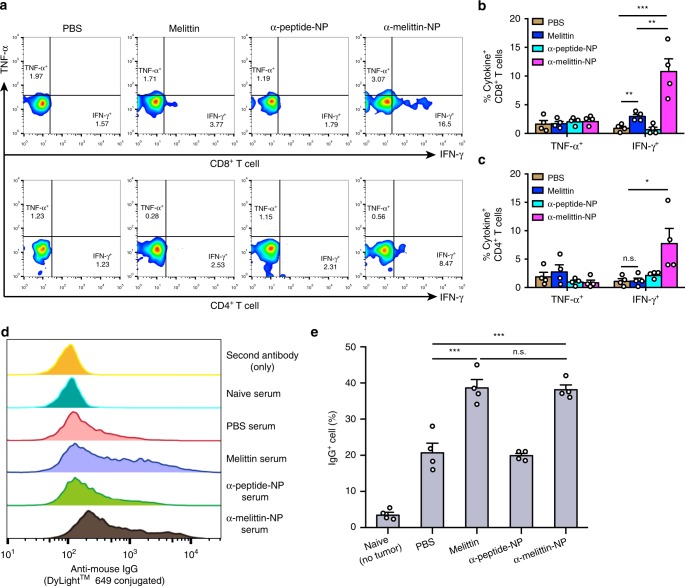
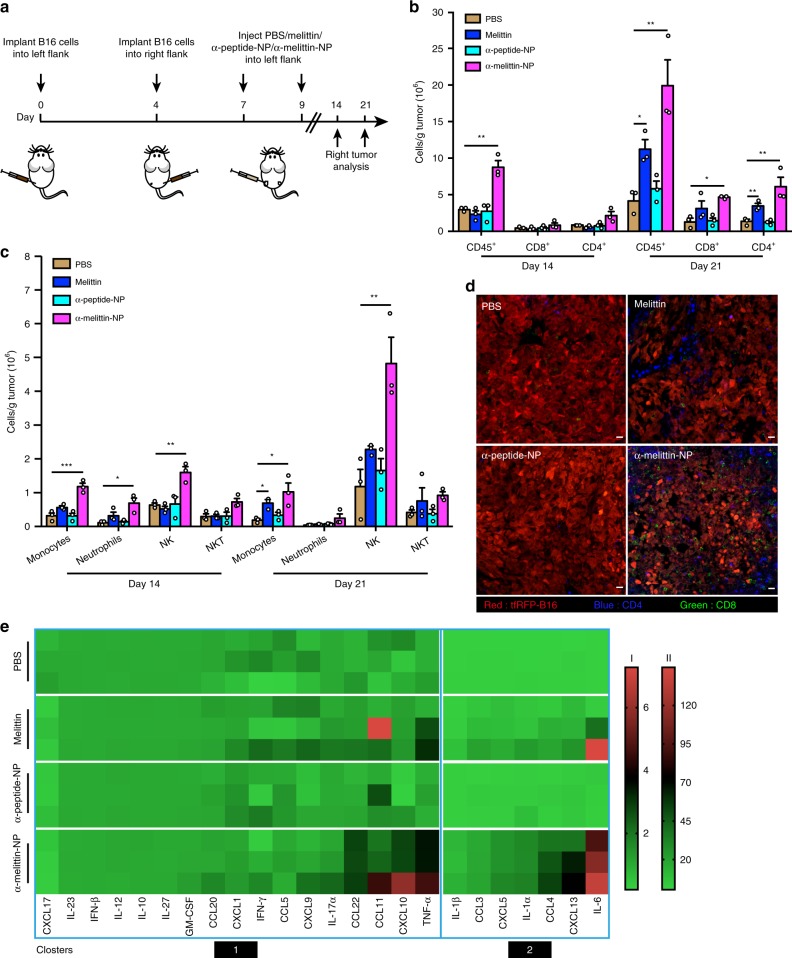
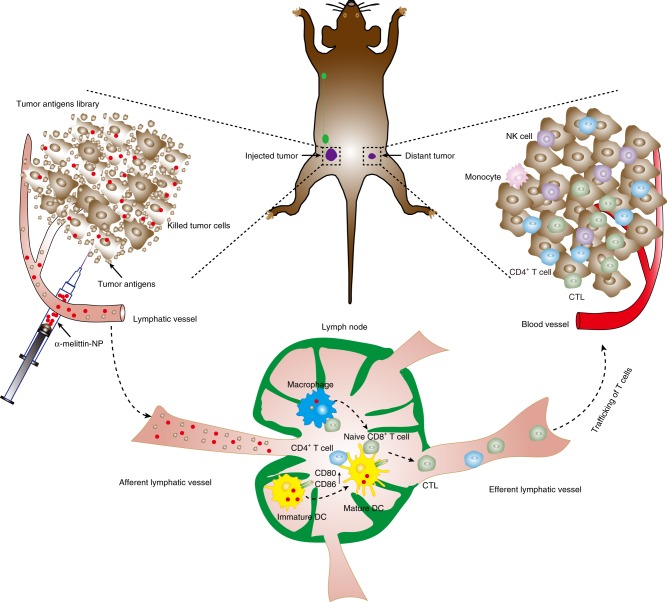
Targeted delivery of a nanovaccine loaded with a tumor antigen and adjuvant to the lymph nodes (LNs) is an attractive approach for improving cancer immunotherapy outcomes. However, the application of this technique is restricted by the paucity of suitable tumor-associated antigens (TAAs) and the sophisticated technology required to identify tumor neoantigens. Here, we demonstrate that a self-assembling melittin-lipid nanoparticle (α-melittin-NP) that is not loaded with extra tumor antigens promotes whole tumor antigen release in situ and results in the activation of antigen-presenting cells (APCs) in LNs. Compared with free melittin, α-melittin-NPs markedly enhance LN accumulation and activation of APCs, leading to a 3.6-fold increase in antigen-specific CD8+ T cell responses. Furthermore, in a bilateral flank B16F10 tumor model, primary and distant tumor growth are significantly inhibited by α-melittin-NPs, with an inhibition rate of 95% and 92%, respectively. Thus, α-melittin-NPs induce a systemic anti-tumor response serving as an effective LN-targeted whole-cell nanovaccine.


Conflict of interest statement

The authors declare no competing interests.

Figures

Fig. 1
Fig. 1. α-melittin-NPs efficiently flow into the LN and stimulate the activation of APCs.
a Fluorescence images of excised LNs from C57BL/6 mice (n = 4 per group) subcutaneously injected with 20 nmol FITC-melittin, FITC-α-peptide-NPs, and FITC-α-melittin-NPs (quantification was based on the FITC content). ILN, inguinal lymph node. ALN, axillary lymph node. Time points: 3 h and 6 h. b, c Representative histograms (b) and percentages (c) of FITC+ RBC at 3 h after s.c. injection (n = 4 biologically independent samples). PLT, platelets. RBC, red blood cell. d, e Flow cytometry (d) and immunofluorescence analysis (e) of the uptake of FITC-melittin, FITC-α-peptide-NPs, and FITC-α-melittin-NPs by the immune cells in ILNs at 3 h after s.c. injection. Blue and magenta represent F4/80+ macrophages and CD11c+ DCs, respectively, in upper panel and represent CD3+ T cells and B220+ B cells, respectively, in lower panel. Green represents FITC-labeled melittin, α-peptide-NPs, and α-melittin-NPs. Representative images from three independent experiments are shown. Scale bar, 10 μm. f, g Representative flow cytometry plots (f) and quantitative data (g) for CD80 and CD86 expression on macrophages and DCs in ILNs (n = 4 per group) at 24 h after s.c. injection with 35 nmol melittin, α-peptide-NPs, and α-melittin-NPs (quantification was based on the peptide content). The histograms on the right show the percentage of activated APCs. Data are shown as the mean ± SEM. n.s. not significant, **P < 0.01, ***P < 0.001, and ****P < 0.0001, as analyzed by one-way ANOVA with Bonferroni’s post hoc test (c, d, g). Source data are provided as a Source Data file.
Fig. 2
Fig. 2. Cell viability of APCs and B16F10 cells after exposure to melittin and α-melittin-NPs.
ac Real-time and dynamic imaging of BMDCs (a), BMDMs (b), and B16F10 cells (c) after incubations with free melittin (5 μM) and α-melittin-NP (10 μM). Green: BMDC, magenta: BMDM, cyan: B16F10. Red indicates PI. BMDCs and BMDMs were isolated from Actb-EGFP C57BL/6 mice in which EGFP is expressed uniformly in all cells except the erythrocytes and hair. Representative images from three independent experiments are shown. All scale bars represent 10 μm. d Evaluation of cellular-binding ability by analyzing the MFI of FITC-α-melittin-NPs in B16F10 cells, BMDCs and BMDMs (n = 3 per group). Incubation time: 3 h. MFI: mean fluorescent intensity. The MFI values were normalized according to minimum in each type of cell. e Representative immunofluorescence imaging of cellular binding of FITC-α-melittin-NPs (10 μM) to B16F10 cells, BMDCs and BMDMs. BMDCs and BMDMs were isolated from mT/mG mice that express a strong red fluorescence protein (tdTomato) in the membrane systems (plasma membrane, lysosome, etc) of all cell types. Incubation time: 3 h. Blue: DAPI, green: FITC-α-melittin-NPs, red: membrane-targeted tdTomato. Representative images from three independent experiments are shown. Scale bar: 5 μm. Data are shown as the mean ± SEM. *P < 0.05, **P < 0.01 and ****P < 0.0001, as analyzed by one-way ANOVA with Bonferroni’s post hoc test (d). Source data are provided as a Source Data file.
Fig. 3
Fig. 3. α-melittin-NPs as an in situ vaccine delay tumor growth and mediate systemic tumor control.
a Treatment scheme. B16F10 cells were implanted into the left and right flanks of mice (n = 10 per group) on days 0 and 4, respectively. The mice were treated with intratumoral injections of 35 nmol melittin, α-peptide-NPs, and α-melittin-NPs (quantification was based on the peptide content) on days 7 and 9. b Representative pictures of mice treated with the scheme described above. All individuals are shown in Supplementary Fig. 10. c, d Tumor growth of the injected tumor (c) and distant tumor (d). e, f Individual tumor growth kinetics of the injected (e) and distant tumor (f). Data are shown as the mean ± SEM. *P < 0.05, **P < 0.01, and ****P < 0.0001, as analyzed by one-way ANOVA with Bonferroni’s post hoc test (c, d). Source data are provided as a Source Data file.
Fig. 4
Fig. 4. Systemic antitumor effect is specific for whole-cell tumor antigens.
a Treatment scheme. Mice (n = 10 per group) were inoculated in the left flank with B16F10 cells, E0771 cells, or PBS on day 0. After 4 days, B16F10 cells were implanted into the right flank. The mice were treated with intratumoral injections of 35 nmol α-melittin-NPs (quantification was based on the peptide content) in PBS, with a total volume of 50 μl, on days 7 and 9. b Growth of tumors in the right flank. c Individual tumor growth kinetics of the right tumors. Data are shown as the mean ± SEM. **P < 0.01 and ****P < 0.0001, as analyzed by one-way ANOVA with Bonferroni’s post hoc test (b). Source data are provided as a Source Data file.
Fig. 5
Fig. 5. α-melittin-NPs induce antigen-specific T cells and antibody responses.
a–c C57BL/6 mice (n = 4 per group) were treated as described above (Fig. 3a), on day 21, the lymphocytes isolated from the tumor-draining LNs were restimulated with DCs pulsed with B16F10 tumor lysates and were analyzed by flow cytometry with intracellular cytokine staining. Representative flow cytometry plots (a) and cumulative results (b, c) are shown. d, e The B16F10 tumor cells were incubated with 5% serum that was collected from treated mice and age-matched naïve mice (n = 4 per group). Subsequently, these cells were stained with a DyLight649-conjugated mouse IgG-specific secondary antibody and were analyzed by flow cytometry. Flow cytometry plots (d) and statistical percentages (e) are shown. Data are shown as the mean ± SEM. n.s. not significant, *P < 0.05, **P < 0.01 and ***P < 0.001, as analyzed by one-way ANOVA with Bonferroni’s post hoc test (b, c, e). Source data are provided as a Source Data file.
Fig. 6
Fig. 6. α-melittin-NPs induce the lymphocyte infiltration and dramatic changes in the cytokines/chemokines milieu in distant tumor.
a Treatment scheme. b, c Absolute numbers of adaptive immune cells (b) and innate immune cells (c) in the distant tumor (n = 3 per group per time point) were calculated from flow cytometry at 14 and 21 days after left tumor implantation. d Immunofluorescence images from distant tumors 21 days after left tumor implantation. Red: tfRFP-B16F10, blue: CD4+ T cell, green: CD8+ T cell. Representative images from three independent experiments are shown. Scale bar, 20 μm. e The levels of cytokines/chemokines in the tumor environment (n = 3 per group). According to the fold change relative to the untreated group, the expression levels of cytokines and chemokines were divided into two clusters. Clusters 1 and 2 share bars I and II, respectively. Data are shown as the mean ± SEM. n.s. not significant, *P < 0.05, **P < 0.01 and ***P < 0.001, as analyzed by one-way ANOVA with Bonferroni’s post hoc (b, c). Source data are provided as a Source Data file.
Fig. 7
Fig. 7. Schematic description of the mechanism of the in situ vaccine effect induced by α-melittin-NPs.
On the one hand, tumor cells are sensitive to α-melittin-NPs, and α-melittin-NPs maintain the ability of melittin to kill tumor cells and to promote the release of whole tumor-cell antigens in situ. On the other hand, α-melittin-NPs with reasonable size can successfully drain into LNs and activate macrophages and DC after s.c. injection. After the priming and activation of the effector T-cell response against whole-tumor antigens in LN, the activated effector T cells traffic through the circulation into the distant tumor bed and kill their target tumor cells. Meanwhile, α-melittin-NPs also induce the infiltration of innate immune cells, especially NK cells and monocytes.

References

    1. Von Andrian UH, Mempel TR. Homing and cellular traffic in lymph nodes. Nat. Rev. Immunol. 2003;3:867–878. doi: 10.1038/nri1222. - DOI - PubMed
    1. Hubbell JA, Thomas SN, Swartz MA. Materials engineering for immunomodulation. Nature. 2009;462:449–460. doi: 10.1038/nature08604. - DOI - PubMed
    1. Kuai R, Ochyl LJ, Bahjat KS, Schwendeman A, Moon JJ. Designer vaccine nanodiscs for personalized cancer immunotherapy. Nat. Mater. 2017;16:489–496. doi: 10.1038/nmat4822. - DOI - PMC - PubMed
    1. Lynn GM, et al. In vivo characterization of the physicochemical properties of polymer-linked TLR agonists that enhance vaccine immunogenicity. Nat. Biotechnol. 2015;33:1201–1210. doi: 10.1038/nbt.3371. - DOI - PMC - PubMed
    1. Wang H, Mooney DJ. Biomaterial-assisted targeted modulation of immune cells in cancer treatment. Nat. Mater. 2018;17:761–772. doi: 10.1038/s41563-018-0147-9. - DOI - PubMed

Publication types

MeSH terms