. 2020 Feb 28;11(1):1132.
doi: 10.1038/s41467-020-14847-3.

High-resolution snapshots of human N-myristoyltransferase in action illuminate a mechanism promoting N-terminal Lys and Gly myristoylation

Affiliations

High-resolution snapshots of human N-myristoyltransferase in action illuminate a mechanism promoting N-terminal Lys and Gly myristoylation

Cyril Dian et al. Nat Commun. .

Abstract

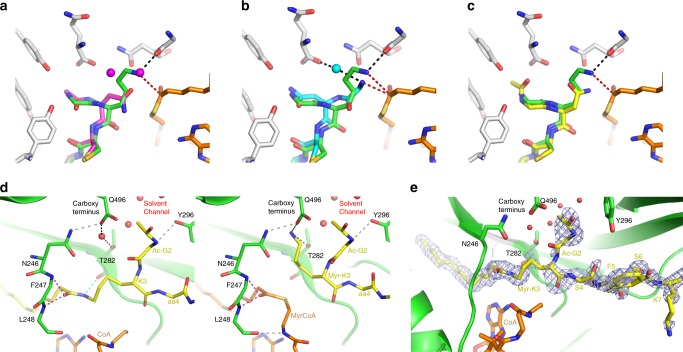
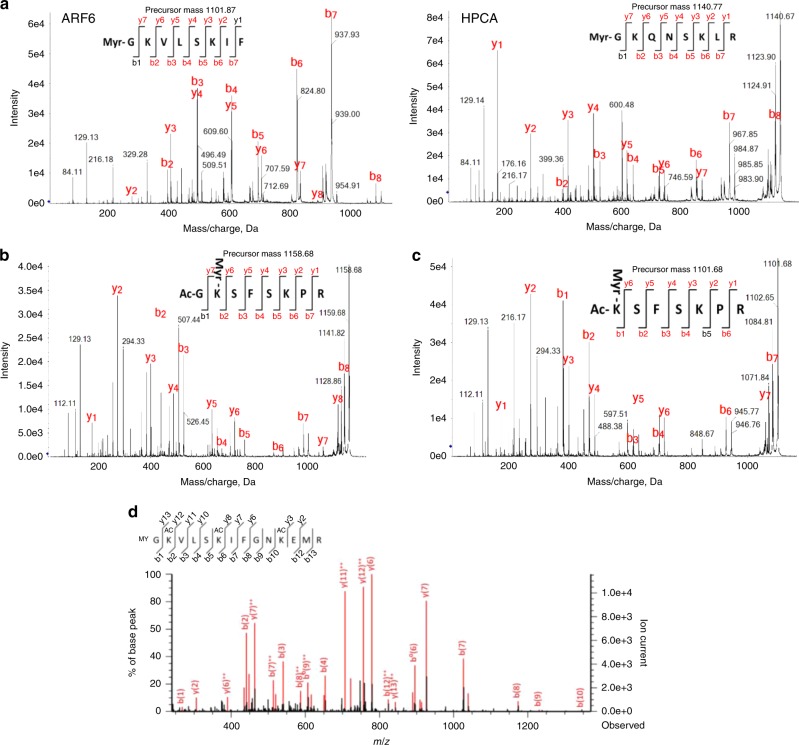
The promising drug target N-myristoyltransferase (NMT) catalyses an essential protein modification thought to occur exclusively at N-terminal glycines (Gly). Here, we present high-resolution human NMT1 structures co-crystallised with reactive cognate lipid and peptide substrates, revealing high-resolution snapshots of the entire catalytic mechanism from the initial to final reaction states. Structural comparisons, together with biochemical analysis, provide unforeseen details about how NMT1 reaches a catalytically competent conformation in which the reactive groups are brought into close proximity to enable catalysis. We demonstrate that this mechanism further supports efficient and unprecedented myristoylation of an N-terminal lysine side chain, providing evidence that NMT acts both as N-terminal-lysine and glycine myristoyltransferase.


Conflict of interest statement

The authors declare no competing interests.

Figures

Fig. 1
Fig. 1. N-myristoylation reaction and organisation of GNAT and NMT.
a Cartoon representation showing the co-translational myristoylation process of the protein. The Met-Gly nascent polypeptides first undergo removal of initial Met by the action of methionine aminopeptidase (MetAP), and then the unmasked Gly is modified by NMT, which utilises MyrCoA to transfer the Myr moiety to the N-terminal Gly. b General topology of GNATs. Conserved secondary structural elements are coloured in pale green, yellow, pink and cyan, respectively. The non-conserved secondary structural elements are coloured in blue. Regions that are important for CoA binding are shown in orange. The oxyanion hole bulge is highlighted in violet. A red broken circle highlights the position of the active site. Ab-loop and equivalent α1α2-loop are coloured in red. Black stars and triangles highlight crucial positions in the active site. c View of HsNMT:MyrCoA fold (pdb = 5O9T) labelled with secondary structure elements according to sequence alignment of NMTs in Supplementary Fig. 2a. d NMT topology showing the GNAT-core fold using the same colour code as in b.
Fig. 2
Fig. 2. Overview of the obtained crystallographic NMT complexes.
Crystal structures of HsNMT1 in complex with substrates, TI and products obtained with different peptides X, Y and Z. The HsNMT1 main chain is displayed as a green ribbon. Substrates, TI and products are displayed as sticks and are indicated with black arrows. a Crystal structure of HsNMT1 in complex with MyrCoA and peptide X (green). b Crystal structure of HsNMT1 in complex with TI-Y, in which peptide Y and CoA are coloured in cyan. c Crystal structure of HsNMT1 in complex with MyrY and CoA (orange) products. d Crystal structure of HsNMT1 in complex with MyrZ product coloured in pink. eh Detail of the “fofc omit” sigmaA-weighted electron density maps (mFobs – DFcalc, PHIcalc), shown in grey, for substrates, TI and products (in sticks coloured as in ad). The omit electron density maps were calculated after a round of refinement in which the occupancy of substrates, TI and products was set to zero. The e/Å3 value of each “2fofc omit” sigmaA-weighted electron density map (2mFobs – DFcalc, PHIcalc) at 0.92–1 rmsd level (0.25, 0.33, 0.33 and 0.30 e/Å3 for X, TI-Y, Myr-Y and Myr-Z, respectively) was used as reference to set the contoured value of fofc omit electron density maps shown. Peptide, Myr, MyrCoA and CoA moieties are indicated with black arrows.
Fig. 3
Fig. 3. The β-strand conformation of the substrate peptide is appropriate for the Ab-loop closed conformation.
a Superimposition of the three peptides X, Y and Z in the different states reveals a conserved β-strand conformation. Gly2 from X peptide is bound into a new cavity, increasing to seven the number of “recognition pockets” of the peptide-binding groove. Pockets allocating each amino acid are indicated with black dashed lines. Peptides X (green), MyrX (yellow), TI-Y (cyan), MyrY (orange) and MyrZ (pink) are displayed as sticks. b Superimposed peptides from HsNMT1:MyrCoA:X (green) and ScNMT:NHM:W (grey, PDB:1IID). The 2-Å distance between Gly2 ammonium of peptide X and the extra-methylene (CP) of NHM shows how the analogue prevents Gly2 of peptide W to bind at pocket 1 and forces the Cα of Gly2 of W to shift back to occupy the n-1 aa position observed in peptide X. This motion influences the whole peptide W, including aa5, which co-locates with aa4 of peptide X in pocket 4 and illustrates the major consequences induced by the extra methylene group of NHM on peptide conformation, pocket occupancy and amino-terminal reactive group positioning. Magenta dashed lines indicate distances between each Gly2 ammonium and CM1 reactive carbonyl of MyrCoA. c Superimposition of HsNMT1:MyrCoA:X (green) and ScNMT:NHM:W (grey, PDB:1IID). The NHM-induced conformation of peptide W favours the Ab-loop open conformation (cyan) to the detriment of the closed conformation (yellow) observed in HsNMT1:MyrCoA:X due to steric clashes between Leu3 and Tyr4 from W peptide and V181 and F190 from HsNMT1:MyrCoA:X Ab-loop, respectively (black broken line circle).
Fig. 4
Fig. 4. Three reaction snapshots reveal the importance of the T282 catalyst platform and water solvent channel.
View of the HsNMT1 active site showing direct and solvent-mediated hydrogen bonding interactions between the protein and: a substrates in HsNMT1:MyrCoA:X, b TI in HsNMT1:TI-Y and c products in HsNMT1:MyrX;CoA. The HsNMT1 chain is displayed as a green ribbon. Selected amino acids (green), substrate peptides (yellow), and MyrCoA and CoA moieties (both in orange) are shown as sticks. Hydrogen bond set1, linking Gly2 to the T282 catalyst platform, is shown as cyan dashes. Wat1-mediated hydrogen bond set2, linking Q496 to Tyr180/Tyr192 from the Ab-loop, substrate aa3 and Asn246 is shown as grey dashes. Wat1-mediated hydrogen bond set3 linking Gln496 to Gly2 ammonium is shown as black dashes. Water molecules from the solvent channel are shown as red spheres. Hydrogen bonds involved in the “oxyanion hole” are displayed as magenta dashed lines. The H-bond between thiolate and amine from CoA is shown as violet dashes.
Fig. 5
Fig. 5. MyrCoA and Ab-loop relationship and its importance in Myr catalysis.
a Structural superimposition of Apo-CaNMT (PDB 1NMT, chain B, green) and the binary ScNMT:MyrCoA structure (PDB 1IIC, chain X, blue) showing rearrangements in the N-terminus (34–56, in cyan) and A-loop upon MyrCoA binding. The latter switches the Ab-loop conformation from disordered (Apo-CaNMT, in yellow) to open (in ScNMT:MyrCoA, in cyan) due to steric clashes (red dashed lines) with Glu109. Interactions with Arg178 and Lys181, stabilising the open Ab-loop conformation, are shown as black dashed lines. b Superimposition of ScNMT:MyrCoA (PDB 1IIC, blue) and HsNMT1:MyrCoA:X (green) complexes showing MyrCoA compaction induced by the Ab-loop closed conformation observed in the complex with peptide X (yellow), which is induced by steric clashes (red dashed lines) with Ab-loop Val181 (yellow). Detail of the folded B′A′-loop (yellow) induced by the closed conformation of the Ab-loop (yellow) is also shown, as well as its interactions with MyrCoA and Ab-loop (black dashed line). The Ab-loop closed conformation is limited by clashes with aa3 carbonyl from peptide X. c Superimposition of HsNMT1:MyrCoA:X (green) and HsNMT1:CoA:MyrX complexes reveals that the Ab-loop-induced compaction of MyrCoA (yellow) is also transmitted into the CoA product (cyan). Interactions stabilising the Ab-loop closed conformation in HsNMT1:CoA:MyrX by salt bridges are highlighted with black dashed lines. d Side-view zoom showing MyrCoA thioester planes and relevant Ab-loop residues as sticks, in both ScNMT:MyrCoA (cyan) and HsNMT1:MyrCoA:X (yellow), reveals an interbend 1–2 compaction of MyrCoA caused by the closed Ab-loop conformation in HsNMT1:MyrCoA:X. e View of the interactions of B′A′-loop region with MyrCoA moiety in HsNMT1:MyrCoA:X. HsNMT1 is displayed in cartoon, main core, B′A′ region, Ab and fg -loops are colour in green, blue, yellow and pink respectively. Selected side chains and MyrCoA are displays as sticks. Hydrogen bonds and salt-bridges are shown as yellow dashes.
Fig. 6
Fig. 6. Role of the B′A′-loop in sequential release of the two products.
Solvent accessibility of the products at the HsNMT1 surface (dark grey) with the B′A′-loop surface highlighted in pink. Peptide, Myr and CoA moieties are shown as sticks in green, yellow and orange, respectively. a HsNMT1:MyrX:CoA crystal structure shows that an ordered B′A′-loop stabilises the CoA moiety and embeds Myr-peptide from the solvent. b HsNMT1:MyrZ crystal structure shows that CoA release, induced by unfolding the B′A'-loop, reveals a partially unmasked Myr moiety. c Model of HsNMT1:MyrZ deleted from the first 135 residues, mimicking the reported Apo-NMT crystal structure (pdb 1NMT), shows that the Myr moiety would be fully accessible to the solvent favouring Myr-peptide release or MyrCoA competition.
Fig. 7
Fig. 7. Detailed N-Myristoylation mechanism deduced from reaction snapshots.
a Substrate peptide binding to HsNMT1:MyrCoA having its Ab-loop in open conformation. b Closed Ab-loop induces distorted MyrCoA thioester plane. c Concerted H2O-mediated deprotonation and T282-assisted nucleophilic attack by NH2-Gly2. d Concerted Tetraedral Intermediate breakdown. e Myr-peptide and tensed CoA products formation. f CoA release and spontaneous deprotonation of carboxy terminus. Hydrogen bonds between wat3 and backbone atoms of I495 and T282 were not shown for clarity. The reaction dynamics are also detailed in Supplementary Movie 1.
Fig. 8
Fig. 8. Structural analysis and characterisation of the binding of a Lys side chain into the active site reactive cavity.
The crystal structures 5O9T (HsNMT1/Ac-N3CFSKPR), 6QRM (HsNMT1/ GN3CFSKRRAA, this work) and 6SJZ (HsNMT1/Ac-GN3CFSKPR, this work) were used in panels ac to model the position of the side chain with the reactive epsilon amino group of a Lys in the active site instead of the alpha amino of a Gly2. a Gly-Lys modelled based on peptide Ac-Asn3 of 5O9T (green) with 5O9T (peptide in magenta). b Same as a, but with Gly2-Asn3 from 6QRM (cyan). c Same as a, with peptide Ac Gly2-Asn3 (U) from 6SJZ (yellow). Selected amino acids of HsNMT1 are shown as grey sticks. MyrCoA moiety are shown as orange sticks. Wat1 linking the carboxy terminus of Gln496 to Gly2 ammonium is shown as a cyan sphere. Selected hydrogen bonds are displayed as black dashed line. Distance between either Nα (Gly2) or Nε (Lys3) and thioester carbonyl are displayed as red dashed line. d Snapshots of ε−Myr reaction trapped in crystal structure of HsNMT1 (green; 6SK2, V) in complex with MyrCoA (orange) and peptide V (Ac-GlyLysSerPheSerLysProArg; yellow) showing substrates (left; chain B) and reaction products (right; chain A). e Detail of the “fofc omit” sigmaA-weighted electron density map (mFobs – DFcalc, PHIcalc), shown in blue, for Myr-V peptide in 6SK2 structure. The omit electron density maps were calculated after a round of refinement in which the occupancy of the Myr-V peptide was set to zero. The e/Å3 value of the “2fofc omit” sigmaA-weighted electron density map (2mFobs – DFcalc, PHIcalc) at 1 rms (0.31 e/Å3) level was used as reference to set the contoured of the fofc omit electron density map shown.
Fig. 9
Fig. 9. NMT catalyses Lys-MYR when the NH2 amino group is blocked.
a–c MS/MS spectra resulting from MALDI-ToF-ToF analysis performed as described in the Methods after NMT incubation with various octapeptides are shown. The control MS spectra in the absence or presence of NMT are displayed in Supplementary Fig. 13. MS/MS spectra from: a ARF6 (left) and HPCA-derived peptides (right); b AcGKSFSKPR (U peptide); and c AcKSFSKPR (V peptide). d Example of annotated MS/MS spectrum of the Myristoylated peptide GKVLSKIFGNKEMR from ARF6 (P62330); mass spectrometry of RT4 urinary bladder cells is as in Castrec et al.. Acetylation of the Lys side chains of the protein sample was chemically induced in the presence of deuterated acetate. Both y13 and b1 ions favour Gly- over Lys-MYR.

References

    1. Bhatnagar, R. S., Ashrafi, K., Futterer, K., Waksman, G. & Gordon, J. I. in The enzymes, Vol. XXI (Protein lipidation) (eds F. Tamanoi & D. S. Sigman) 241–286 (Academic Press, 2001).
    1. Thinon E, et al. Global profiling of co- and post-translationally N-myristoylated proteomes in human cells. Nat. Commun. 2014;5:4919. doi: 10.1038/ncomms5919. - DOI - PMC - PubMed
    1. Traverso JA, et al. Roles of N-Terminal fatty acid acylations in membrane compartment partitioning: Arabidopsis h-type thioredoxins as a case study. Plant Cell. 2013;25:1056–1077. doi: 10.1105/tpc.112.106849. - DOI - PMC - PubMed
    1. Timms Richard T., Zhang Zhiqian, Rhee David Y., Harper J. Wade, Koren Itay, Elledge Stephen J. A glycine-specific N-degron pathway mediates the quality control of protein N-myristoylation. Science. 2019;365(6448):eaaw4912. doi: 10.1126/science.aaw4912. - DOI - PMC - PubMed
    1. Towler DA, et al. Purification and characterization of yeast myristoyl CoA:protein N- myristoyltransferase. Proc. Natl Acad. Sci. USA. 1987;84:2708–2712. doi: 10.1073/pnas.84.9.2708. - DOI - PMC - PubMed

Publication types