. 2020 Feb 28;11(1):1137.
doi: 10.1038/s41467-020-14821-z.

Annexin A5 as an immune checkpoint inhibitor and tumor-homing molecule for cancer treatment

Affiliations

Annexin A5 as an immune checkpoint inhibitor and tumor-homing molecule for cancer treatment

Tae Heung Kang et al. Nat Commun. .

Abstract

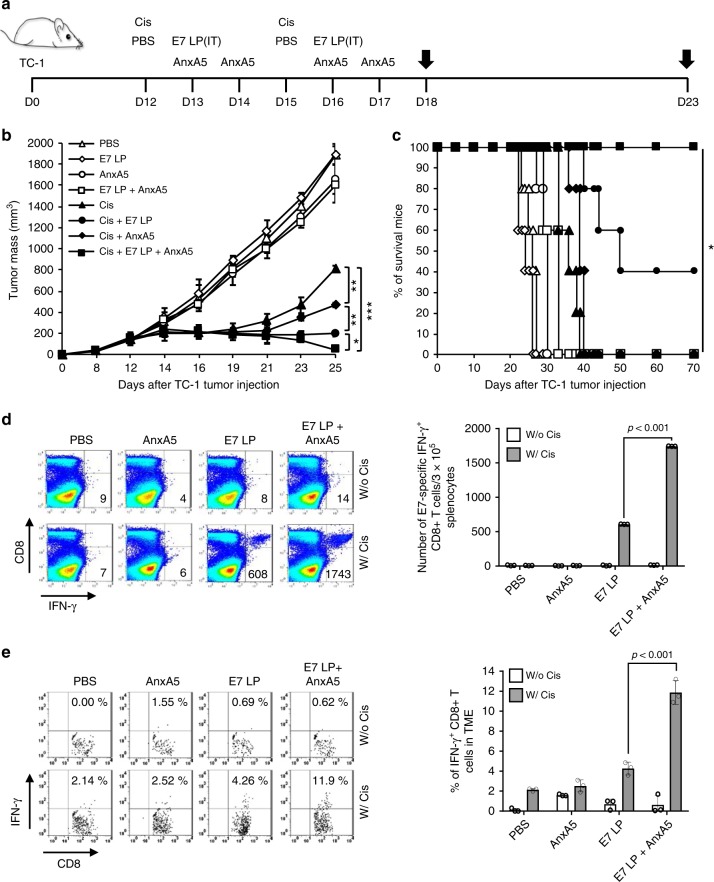
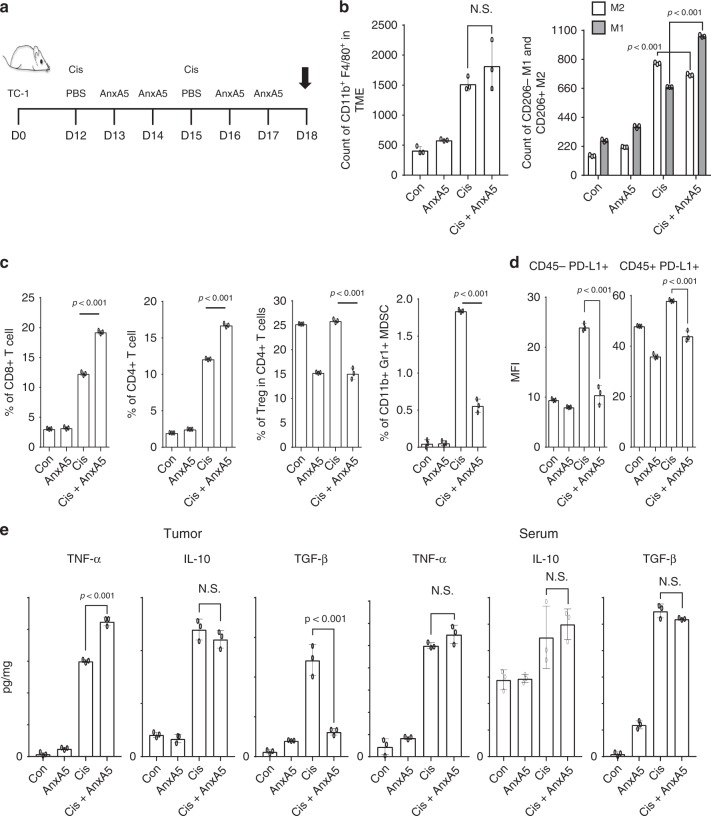
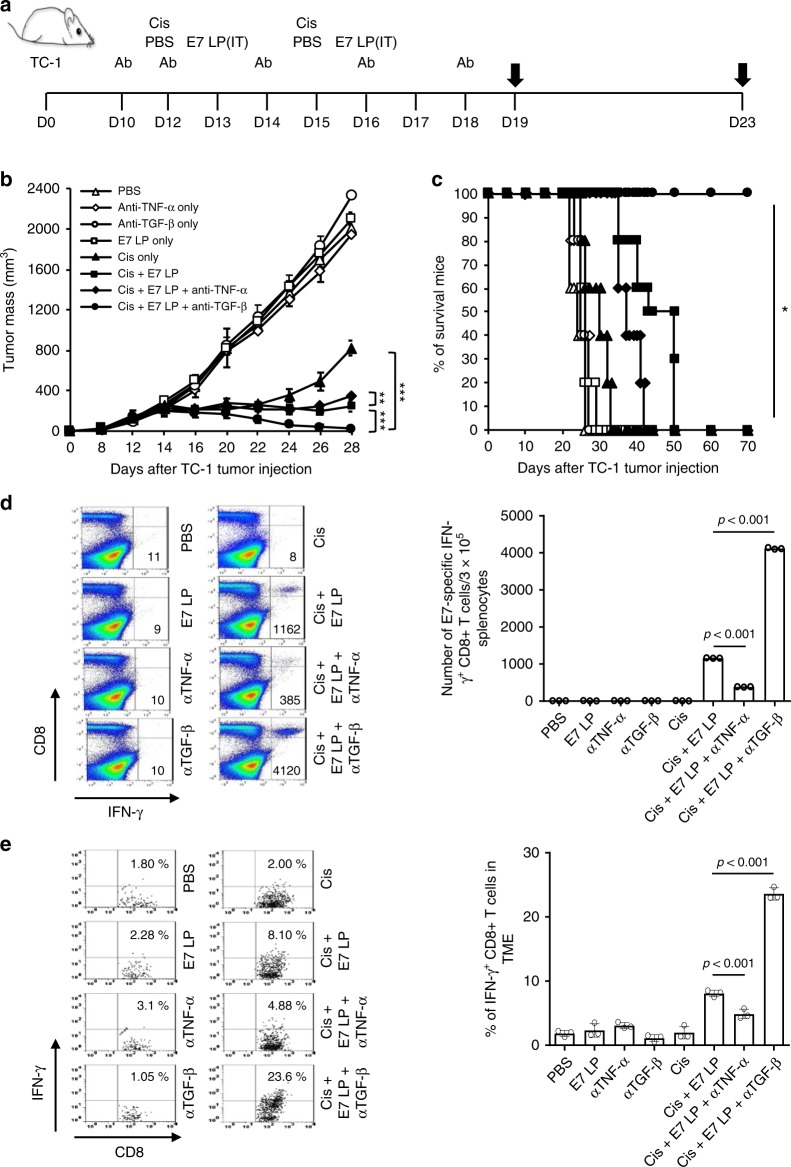
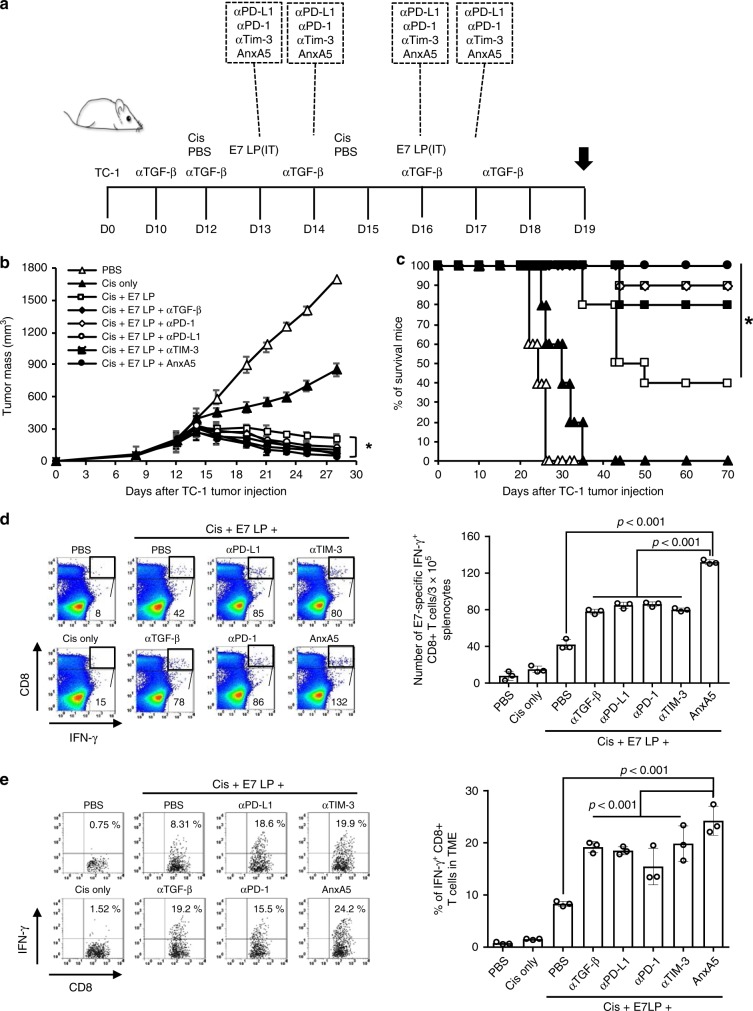
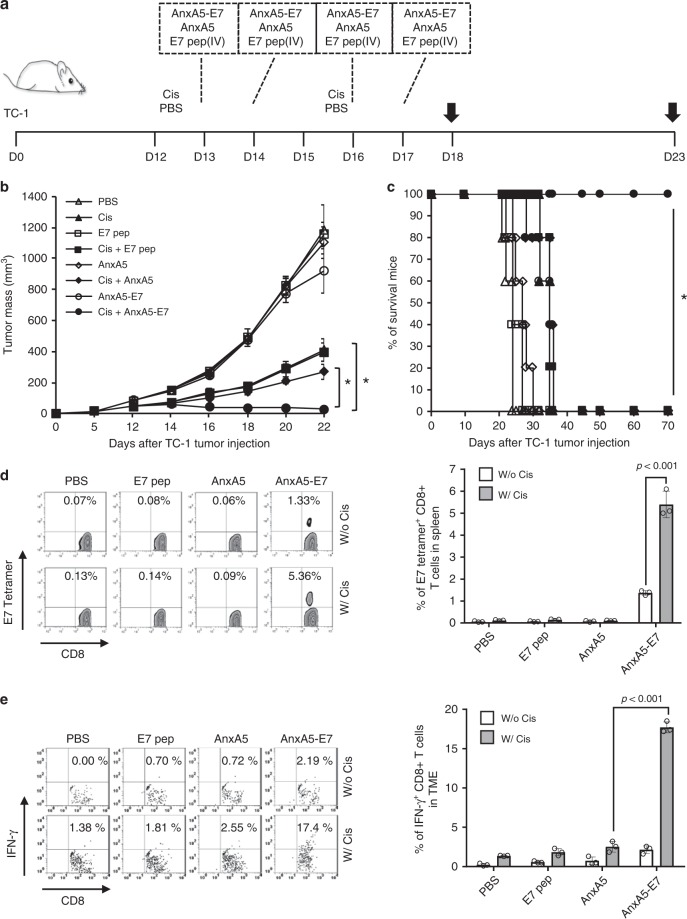
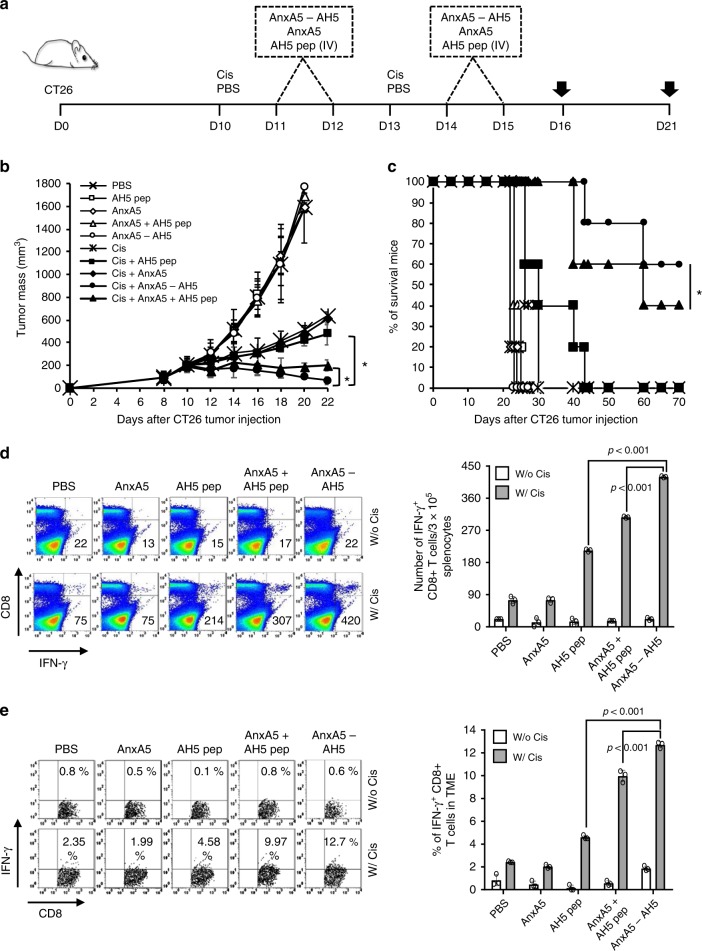
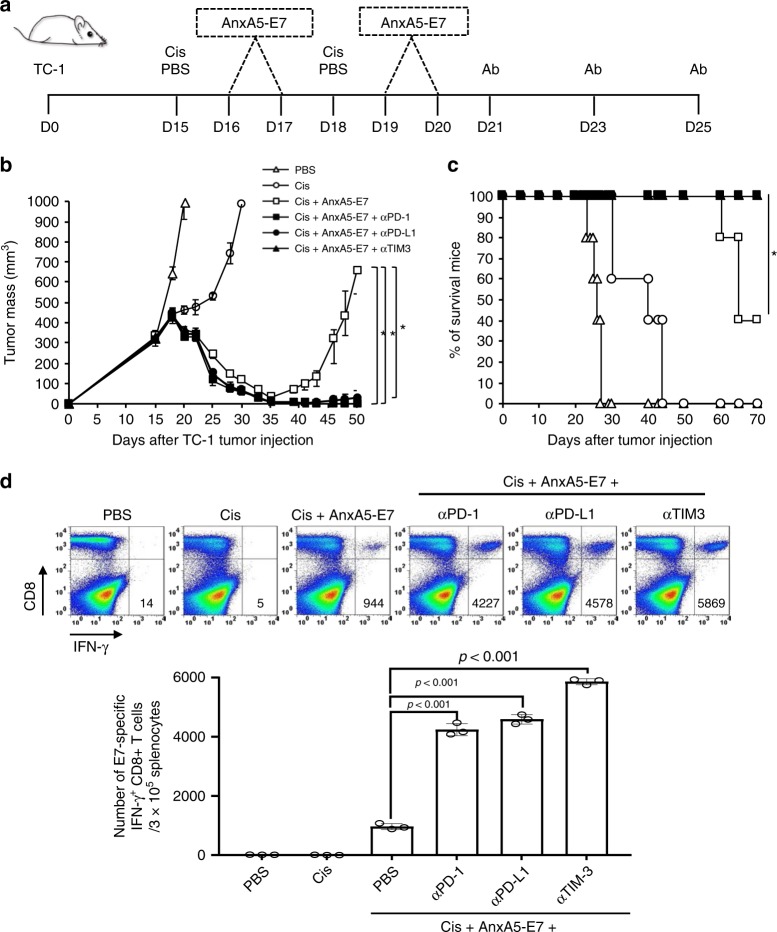
The interaction between immune cells and phosphatidylserine (PS) molecules exposed on the surface of apoptotic-tumor bodies, such as those induced by chemotherapies, contributes to the formation of an immunosuppressive tumor microenvironment (TME). Annexin A5 (AnxA5) binds with high affinity to PS externalized by apoptotic cells, thereby hindering their interaction with immune cells. Here, we show that AnxA5 administration rescue the immunosuppressive state of the TME induced by chemotherapy. Due to the preferential homing of AnxA5 to the TME enriched with PS+ tumor cells, we demonstrate in vivo that fusing tumor-antigen peptide to AnxA5 significantly enhances its immunogenicity and antitumor efficacy when administered after chemotherapy. Also, the therapeutic antitumor effect of an AnxA5-peptide fusion can be further enhanced by administration of other immune checkpoint inhibitors. Our findings support the administration of AnxA5 following chemotherapy as a promising immune checkpoint inhibitor for cancer treatment.


Conflict of interest statement

The authors declare no competing interests.

Figures

Fig. 1
Fig. 1. Therapeutic antitumor effect of Annexin A5 protein administration.
C57BL/6 mice (10 per group) were injected with 2 × 105 TC-1 cells/mouse subcutaneously on day 0. Mice were then treated intraperitoneally with 5 mg/kg Cisplatin on days 12 and 15, intravenously with 200jig/mice of Annexin A5 proteins on days 13, 14, 16, and 17, and/or intratumorally with 20jig/mice of E7 long peptide on days 13 and 16. The treatment groups are as follows: opened triangle - PBS only; opened sphere—E7 long peptide only; opened circle—Annexin A5 only; opened square—E7 long peptide and Annexin A5; closed triangle—cisplatin only; closed circle—cisplatin and E7 long peptide; closed sphere—cisplatin and Annexin A5; closed square—cisplatin, E7 long peptide, and Annexin A5. a Schematic diagram. b Line graph depicting TC-1 tumor growth in different treatment groups over time (n = 10). P-values were determined by one-way ANOVA and Turkey’s test. c Kaplan–Meier survival analysis of TC-1 tumor-bearing mice in different treatment groups and the overall P-value was calculated by the log-rank test (n = 10). d, e On days 18 and 23, tumor tissues and spleens of TC-1 tumor-bearing mice in different treatment groups were harvested and analyzed for CD8+IFN-γ+ T cells by flow cytometry analysis, respectively. d Representative flow cytometry analysis and bar graph depicting the abundance of CD8+IFN-γ+ T cells in splenocytes of TC-1 tumor-bearing mice in different treatment groups. e Representative flow cytometry analysis and bar graph depicting the abundance of CD8+IFN-γ+tumor-infiltrating T cells in TC-1 tumor-bearing mice in different treatment groups. The error bars indicate mean ± SD. P-values were analyzed by Student’s t test (n = 3). The results are representative of one of three independent experiments. Source data are provided as a Source Data file.
Fig. 2
Fig. 2. Characterization of tumor microenvironment following Annexin A5 treatment.
C57BL/6 mice (10 per group) were injected with 2 × 105 TC-1 cells/mouse subcutaneously on day 0. Mice were then treated intraperitoneally with 5 mg/kg Cisplatin on days 12 and 15, and/or intravenously with 200jig/mice of Annexin A5 proteins on days 13, 14, 16, and 17. PBS was used as control. On day 18, tumor tissues and serum of mice were harvested. a Schematic diagram. b Bar graphs depicting the abundance of CD11b+ F4/80+ macrophages and their M1/M2 distributions in the tumor tissue following flow cytometry analysis (n = 3). c Bar graphs depicting the presence of CD8+ T cells, CD4+ T cells, Treg cells, and MDSCs in the tumor tissue following flow cytometry analysis (n = 3). d Bar graphs depicting the expression of PD-L1 by CD45+ immune cells and CD45- tumor cells following flow cytometry analysis (n = 3). e Bar graphs depicting the levels of TNF-α, IL-10 and TGF-3 cytokines in the tumor tissue and serum of mice as measured by ELISA (n = 3). The error bars indicate mean ± SD. N.S. = not significant. For (be), P-values were analyzed by Student’s t test. The results are representative of one of three independent experiments. Source data are provided as a Source Data file.
Fig. 3
Fig. 3. Antitumor effect of anti-TGF-β or anti-TNF-α antibody treatment.
C57BL/6 mice were injected with 2 × 105 TC-1 cells/mice subcutaneously on day 0. Mice were then treated intraperitoneally with 200jig/mice TGF-3 or TNF-α neutralizing antibody on day 10, 12, 14, 16, and 18, intraperitoneally with 5 mg/kg Cisplatin on days 12 and 15, and/or intratumorally with 20jig/mice of E7 long peptide on days 13 and 16. The treatment groups are as follows: opened triangle - PBS only; opened sphere - anti-TNF-α only - opened circle, TGF-3 only - opened square, E7 long peptide only - closed triangle, cisplatin only - closed square, cisplatin and E7 long peptide - closed sphere, cisplatin, E7 long peptide, and anti-TNF-α; closed circle—cisplatin, E7 long peptide, and anti-TGF-f3. a Schematic diagram. b Line graph depicts TC-1 tumor growth in different treatment groups over time (n = 10). P-values were determined by one-way ANOVA and Turkey’s test. (c) Kaplan–Meier survival analysis of TC-1 tumor-bearing mice in different treatment groups (n = 10), and the overall P-value was calculated by the log-rank test. d, e On days 19 and 23, tumor tissues and spleens of TC-1 tumor-bearing mice in different treatment groups were harvested and analyzed for CD8+IFN-γ+ T cells by flow cytometry analysis, respectively. d Representative flow cytometry analysis and bar graph depicting the abundance of CD8+IFN-γ+ T cells in splenocytes of TC-1 tumor-bearing mice in different treatment groups (n = 3). (e) Representative flow cytometry analysis and bar graph depicting the abundance of CD8+IFN-γ+tumor-infiltrating T cells in TC-1 tumor-bearing mice in different treatment groups (n = 3). The error bars indicate mean ± SD. For d, e, P-values were analyzed by Student’s t test. The results are representative of one of three independent experiments. Source data are provided as a Source Data file.
Fig. 4
Fig. 4. Antitumor efficacy of Annexin A5 versus other immune checkpoint inhibitors.
C57BL/6 mice were injected with 2 × 105 TC-1 cells/mouse subcutaneously on day 0. Mice were then treated intraperitoneally with 200jig/mice α-TGF-f3 on day 10, 12, 14, 16, and 18, intraperitoneally with 5 mg/kg Cisplatin on days 12 and 15, intravenously with 200jig/mice of Annexin A5 proteins on days 13, 14, 16, and 17, intraperitoneally with 200jig/mice of α-PD-1, α-PD-L1, or α-TIM-3 on days 13, 14, 16, and 17, and/or intratumorally with 20jig/mice of E7 long peptide on days 13 and 16. PBS and irrelevant IgG were used as controls. The treatment groups are as follows: opened triangle - PBS only; closed triangle - cisplatin only; opened square—cisplatin and E7 long peptide; closed sphere—cisplatin, E7 long peptide, and anti-TGF-f3; opened sphere—cisplatin, E7 long peptide, and anti-PD-1; opened circle—isplatin, E7 long peptide, and anti-PD-L1; closed square—cisplatin, E7 long peptide, and anti-TIM-3; closed circle—cisplatin, E7 long peptide, and Annexin A5. a Schematic diagram. b Line graph depicts TC-1 tumor growth in different treatment groups over time (n = 10). P-values were determined by one-way ANOVA and Turkey’s test. c Kaplan–Meier survival analysis of TC-1 tumor-bearing mice in different treatment groups (n = 10), and the overall P-value was calculated by the log-rank test. d, e On day 19, spleens and tumor tissues of TC-1 tumor-bearing mice in different treatment groups were harvested and analyzed for CD8+IFN-γ+ T cells by flow cytometry analysis. d Representative flow cytometry analysis and bar graph depicting the abundance of CD8+IFN-γ+ T cells in splenocytes of TC-1 tumor-bearing mice in different treatment groups (n = 3). e Representative flow cytometry analysis and bar graph depicting the abundance of CD8+IFN-γ+tumor-infiltrating T cells in TC-1 tumor-bearing mice in different treatment groups (n = 3). The error bars indicate mean ± SD. For d, e, P-values were analyzed by Student’s t test. The results are representative of one of three independent experiments. Source data are provided as a Source Data file.
Fig. 5
Fig. 5. Antitumor effects of recombinant Annexin A5-E7 fusion protein.
C57BL/6 mice were injected with 2 × 10⁵ TC-1 cells/mouse subcutaneously on day 0. Mice were then treated intraperitoneally with 5 mg/kg Cisplatin on days 12 and 15, intravenously with 200jig/mice of Annexin A5-E7 fusion protein, 200jig/mice of Annexin A5 proteins, and/or 3.5jig/mice of E7 long peptide on days 13, 14, 16, and 17. The treatment groups are as follows: opened triangle—PBS only; closed triangle—cisplatin only; opened square—E7 peptide only; closed square—cisplatin and E7 peptide; opened sphere—Annexin A5 only; closed sphere—cisplatin and Annexin A5; opened circle—Annexin A5-E7peptide only; closed circle—cisplatin and Annexin A5-E7 peptide. a Schematic diagram. b Line graph depicting TC-1 tumor growth in different treatment groups over time (n = 10). P-values were determined by one-way ANOVA and Turkey’s test. c Kaplan–Meier survival analysis of TC-1 tumor-bearing mice in different treatment groups (n = 10), and the overall P-value was calculated by the log-rank test. d, e On days 18 and 23, tumor tissues and spleens of TC-1 tumor-bearing mice in different treatment groups were harvested and analyzed for CD8+IFN-γ+ or CD8+E7tetramer+ T cells by flow cytometry analysis, respectively. d Representative flow cytometry analysis and bar graph depicting the abundance of CD8+E7tetramer+ T cells in splenocytes of TC-1 tumor-bearing mice in different treatment groups (n = 3). e Representative flow cytometry analysis and bar graph depicting the abundance of CD8+IFN-γ+tumor-infiltrating T cells in TC-1 tumor-bearing mice in different treatment groups (n = 3). The error bars indicate mean ± SD. For (d, e), P-values were analyzed by Student’s t test. The results are representative of one of three independent experiments. Source data are provided as a Source Data file.
Fig. 6
Fig. 6. Antitumor effects of Annexin A5-AH5 fusion protein.
BALB/c mice were injected with 5 × 105 CT-26 cells/mouse subcutaneously on day 0. Mice were then treated intraperitoneally with 5 mg/kg cisplatin on days 10 and 13 and intravenously with 200jig/mice of AnxA5, 200jig/mice of AnxA5-AH5, and/or 3.5jig/mice of AH5 peptide on days 11, 12, 14, and 15. The treatment groups are as follows: cross—PBS only; opened square—AH5 peptide only; opened sphere—Annexin A5 only; opened triangle—Annexin A5 and AH5 peptide; opened circle—Annexin A5-AH5 only; star mark—cisplatin only; closed square—cisplatin and AH5 peptide; closed sphere—cisplatin and Annexin A5; closed circle—cisplatin and Annexin 5A-AH5; closed triangle—cisplatin, Annexin A5, and AH5 peptide. a Schematic diagram. b Line graph depicts CT-26 tumor growth in different treatment groups over time (n = 10). P-values were determined by one-way ANOVA and Turkey’s test. c Kaplan–Meier survival analysis of CT-26 tumor-bearing mice in different treatment groups (n = 10), and the overall P-value was calculated by the log-rank test. de On days 16 and 21, tumor tissues and spleens of CT26 tumor-bearing mice in different treatment groups were harvested and analyzed for CD8+IFN-γ+ T cells by flow cytometry analysis, respectively. d Representative flow cytometry analysis and bar graph depicting the abundance of CD8+IFN-γ+ T cells in splenocytes of CT-26 tumor bearing mice in different treatment groups (n = 3). e Representative flow cytometry analysis and bar graph depicting the abundance of CD8+IFN-γ+tumor-infiltrating T cells in CT-26 tumor bearing mice in different treatment groups (n = 3). The error bars indicate mean ± SD. For (d, e), P-values were analyzed by Student’s t test. The results are representative of one of three independent experiments. Source data are provided as a Source Data file.
Fig. 7
Fig. 7. Synergy of Annexin A5-E7 fusion protein and immune checkpoint inhibitors.
C57BL/6 mice were injected with 2 × 10⁵ TC-1 cells/mouse subcutaneously on day 0. Mice were then treated intraperitoneally with 5 mg/kg Cisplatin on days 15 and 18, intravenously with 200jig/mice of AnxA5-E7 proteins on days 16, 17, 19, and 20, and/or intraperitoneally with 200jig/mice of anti-PD-1, anti-PD-L1, or anti-TIM-3 antibodies on days 21, 23, and 25. The treatment groups are as follows: opened triangle - PBS only; opened circle - cisplatin only; opened square - cisplatin and Annexin 5A-E7; closed square – cisplatin, Annexin 5A-E7, and anti-PD-1; closed circle – cisplatin, Annexin 5A-E7, and anti-PD-L1; closed triangle - cisplatin, Annexin A5-E7, and anti-TIM3. a Schematic diagram. b Line graph depicting TC-1 tumor growth in different treatment groups over time (n = 10). P-values were determined by one-way ANOVA and Turkey’s test. c Kaplan–Meier survival analysis of TC-1 tumor-bearing mice in different treatment groups (n = 10), and the overall P-value was calculated by the log-rank test. d One week after the last AnxA5-E7 vaccination, spleens of TC-1 tumor-bearing mice in different treatment groups were harvested and analyzed for CD8+IFN-γ+ T cells by flow cytometry analysis. Figure showing representative flow cytometry analysis and bar graph depicting the abundance of CD8+IFN-γ+ T cells in splenocytes of TC-1 tumor-bearing mice in different treatment groups (n = 3). P-values were analyzed by Student’s t test. The error bars indicate mean ± SD. The results are representative of one of three independent experiments. Source data are provided as a Source Data file.

References

    1. Birge RB, Ucker DS. Innate apoptotic immunity: the calming touch of death. Cell Death Differ. 2008;15:10961102. doi: 10.1038/cdd.2008.58. - DOI - PubMed
    1. Marguet D, Luciani MF, Moynault A, Williamson P, Chimini G. Engulfment of apoptotic cells involves the redistribution of membrane phosphatidylserine on phagocyte and prey. Nat. Cell Biol. 1999;1:454–456. doi: 10.1038/15690. - DOI - PubMed
    1. Li MO, Sarkisian MR, Mehal WZ, Rakic P, Flavell RA. Phosphatidylserine receptor is required for clearance of apoptotic cells. Science. 2003;302:1560–1563. doi: 10.1126/science.1087621. - DOI - PubMed
    1. Kumar S, Calianese D, Birge RB. Efferocytosis of dying cells differentially modulate immunological outcomes in tumor microenvironment. Immunol. Rev. 2017;280:149–164. doi: 10.1111/imr.12587. - DOI - PMC - PubMed
    1. Birge RB, et al. Phosphatidylserine is a global immunosuppressive signal in efferocytosis, infectious disease, and cancer. Cell Death Differ. 2016;23:962–978. doi: 10.1038/cdd.2016.11. - DOI - PMC - PubMed

Publication types

MeSH terms