Clinical Trial
. 2020 Feb 28;10(1):3669.
doi: 10.1038/s41598-020-60314-w.

T-cell subset abnormalities predict progression along the Inflammatory Arthritis disease continuum: implications for management

Affiliations
Clinical Trial

T-cell subset abnormalities predict progression along the Inflammatory Arthritis disease continuum: implications for management

Frederique Ponchel et al. Sci Rep. .

Abstract

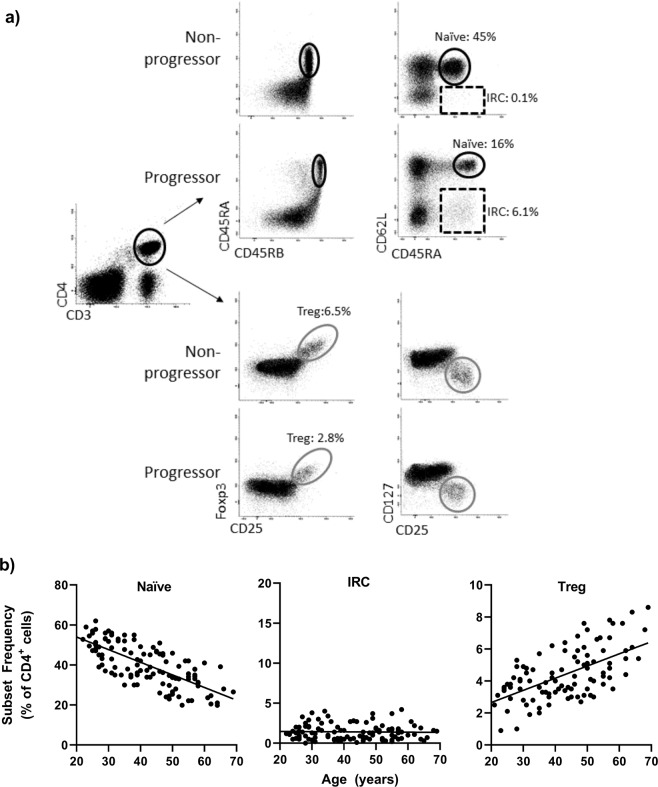
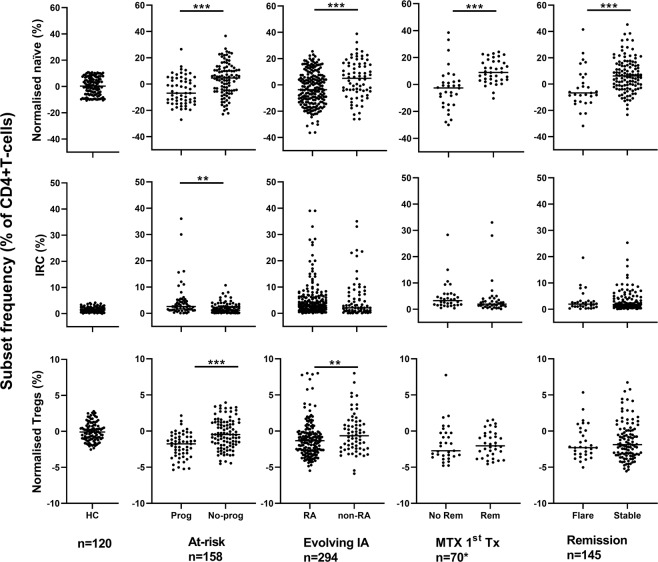
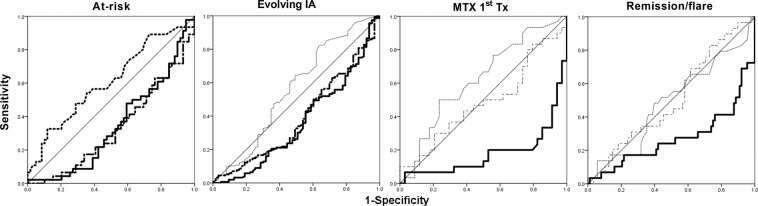
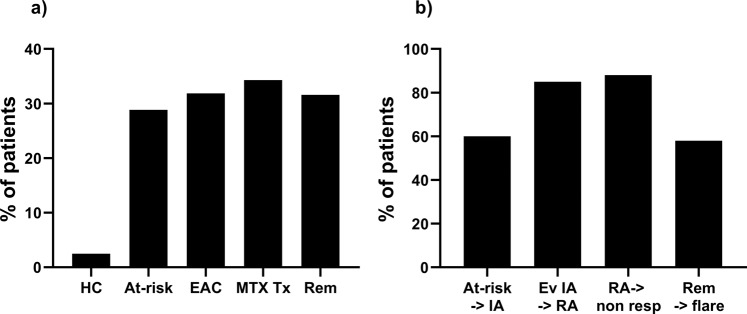
The presence of a disease continuum in inflammatory arthritis (IA) is a recognised concept, with distinct stages from at-risk stage (presence of anti citrullinated-peptide autoantibody) to diagnosis of rheumatoid arthritis (RA), including therapy-induced remission. Despite T-cell dysregulation being a key feature of RA, there are few reports of T-cell phenotyping along the IA-continuum. We investigated the disturbances of naïve, regulatory and inflammation related cell (IRC) CD4+ T-cell subsets in 705 individuals across the IA-continuum, developing a simple risk-score (summing presence/absence of a risk-associated with a subset) to predict progression from one stage to the next. In 158 at-risk individuals, the 3 subsets had individual association with progression to IA and the risk-score was highly predictive (p < 0.0001). In evolving IA patients, 219/294 developed RA; the risk-score included naïve and/or Treg and predicted progression (p < 0.0001). In 120 untreated RA patients, the risk-score for predicting treatment-induced remission using naïve T-cells had an odds ratio of 15.4 (p < 0.0001). In RA patients in treatment-induced remission, a score using naïve T-cells predicted disease flare (p < 0.0001). Evaluating the risk of progression using naïve CD4+ T-cells was predictive of progression along the whole IA-continuum. This should allow identification of individuals at high-risk of progression, permitting targeted therapy for improved outcomes.


Conflict of interest statement

The authors declare no competing interests.

Figures

Figure 1
Figure 1
Flow cytometry analysis. (a) Representative flow cytometry plot for naïve (circle, CD45RBhigh/CD45RA+/CD62L+), IRC (dotted box CD45RA+/CD62L-) and Treg (grey circle FoxP3+/CD25+/CD127−) following gating on CD3+ CD4+ T-cells. Difference between health and RA are highlighted for naïve/IRC subsets. (b) Established age relationship in 120 healthy controls for naïve and Treg CD4+ T-cells. [expected naïve] = −0.63 ×[age] +66.6 (rho = 0.850, p < 0.0001); [expected Treg] = +0.061 ×[age] +1.83 (rho = 0.554, p = 0.001). IRC were not related to age. IRC were considered high when above the 95% CI of distribution (set at 4%).
Figure 2
Figure 2
Natural history of CD4+ T-cell subset alongside the IA Continuum. T-cell subsets were quantified and data were normalised for naïve and Treg cells. Data are presented in dot plots related to the outcome at each stage of the IA continuum. Individual highly significant difference (MWU tests) are highlighted by ***(P < 0.0001) and significant difference by **(P < 0.01).
Figure 3
Figure 3
Individual ROC analysis for each T-cell subset. AUROC data are presented in Table 2. Naïve: full line, IRC: dotted line, Treg: dot-dash line. Significant AUC are indicated by bold line.
Figure 4
Figure 4
At each stage of the IA continuum. (a) Prevalence of participants (%) stratified as having a high-risk of progression to the next stage/outcome using naive T-cells. HC healthy control (n = 120); at-risk cohort (n = 158); EAC early arthritis clinic (n = 294); MTX tx: methotrexate treated early RA (n = 120); Rem: RA in remission group (n = 145). (b) Prevalence of participants (%) categorised as high-risk using naïve T-cells, who actually progressed to the next stage/outcome. At-risk -> IA: at-risk individual progressing to IA; ev IA −>RA: evolving IA patients progressing to RA; RA- > non-resp: RA patients treated with MTX, not achieving response; Rem->flare: RA patients achieving remission on sc-DMARD and flaring during follow-up.

References

    1. Lindhardsen J, et al. The risk of myocardial infarction in rheumatoid arthritis and diabetes mellitus: a Danish nationwide cohort study. Annals of the rheumatic diseases. 2011;70:929–934. doi: 10.1136/ard.2010.143396. - DOI - PubMed
    1. Quinn M, Emery P. Window of opportunity in early rheumatoid arthritis: possibility of altering the disease process with early intervention. Clinical and experimental rheumatology. 2003;21:S154–S157. - PubMed
    1. Nell V, et al. Benefit of very early referral and very early therapy with disease-modifying anti-rheumatic drugs in patients with early rheumatoid arthritis. Rheumatology. 2004;43:906–914. doi: 10.1093/rheumatology/keh199. - DOI - PubMed
    1. van der Linden MP, et al. Long‐term impact of delay in assessment of patients with early arthritis. Arthritis & Rheumatology. 2010;62:3537–3546. doi: 10.1002/art.27692. - DOI - PubMed
    1. Mankia K, Emery P. Review: Preclinical Rheumatoid Arthritis Progress Toward Prevention. Arthritis &. Rheumatology. 2016;68:779–788. - PubMed

Publication types