. 2020 Feb 28;10(1):3775.
doi: 10.1038/s41598-020-60769-x.

A developed serum-free medium and an optimized chemical cocktail for direct conversion of human dermal fibroblasts into brown adipocytes

Affiliations

A developed serum-free medium and an optimized chemical cocktail for direct conversion of human dermal fibroblasts into brown adipocytes

Yukimasa Takeda et al. Sci Rep. .

Abstract

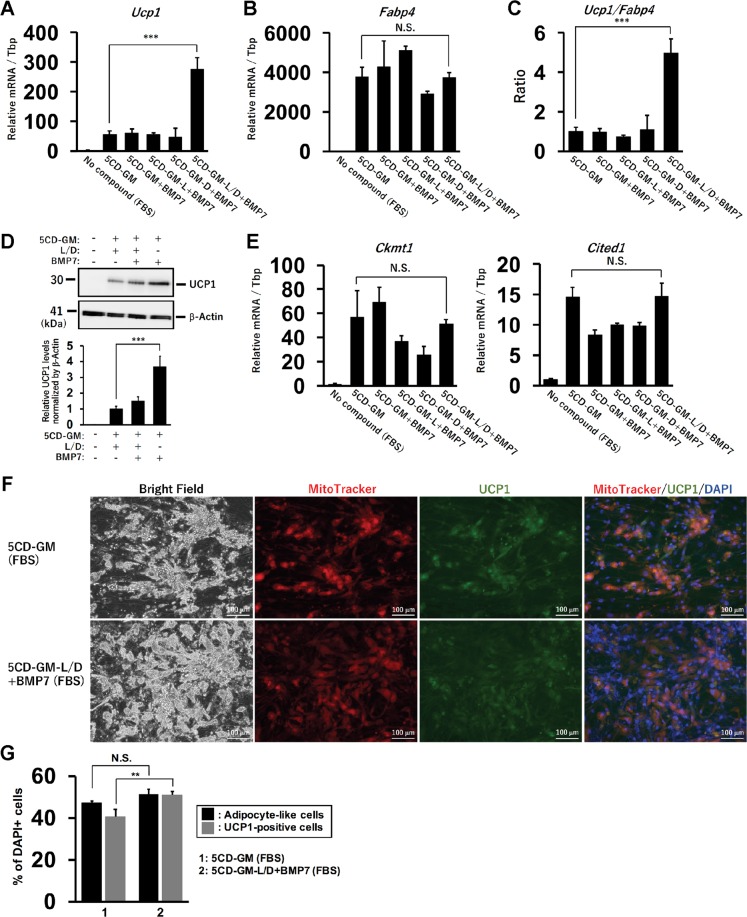
Brown adipocytes coordinate systemic energy metabolism associated with the pathogenesis of obesity and related metabolic diseases including type 2 diabetes. We have previously reported chemical compound-induced brown adipocytes (ciBAs) converted from human dermal fibroblasts without using transgenes. In this study, to reveal a precise molecular mechanism underlying the direct conversion and human adipocyte browning, we developed serum-free brown adipogenic medium (SFBAM) with an optimized chemical cocktail consisting of Rosiglitazone, Forskolin, and BMP7. During the direct conversion, treatment with BMP7 enhanced Ucp1 expression rather than the conversion efficiency in the absence of BMP signalling inhibitors. Moreover, treatment with a TGF-β signalling pathway inhibitor was no longer required in the serum-free medium, likely because the TGF-β pathway was already suppressed. SFBAM and the chemical cocktail efficiently converted human dermal fibroblasts into ciBAs within four weeks. The ciBAs exhibited increased mitochondrial levels, elevated oxygen consumption rate, and a response to β-adrenergic receptor agonists. Thus the ciBAs converted by the serum-free medium and the chemical cocktail provide a novel model of human brown (beige) adipocytes applicable for basic research, drug screening, and clinical applications.


Conflict of interest statement

The authors declare no competing interests.

Figures

Figure 1
Figure 1
BMP7 treatment enhances Ucp1 expression in the chemical compound-induced brown adipocytes (ciBAs) from human dermal fibroblasts. (A,B) The expression of Ucp1 (A) and Fabp4 (B) was quantified by qRT-PCR. Human dermal fibroblasts were treated with BMP7 and the chemical cocktail, 5CD-GM, in the FBS-containing adipogenic medium. Either or both of BMP signalling inhibitors, LDN-193189 (L) and Dorsomorphin (D) were removed from the 5CD-GM as indicated. (C) The ratio of Ucp1 to Fabp4 expression was calculated to evaluate a brown phenotype under each experimental condition. (D) UCP1 protein levels were quantified by western blotting analysis. The band intensities were quantified by densitometry using ImageJ software. β-Actin was used as a loading control for normalization. (E) qRT-PCR analyses of other human brown adipocyte-specific genes, Ckmt1 and Cited1. (F) Representative images of bright field, mitochondrial labelling with MitoTracker (red), UCP1 protein expression (green), and merged image in ciBAs induced by either 5CD-GM or 5CD-GM-L/D+BMP7 in the FBS-containing medium. The nuclei were visualized by DAPI (blue). Scale bars represent 100 μm. (G) To evaluate the conversion efficiency, the percent ratio of adipocyte-like cells with lipid droplets and UCP1-positive cells were calculated. Data represent mean ± SD. Student’s t-test: **P < 0.01, ***P < 0.001, N.S.; not significant.
Figure 2
Figure 2
The serum-free brown adipogenic medium enables the direct conversion into ciBAs. (A,B) The expression of Ucp1 (A) and Fabp4 (B) was quantified by qRT-PCR in ciBAs induced by the combination of either 5CD-GM or 5CD-GM-L/D+BMP7 in the serum-free brown adipogenic medium (SFBAM). (C) The ratio of Ucp1 to Fabp4 expression was calculated to evaluate a brown phenotype in these ciBAs. (D) UCP1 protein levels were evaluated by western blotting analysis. The band intensities were quantified by densitometry. β-Actin was used as a loading control for normalization. (E) qRT-PCR analyses of other human brown adipocyte specific genes, Ckmt1 and Cited1. (F) Cell viability was measured using the WST-8 reagent in ciBAs induced by either 5CD-GM or 5CD-GM-L/D+BMP7 in SFBAM. Cytotoxicity was assessed by measuring lactate dehydrogenase (LDH) activity in the culture supernatants. (G) Representative images of bright field, MitoTracker (red), UCP1 protein (green), and merged image in ciBAs induced by either 5CD-GM or 5CD-GM-L/D+BMP7 in SFBAM. The nuclei were visualized by DAPI (blue). Scale bars represent 100 μm. (H) To evaluate the conversion efficiency, the percent ratio of adipocyte-like cells and UCP1-positive cells was calculated. Data represent mean ± SD. Student’s t-test: **P < 0.01, ***P < 0.001, N.S.; not significant.
Figure 3
Figure 3
TGF-β signalling pathway inhibitor, SB-431542, is dispensable for the conversion of ciBAs in the serum-free medium. (A) Ucp1 expression was quantified by qRT-PCR in ciBAs induced by the combination of 5CD-GM-L/D+BMP7 either with or without SB-431542 in the FBS-containing medium. UCP1 protein levels were quantified by western blotting analysis. β-Actin is a loading control. (B) Ucp1 expression was quantified by qRT-PCR in ciBAs induced by the same combinations in SFBAM. UCP1 protein levels were quantified by western blotting analysis. (C) Bright-field images of ciBAs induced by the combinations either with or without SB-431542 in SFBAM. Scale bars represent 100 μm. (D) During the conversion to ciBAs with the combination of RoFB (Rosiglitazone, Forskolin, and BMP7) in SFBAM, a TGF-β ligand, either TGF-β1 or TGF-β3, and SB-431542 were treated as indicated. The expression of Ucp1, Ckmt1, and Fabp4 was quantified by qRT-PCR. (E) Phosphorylated-SMAD2/3 and total SMAD2/3 proteins were detected by immunoblotting. The band intensities were quantified by densitometry. Data represent mean ± SD. Student’s t-test: ***P < 0.001.
Figure 4
Figure 4
Requirement of each component consisting of the chemical cocktail and SFBAM for the ciBA conversion. (A, B) The expression of Ucp1 (A) and Fabp4 (B) was quantified by qRT-PCR in ciBAs induced by RoFB in SFBAM. Each component, Rosiglitazone (Ro), Forskolin (F), and BMP7, was removed from the combination of RoFB as indicated. (C,D) The expression of Ucp1 (C) and Fabp4 (D) was quantified in ciBAs induced by RoFB in SFBAM. Each component, T3, Dexamethasone (Dex), IBMX, insulin (Ins), and L-ascorbic acid 2-phosphate (AA2P) was removed from SFBAM as indicated. (E, F) The expression of human brown adipocyte marker genes (E) and adipocyte-enriched genes (F) was evaluated by qRT-PCR in ciBAs induced by RoFB in SFBAM for 3 weeks. (G, H) qRT-PCR analyses of zinc finger protein of cerebellum 1, Zic1 (G), and fibroblast marker genes, Col1a2 and Fsp1 (H). Data represent mean ± SD. Student’s t-test: *P < 0.05, **P < 0.01, ***P < 0.001, N.S.; not significant.
Figure 5
Figure 5
Optimization of period for ciBA induction by RoFB in SFBAM. (A) The expression of brown adipocyte-specific genes, Ucp1, Ckmt1, and Cited1, was quantified by qRT-PCR in ciBAs induced by RoFB in SFBAM from 1 to 5 weeks as indicated. “C” at the first lane represents the expression level of control fibroblasts treated with SFBAM only for 5 weeks. “Ro” at the second lane represents the expression level of the fibroblasts treated with Rosiglitazone only in SFBAM for 5 weeks. (B) qRT-PCR analyses of adipocyte-enriched genes, Fabp4 and AdipoQ. (C) The expression of Ucp1, Ckmt1, and Cited1, was quantified in ciBAs induced by RoFB in SFBAM from 1 to 4 weeks as indicated, followed by incubation with the serum-free brown adipogenic maintenance medium, SFBAMaM, for another 1 week. In this experimental scheme, black bars represent the induction period with RoFB (SFBAM), while grey bars represent the maintenance step with SFBAMaM for 1 week after the induction. (D) qRT-PCR analyses of adipocyte-enriched genes, Fabp4 and AdipoQ, were quantified. Data represent mean ± SD. Student’s t-test: **P < 0.01, ***P < 0.001. (E) Representative images of bright field, MitoTracker (red), UCP1 protein (green), and merged image in the ciBAs induced by either RoFB (SFBAM) for 4 weeks or RoFB (SFBAM) for 4 weeks followed by incubation with SFBAMaM for another 1 week. The nuclei were visualized by DAPI (blue). Scale bars represent 100 μm.
Figure 6
Figure 6
Increased oxygen consumption rate (OCR) in ciBAs induced by RoFB in SFBAM. (A) OCR was measured using the Flux analyzer in the control cells incubated with SFBAM only (grey circles) and ciBAs induced by RoFB in SFBAM (black diamonds). Oligomycin, FCCP, and Antimycin A/Rotenone were added during the measurement to final concentrations of 2, 0.3, and 0.5 μM, respectively. (B) The OCR corresponding to basal respiration, proton leak, maximal respiration, ATP production, and spare capacity was compared between the control and ciBAs. Data represent mean  ± SEM (n = 5). Student’s t-test: *P < 0.05, **P < 0.01. (C) Energy phenotype profile in the control cells (grey circles) and ciBAs (black diamonds). OCR and extracellular acidification rate (ECAR) were plotted under basal (open circle and diamond) and stressed condition (closed circle and diamond). Stressed condition was induced by the treatment with both Oligomycin and FCCP. The response to an induced energy demand under the stressed condition is represented as metabolic potential. (D) Induced expression of Ucp1 mRNA was quantified in the control cells and ciBAs after treatment with either vehicle control (H2O), isoproterenol (Iso) at 1 μM, or norepinephrine (NE) at 2 μM for 6 hr. The ciBAs were induced by RoFB (SFBAM) for 3 weeks followed by SFBAMaM for 1 week. (E) Mitochondria were stained with MitoTracker in the control cells and ciBAs. Scale bars represent 100 μm. (F) Mitochondrial DNA levels were determined by qPCR analysis between the control and ciBAs. The DNA levels were normalized by nuclear DNA. (G) qRT-PCR analyses of mitochondrial marker genes, MT-CO3, Cox4, MT-CYB, and MT-ND5. (H) Mitochondrial marker proteins, COX4 and VDAC1, were quantified by immunoblotting. The band intensities were quantified and normalized by β-Actin loading control. Data represent mean ± SD. Student’s t-test: *P < 0.05, **P < 0.01, ***P < 0.001.

References

    1. Takeda Y, Harada Y, Yoshikawa T, Dai P. Chemical compound-based direct reprogramming for future clinical applications. Biosci. Rep. 2018;38:1–19. doi: 10.1042/BSR20171650. - DOI - PMC - PubMed
    1. Xu J, Du Y, Deng H. Direct lineage reprogramming: strategies, mechanisms, and applications. Cell Stem Cell. 2015;16:119–134. doi: 10.1016/j.stem.2015.01.013. - DOI - PubMed
    1. Wakao J, et al. Efficient direct conversion of human fibroblasts into myogenic lineage induced by co-transduction with MYCL and MYOD1. Biochem. Biophys. Res. Commun. 2017;488:368–373. doi: 10.1016/j.bbrc.2017.05.059. - DOI - PubMed
    1. Miyamoto K, et al. Direct in vivo reprogramming with Sendai virus vectors improves cardiac function after myocardial infarction. Cell Stem Cell. 2018;22:91–103. doi: 10.1016/j.stem.2017.11.010. - DOI - PubMed
    1. Nakamori D, Akamine H, Takayama K, Sakurai F, Mizuguchi H. Direct conversion of human fibroblasts into hepatocyte-like cells by ATF5, PROX1, FOXA2, FOXA3, and HNF4A transduction. Sci. Rep. 2017;7:16675. doi: 10.1038/s41598-017-16856-7. - DOI - PMC - PubMed

Publication types

MeSH terms