. 2020 Feb 28;10(1):3742.
doi: 10.1038/s41598-020-60745-5.

Neuronal contact guidance and YAP signaling on ultra-small nanogratings

Affiliations

Neuronal contact guidance and YAP signaling on ultra-small nanogratings

Ilaria Tonazzini et al. Sci Rep. .

Abstract

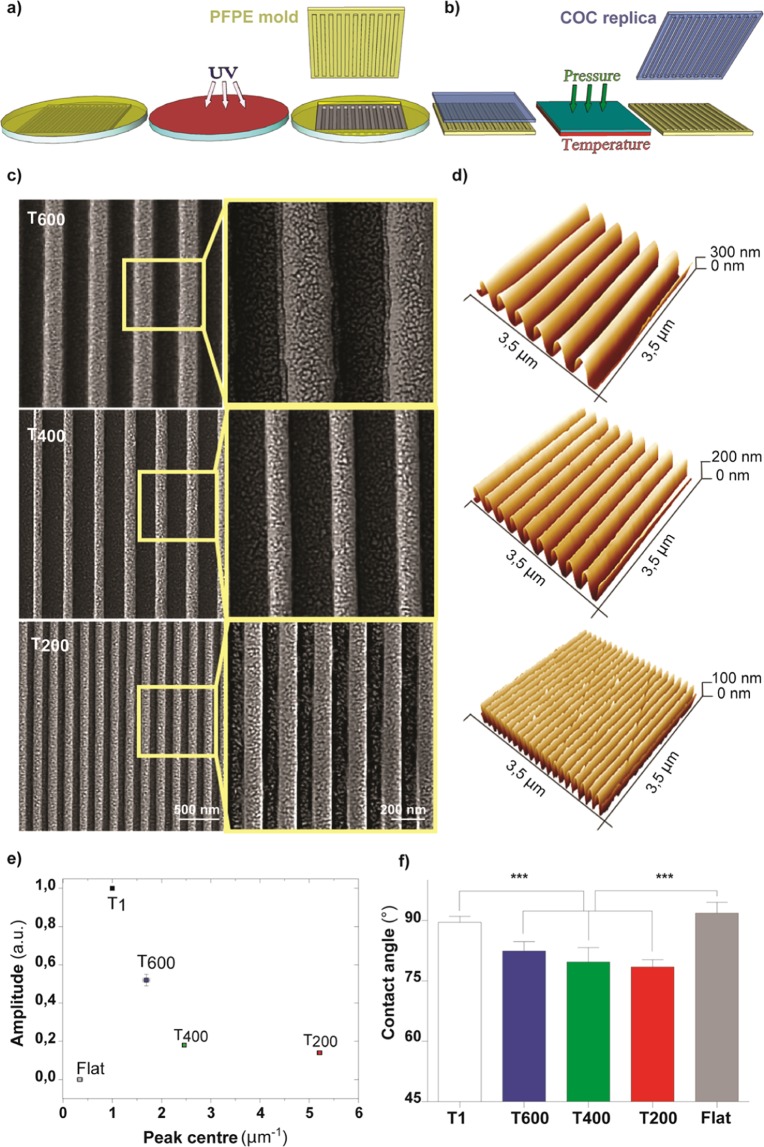
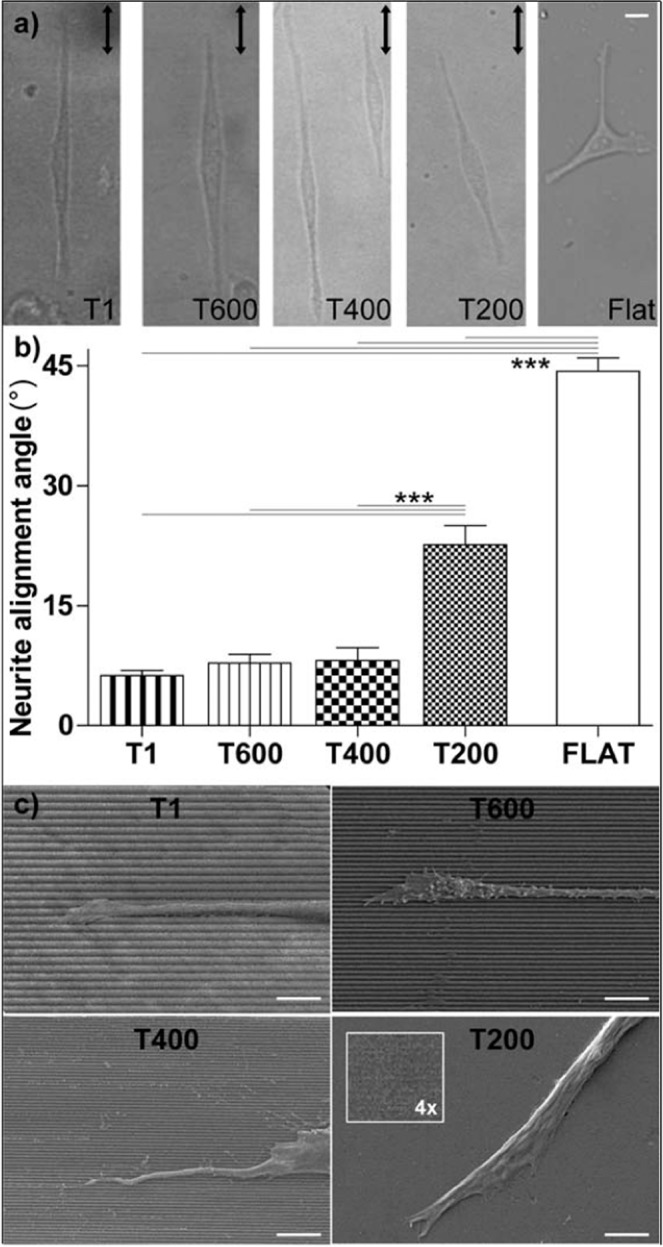
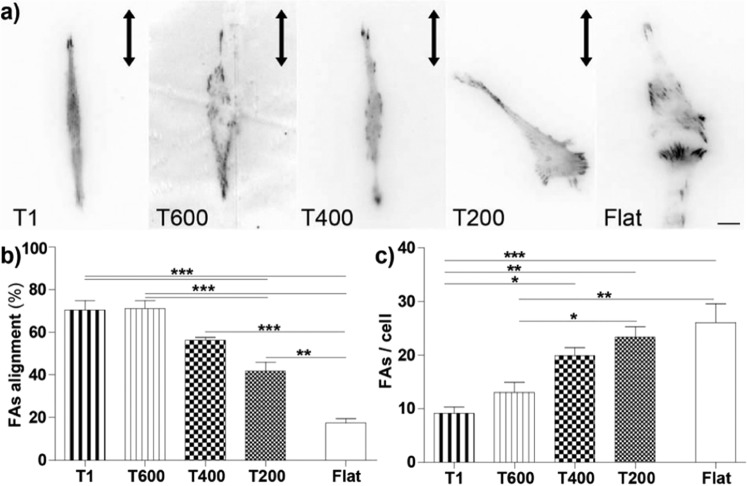
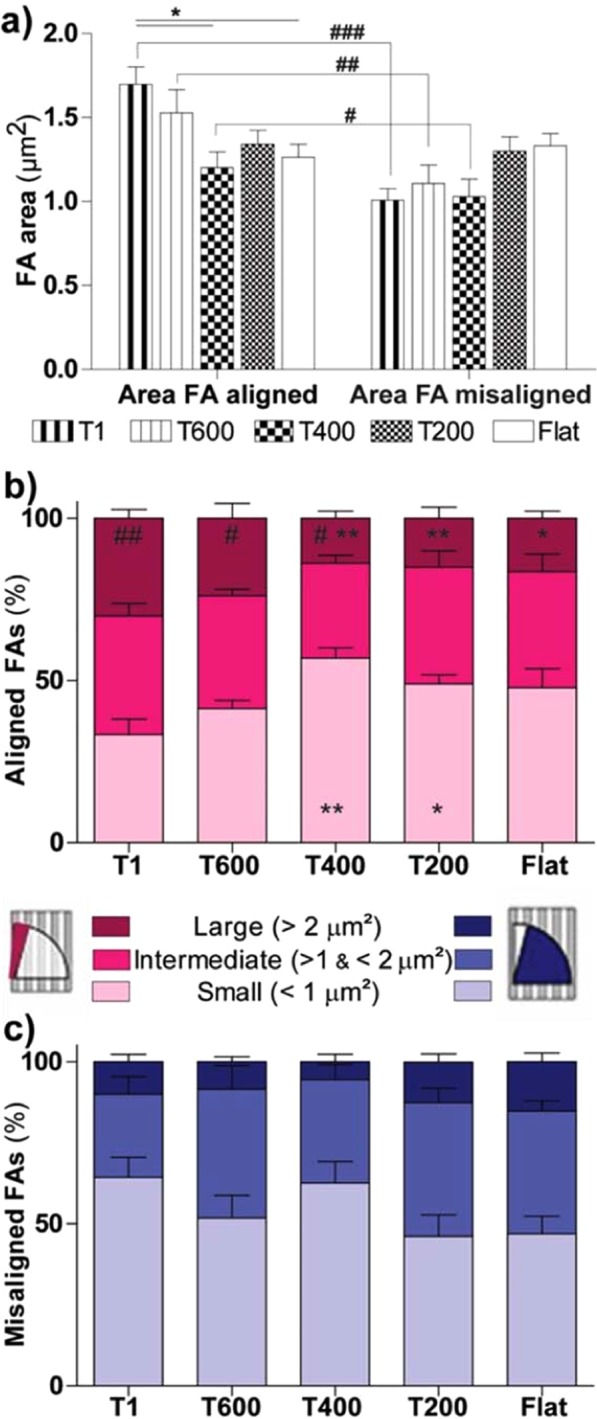
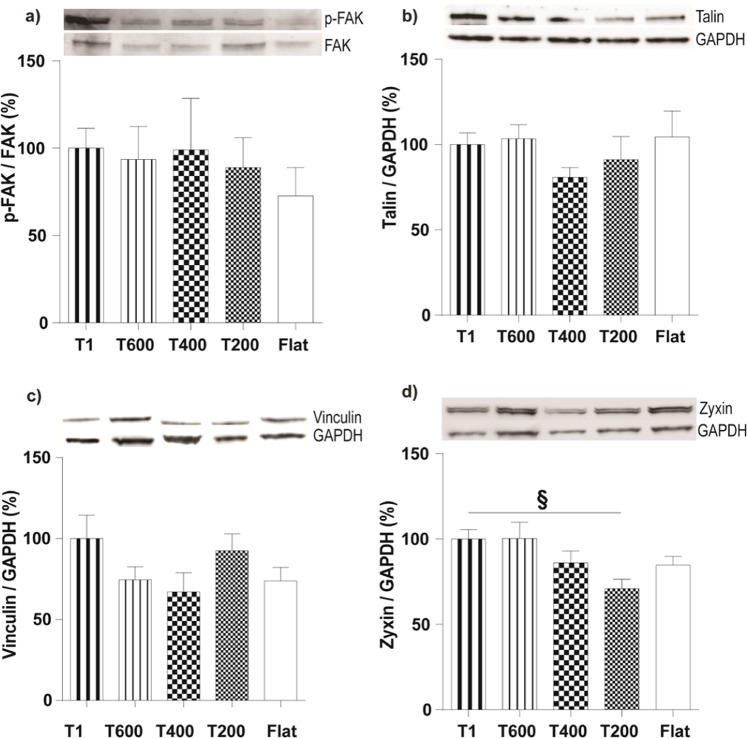
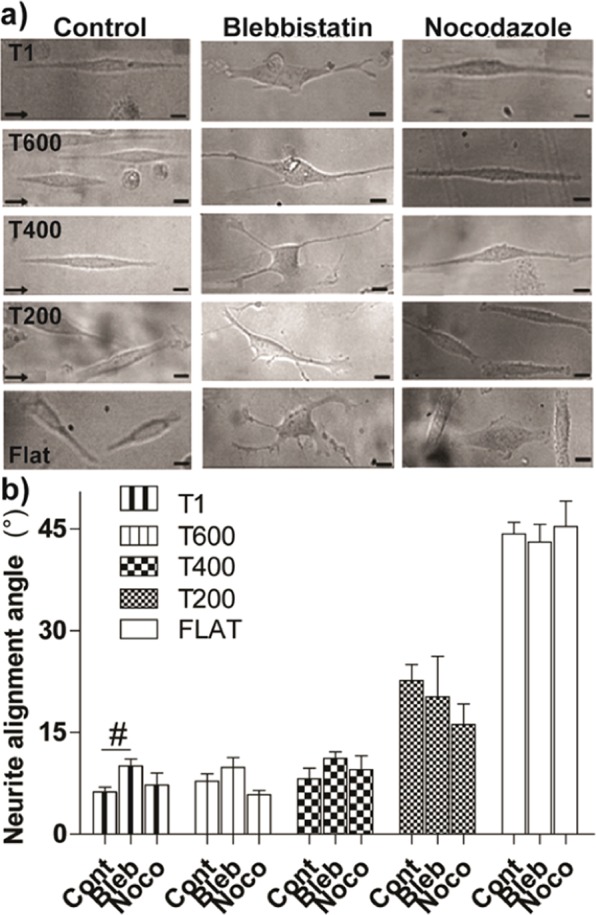
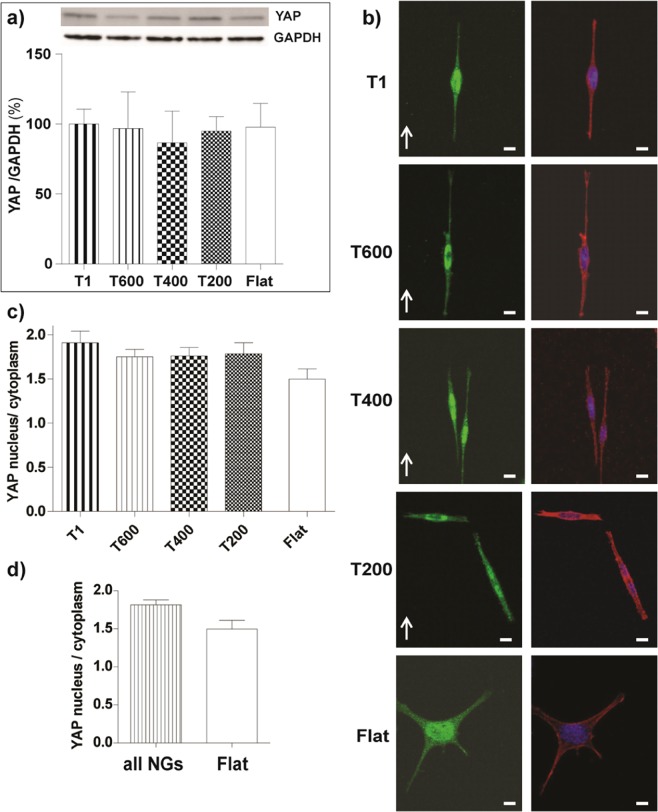
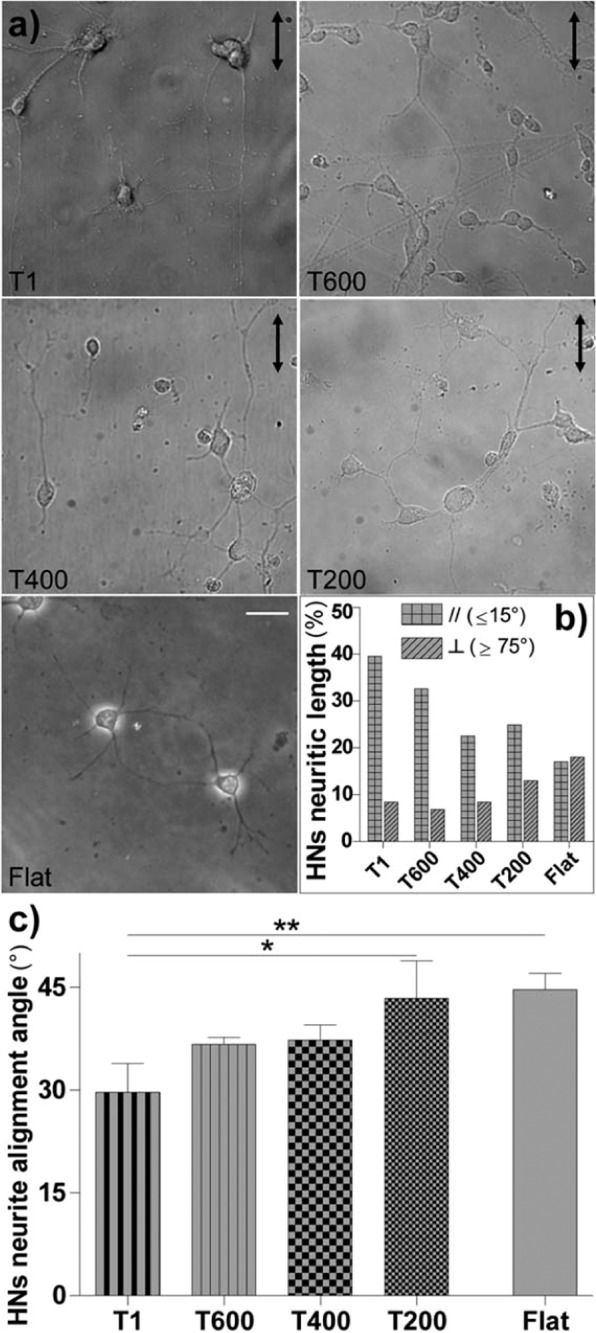
Contact interaction of neuronal cells with extracellular nanometric features can be exploited to investigate and modulate cellular responses. By exploiting nanogratings (NGs) with linewidth from 500 nm down to 100 nm, we here study neurite contact guidance along ultra-small directional topographies. The impact of NG lateral dimension on the neuronal morphotype, neurite alignment, focal adhesion (FA) development and YAP activation is investigated in nerve growth factor (NGF)-differentiating PC12 cells and in primary hippocampal neurons, by confocal and live-cell total internal reflection fluorescence (TIRF) microscopy, and at molecular level. We demonstrate that loss of neurite guidance occurs in NGs with periodicity below 400 nm and correlates with a loss of FA lateral constriction and spatial organization. We found that YAP intracellular localization is modulated by the presence of NGs, but it is not sensitive to their periodicity. Nocodazole, a drug that can increase cell contractility, is finally tested for rescuing neurite alignment showing mild ameliorative effects. Our results provide new indications for a rational design of biocompatible scaffolds for enhancing nerve-regeneration processes.


Conflict of interest statement

The authors declare no competing interests.

Figures

Figure 1
Figure 1
Ultra-small nanograting fabrication scheme and surface characterization. (a) PFPE intermediate mold (in yellow) fabrication via UV-crosslink process and (b) its use for the subsequent thermal NIL process to produce Cyclic Olefin Copolymer (COC) replicas (in light blue). (c) Representative Scanning Electron Microscopy images (with high magnification insets) of the COC NGs T600, T400 and T200. (d) AFM measurements of NG final COC replica, for 3.5 × 3.5 μm2 areas. (e) NG directionality signal amplitude by FFT analysis: the reported values were normalized to T1 value. ***P < 0.001 T1 vs. T600, T400, T200 and T600 vs. T400, T200; *P < 0.05 T400 vs. T200; One-way ANOVA Tukey’s test. (f) Contact angle measurements of COC NGs. ***P < 0.001 T1 vs. T600, T400, T200 and Flat vs. T600, T400, T200 (One-way ANOVA, Tukey’s test). All data are mean ± SD.
Figure 2
Figure 2
Neurite alignment along NGs. (a) Bright-field images of PC12 neuronal cells on T1, T600, T400, T200 and Flat, at 24 h; the arrows indicate the NG direction; scale bar = 10 μm. (b) Neurite alignment on NGs. ***P < 0.001 (One-way ANOVA, Tukey’s test); at least 300 cells –at least 450 neurites- were analyzed for each substrate and for each NG type we performed n ≥ 6 independent experiments. (c) Representative scanning electron microscopy (SEM) images of PC12 neurites on T1, T600, T400 and T200; scale bars = 5 μm.
Figure 3
Figure 3
Impact of reduced NG periodicity on FA assembly and spatial distribution. (a) EGFP-Paxillin rich adhesions on NGs imaged by TIRF microscopy; scale bar = 10 µm. (b) FA alignment on different NGs, reported as the % of FAs with alignment ≤ 15°. **/***P < 0.01/0.001 (One-way ANOVA, Tukey’s test). (c) Number of FAs per cell on different substrates. *P < 0.05, **P < 0.01 and ***P < 0.001 (One-Way ANOVA, Tukey’s test); at least 30 cells or 400 FAs were analyzed for each sample and for each NG type we performed n ≥ 4 independent experiments.
Figure 4
Figure 4
Impact of reduced substrate dimensionality on FA maturation. (a) Average FA area (µm2) is reported for aligned FAs (i.e. with alignment ≤ 15°; left panel) and for misaligned FAs (i.e. with alignment between 15° and 90°; right panel), on the different substrates. Aligned FA area vs. misaligned FA area: ###P < 0.001, ##P < 0.0, #P = 0.05 (Student’s t-test). Aligned FA area: *P < 0.05 T1 vs. T400 and Flat (One-Way ANOVA, Tukey’s test). (b) Distribution of FA size NGs. Size distribution of aligned (0–15°) FAs, as function of the substrate. The % of small (area ≤ 1 µm2), intermediate (1 < area ≤ 2 µm2) and large (area > 2 µm2) FAs is reported in light, normal and dark pink color, respectively. Small FAs: */**P < 0.05/0.01 vs. T1; Large FAs: */**P < 0.05/0.01 vs. T1; (One-Way ANOVA, Tukey’s test). c) Size distribution of misaligned (15–90°) FAs as function of the substrate. The % of small (area ≤ 1 µm2), intermediate (1 < area ≤ 2 µm2) and large (area > 2 µm2) FAs is reported in light, normal and dark blue color, respectively. Large-Aligned FAs (%) (darker pink columns-in (b) vs. Large-Misaligned FAs (%) (darker blue columns- in (c): ##P < 0.01 for T1, #P < 0.05 for T600 and T400, Student’s t-test. At least 30 cells or 400 FAs were analyzed for each sample and for each NG type we performed n ≥ 4 independent experiments.
Figure 5
Figure 5
Activation of the FA pathway in PC12 cells growing on ultra-small NGs. Representative Western-blot panels (from the same gels; full-length gels are included in Fig. S3) and blot analysis of phospho-FAK/FAK (a), talin (b), vinculin (c), and zyxin (d) levels. Results (normalized to GAPDH levels) were reported in % with respect to T1 levels. d) *P < 0.05 T1 vs. T200 (One-Way ANOVA, Dunnett’s test); n ≥ 4.
Figure 6
Figure 6
Neurite alignment along ultra-small NGs: role of cell contractility. (a) Bright-field images (Top panel) of PC12 neuronal cells on different NGs, in control conditions and in presence of blebbistatin 25 µM (Bleb) and nocodazole 10 nM (Noco); the arrows indicate the NG direction; scale bars = 10 μm. (b) Neurite alignment on NGs: #P < 0.05 T1-Cont vs. T1-Bleb, Student’s t-test. Data are reported as mean ± SEM (At least 300 cells - 450 neurites- were analyzed for each substrate in control conditions (n ≥ 6), and 110 cells - 180 neurites- for each substrate with drugs’ treatments (n ≥ 3).
Figure 7
Figure 7
Activation of the YAP/TAZ pathway in PC12 cells differentiating on ultra-small NGs. (a) Representative Western-blot panels (from the same gel; full-length gels are included in Fig. S3) and blot analysis of YAP 1 expression levels. Results (normalized to GAPDH levels) were reported in % (with respect to T1 levels; n ≥ 3. (b) Confocal representative images of YAP (green, first column) and actin fibers (red) with nuclear (blue) staining in PC12 cells on different substrates; scale bars = 10 μm. (c) YAP intracellular localization: YAP activation is reported as YAP nuclear/cytoplasmic ratio on different substrates; at least 25 cells were analyzed for each sample (n ≥ 3). (d) YAP nuclear/cytoplasmic ratio on all NGs- pooled together and Flat surfaces: #P < 0.01 NGs vs. Flat (Student’s t-test).
Figure 8
Figure 8
Impact of ultra-small NGs on hippocampal primary neurons (HNs). (a) Bright-field images of HNs from wild-type mice on T1, T600, T400, T200 and Flat, at day-in-vitro (div) 2; the arrows indicate the NG direction; scale bar = 25 μm. (b) HNs network development on ultra-small NGs: we quantified the % of HNs aligned network- i.e. the sum of all neurites with angle 0–15° vs. NG direction (squared columns)- and the % of perpendicular network- i.e. with angle 75–90° vs. NG direction (striped columns)- over the total neuronal network analyzed. (c) Neurite alignment angle of HNs on ultra-small NGs. *P < 0.05 T1 vs. T200, **P < 0.01 T1 vs. Flat (One-way ANOVA, Tukey’s test). We performed n = 4 independent experiments for T1, and n = 2 independent experiments for T600-T400-T200, with at least 15 neurons analyzed for each substrate; data = mean ± SD.

Similar articles

Cited by

References

    1. Balgude A. Agarose gel stiffness determines rate of DRG neurite extension in 3D cultures. Biomaterials. 2001;22(10):1077–1084. doi: 10.1016/S0142-9612(00)00350-1. - DOI - PubMed
    1. Engler AJ, Sen S, Sweeney HL, Discher DE. Matrix elasticity directs stem cell lineage specification. Cell. 2006;126:677–89. doi: 10.1016/j.cell.2006.06.044. - DOI - PubMed
    1. Adams Josephine C., Watt Fiona M. Fibronectin inhibits the terminal differentiation of human keratinocytes. Nature. 1989;340(6231):307–309. doi: 10.1038/340307a0. - DOI - PubMed
    1. Rosso Francesco, Giordano Antonio, Barbarisi Manlio, Barbarisi Alfonso. From Cell-ECM interactions to tissue engineering. Journal of Cellular Physiology. 2004;199(2):174–180. doi: 10.1002/jcp.10471. - DOI - PubMed
    1. Hoffman-Kim Diane, Mitchel Jennifer A., Bellamkonda Ravi V. Topography, Cell Response, and Nerve Regeneration. Annual Review of Biomedical Engineering. 2010;12(1):203–231. doi: 10.1146/annurev-bioeng-070909-105351. - DOI - PMC - PubMed

Publication types

Substances