. 2020 Feb 28;10(1):3701.
doi: 10.1038/s41598-020-60619-w.

Rigorous characterization of urinary extracellular vesicles (uEVs) in the low centrifugation pellet - a neglected source for uEVs

Affiliations

Rigorous characterization of urinary extracellular vesicles (uEVs) in the low centrifugation pellet - a neglected source for uEVs

Luca Musante et al. Sci Rep. .

Abstract

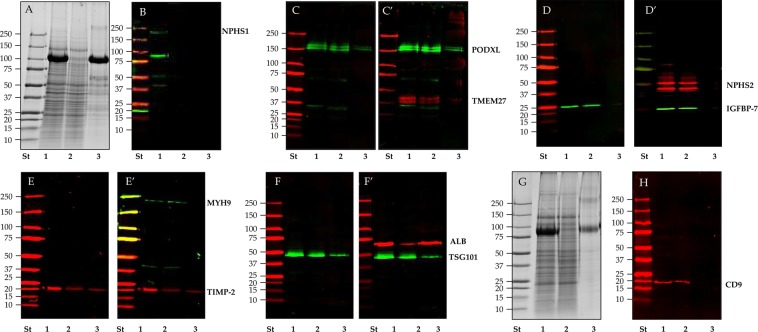
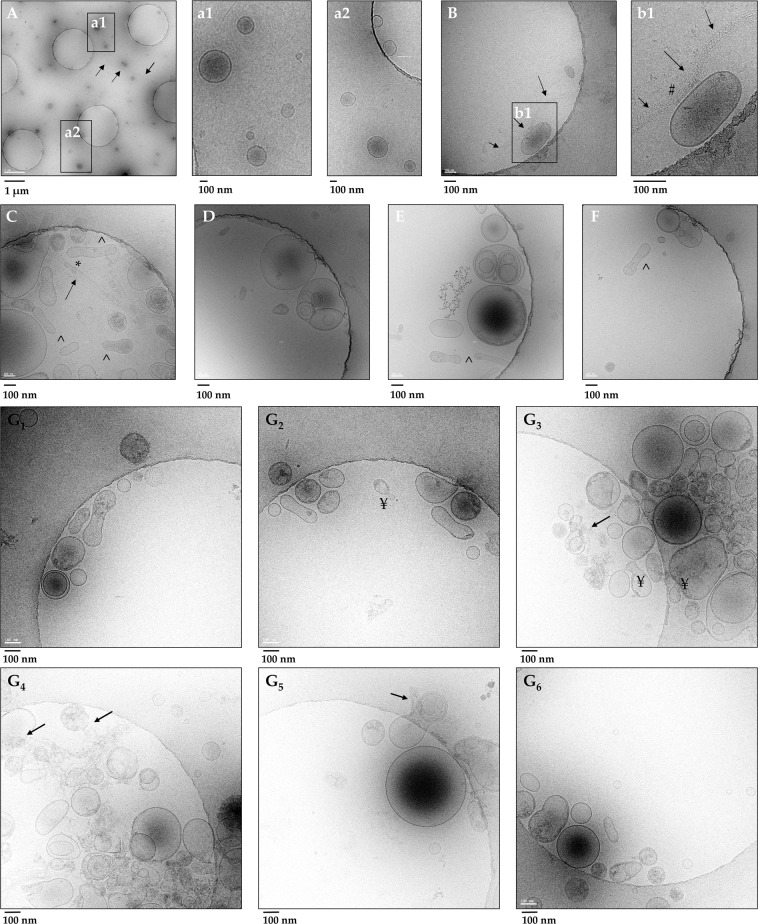
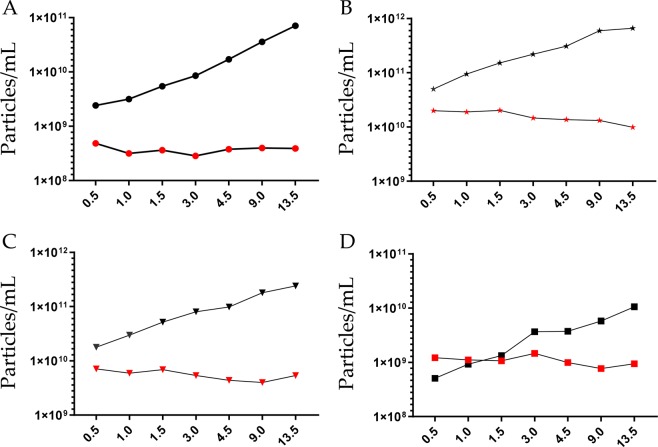
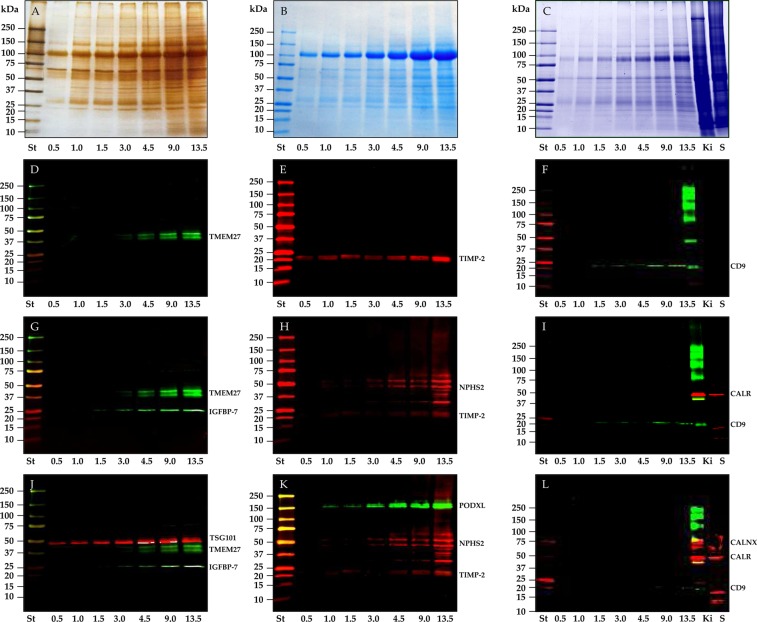
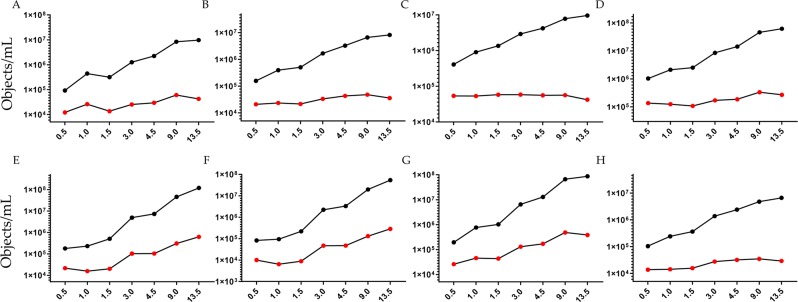
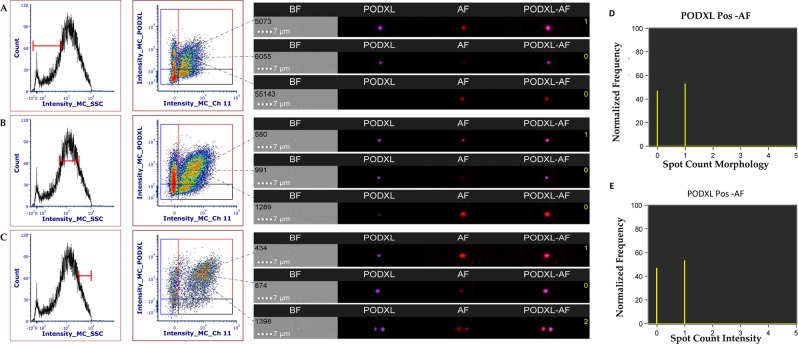
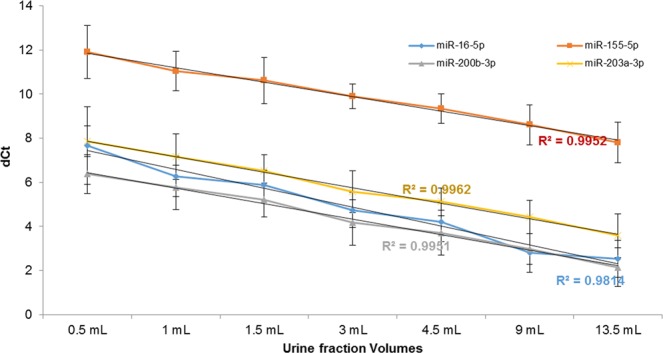
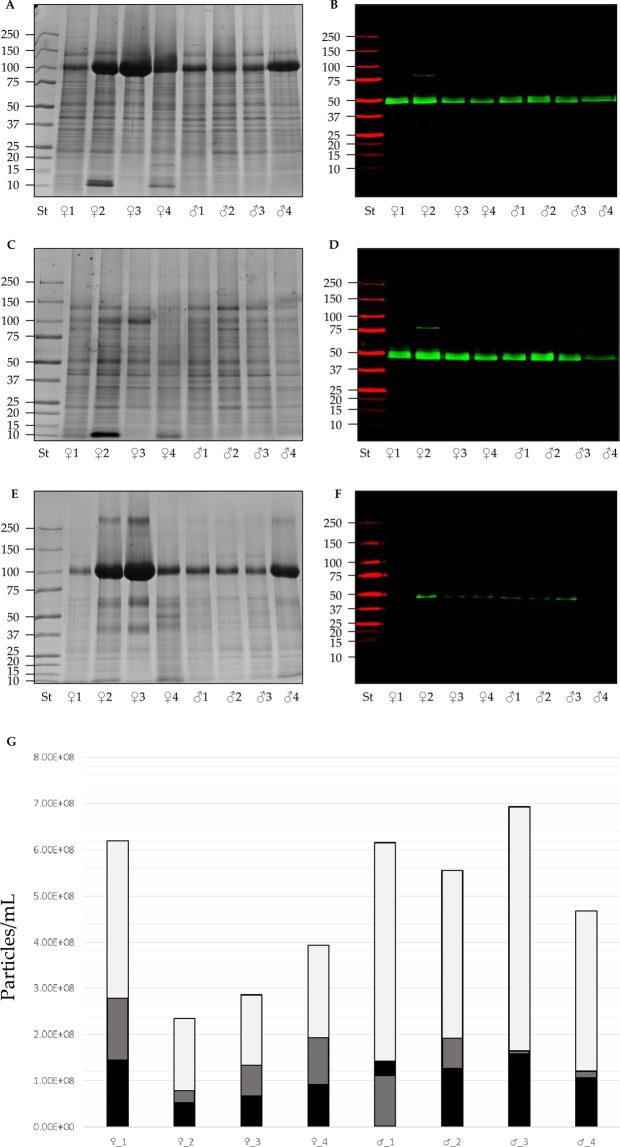
Urinary extracellular vesicles (uEVs) provide bio-markers for kidney and urogenital diseases. Centrifugation is the most common method used to enrich uEVs. However, a majority of studies to date have focused on the ultracentrifugation pellet, potentially losing a novel source of important biomarkers that could be obtained at lower centrifugation. Thus, the aim of this study is to rigorously characterize for the first time uEVs in the low speed pellet and determine the minimal volume of urine required for proteomic analysis (≥9.0 mL urine) and gene ontology classification identified 75% of the protein as extracellular exosomes. Cryo-Transmission Electron Microscopy (≥3.0 mL urine) provided evidence of a heterogeneous population of EVs for size and morphology independent of uromodulin filaments. Western blot detected several specific uEV kidney and EV markers (≥4.5 mL urine per lane). microRNAs quantification by qPCR was possible with urine volume as low as 0.5 mL. Particle enumeration with tunable resistive pulse sensing, nano particles tracking analysis and single EV high throughput imaging flow cytometry are possible starting from 0.5 and 3.0 mL of urine respectively. This work characterizes a neglected source of uEVs and provides guidance with regard to volume of urine necessary to carry out multi-omic studies and reveals novel aspects of uEV analysis such as autofluorescence of podocyte origin.


Conflict of interest statement

The authors declare no competing interests.

Figures

Figure 1
Figure 1
SDS-polyacrylamide gel electrophoresis (SDS-PAGE) and western blot (WB) analysis of P21 pellet after TCEP reduction in healthy donors. Pellets P21 (lane 1), P21TCEP (lane 2) and SN21TCEP (lane 3) originated from 9 (A,CH) and 20 ml (B) of urine were loaded in each lane and stained with colloidal Coomassie (A,G). Nitrocellulose membranes were hybridized respectively with anti: podocalyxin (PODXL) (C) and collectrin (TMEM27) (C’); Insulin-like growth factor binding protein 7 (IGFBP-7) (D) and podocin (NPHS2) (D’); Tissue inhibitor of metalloproteinases 2 (TIMP-2) (E) and myosin 9 (MYH9) (E’); Tumor susceptibility gene 101 (TSG101) (F) and human serum albumin (ALB) (F’); Nephrin (NPHS1) (B) and CD9 antigen (CD9) (H). No reducing condition (-DTT) for CD9 WB (H) and respective protein patter gel (G). After the first acquisition the same membranes in panel C (PODXL), D (IGFBP-7), E (TIMP-2) and F (TSG101) were incubated again with anti TMEM 27(C’), anti NPHS2 (D’), anti MYH9 (E’) and ALB (F’).
Figure 2
Figure 2
Gallery of Cryo-TEM images of urinary EVs recovered in the relative low centrifugation pellet P21 before and after TCEP reduction (P21TCEP). A heterogeneous population of uEVs was observed including single layered vesicles and multiyered structure with two or more inner small vesicles encapsulated inside bigger vesicles before (AF) and after TCEP treatment (G1G6). Tamm-Horsfall protein (THP) long polymeric filaments (indicated by arrows) (A) either engulfing (*) (C) or adsorbing (#) vesicles (B and b1) were also visible. No filaments of THP were visible (G1G6) after TCEP reduction.
Figure 3
Figure 3
Particle size distribution and concentration. (A) Tunable resistive pulse sensing of P21 pellet; (B) Nanoparticle tracking analysis (NTA) of P21 pellet; C NTA of P21TCEP pellet and (D) P21TCEP supernatant. Black marks represent the particle concentration of re-solubilized pellet, red marks refer to the particles concentration per mL of urine. X- axis represent volume of urine (mL) processed to obtain the uEV pellet. Pellets for TRPS were re-solubilized in 100 μL of PBS-0.1μm (A). Pellets for NTA were resolubilized in 200 μL of 10 mM Tris-HCl pH8.8 + 4 mM TCEP- for P21 (B) and P21TCEP (C) pellets and 1.2 mL 110 mM Tris-HCl pH8.8 + 4 mM TCEP for SN21TCEP (D).
Figure 4
Figure 4
SDS-polyacrylamide gel electrophoresis (SDS-PAGE) and western blot (WB) analysis of P21 pellet. The whole pellet - originated from different volumes - was loaded in each lane and stained with either silver nitrate (A) or colloidal Coomassie (B,C). Nitrocellulose membranes were hybridized respectively with: collectrin (TMEM27) (D) and tissue inhibitor of metalloproteinases 2 (TIMP-2) and CD9. After the first image acquisition the same membranes were incubated again with insulin-like growth factor binding protein 7 (IGFBP-7) (G), podocin (NHPS2) (H) and calreticulin (CALR) (I) respectively. Finally membranes were incubated a 3rd time with tumor susceptibility gene 101 (TSG101) (J), podocalyxin (PODXL) (K) and calnexin (L) respectively. Samples for gel in C and western blots in (F,I,L) were run without DTT. K rat kidney, S Saliva pellet 4.600 g.
Figure 5
Figure 5
Imaging flow cytometry quantification. Concentration obtained by gating positive events (Supplementary Fig. S13) of: (A) IGFBP7; (B) TIMP2; (C) TMEM27; (D) AnnexinV; (E) Autofluorescence emission in channel 5; (F) Auto fluorescence emission in channe 11; (G) PODXL (F) PODXL without autofluorescence excluded applying the Boolean or logic function: “Not AF gate Ch5 And Not AF gate Ch11”. Black marks particles concentration of re-solubilized pellets, red marks particles concentration per mL of urine. X-axis shows the volume of urine (mL) processed to obtain the uEVs pellet.
Figure 6
Figure 6
Imaging flow cytometry quantification single staining for PODXL. Co-detection of PODXL and AF emission in channel 11 at low (A), medium (B) and high (C) scatter based on the gate strategy in Supplementary Fig. S19. Application of morphology (D) and intensity (E) masks combined with the spot count feature show the number of coincidence event. Yellow digits in the image gallery indicate the number of events calculated by the spot feature.
Figure 7
Figure 7
Real time quantitative PCR (qPCR) analysis of P21 pellet. RNA from the whole P21 pellet - originated from different volumes - was isolated and reverse-transcribed. qPCR analysis for miR-16 (blue), miR-155 (red), miR-200b (gray), and miR-203 (yellow) was performed and the relative cycle threshold values (dCt) were plotted for each of the volumes. The trend line with the R2 value indicates that the amount of miRNA increased with the increased volume of urine used for processing the pellet.
Figure 8
Figure 8
SDS-polyacrylamide gel electrophoresis (SDS-PAGE), western blot (WB) analysis and particles concentration of P21, P21TCEP pellets and SN21TCEP supernatants after TCEP reduction in healthy donors. Pellets and TCEP supernatant originated from 9 mL of urine from 4 female (lane1-4) and 4 male (lane 5–8) were loaded in each lane and stained with colloidal Coomassie or hybridized with anti tumor susceptibility gene 101 (TSG101) for P21 pellets (A,B), P21TCEP pellets (C,D) and SN21TCEP supernatants (D,F). Particle concentration measured with NTA (G) for P21 pellets (light gray), P21TCEP pellets (grey) and SN21TCEP supernatants (black).

References

    1. Pisitkun T, Shen RF, Knepper MA. Identification and proteomic profiling of exosomes in human urine. Proc. Natl. Acad. Sci. USA. 2004;101:13368–13373. doi: 10.1073/pnas.0403453101. - DOI - PMC - PubMed
    1. Hogan MC, et al. Characterization of PKD protein-positive exosome-like vesicles. J. Am. Soc. Nephrol. 2009;20:278–288. doi: 10.1681/ASN.2008060564. - DOI - PMC - PubMed
    1. Smalley DM, Sheman NE, Nelson K, Theodorescu D. Isolation and identification of potential urinary microparticle biomarkers of bladder cancer. J. Proteome Res. 2008;7:2088–2096. doi: 10.1021/pr700775x. - DOI - PubMed
    1. Miranda KC, et al. Nucleic acids within urinary exosomes/microvesicles are potential biomarkers for renal disease. Kidney Int. 2010;78:191–199. doi: 10.1038/ki.2010.106. - DOI - PMC - PubMed
    1. Gould SJ, Raposo G. As we wait: coping with an imperfect nomenclature for extracellular vesicles. J. Extracell. Vesicles. 2013;15:2. doi: 10.3402/jev.v2i0.20389. - DOI - PMC - PubMed

Publication types