Porcine liver decomposition product-derived lysophospholipids promote microglial activation in vitro
- PMID: 32111938
- PMCID: PMC7048828
- DOI: 10.1038/s41598-020-60781-1
Porcine liver decomposition product-derived lysophospholipids promote microglial activation in vitro
Abstract
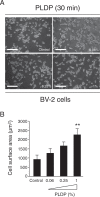
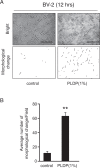
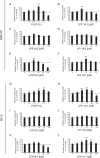
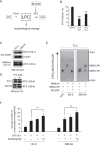
Cognitive impairments such as dementia are common in later life, and have been suggested to occur via a range of mechanisms, including oxidative stress, age-related changes to cellular metabolism, and a loss of phospholipids (PLs) from neuronal membranes. PLs are a class of amphipathic lipids that form plasma membrane lipid bilayers, and that occur at high concentrations in neuronal membranes. Our previous study suggested that a porcine liver decomposition product (PLDP) produced via protease treatment may improve cognitive function at older ages, by acting as a rich source of PLs and lysophospholipids (LPLs); however, its specific composition remains unclear. Thus, the present study used a novel liquid chromatography electrospray ionization tandem mass spectrometric (LC-MS/MS) protocol to identify the major PLs and LPLs in PLDP. Furthermore, it assessed the effect of identified LPLs on microglial activation in vitro, including cell shape, proliferation, and cell morphology. The results of the conducted analyses showed that PLDP and PLDP-derived LPLs concentration-dependently modulate microglial activation in vitro. In particular, lysophosphatidylcholine (LPC) concentration-dependently promotes cell morphology, likely via effects mediated by the enzyme autotaxin (ATX), since inhibiting ATX also promoted cell morphology, while conversely, increasing ATX production (via treatment with high levels of LPC) abolished this effect. These findings suggest that LPC is likely neuroprotective, and thus, support the importance of further research to assess its use as a therapeutic target to treat age-related cognitive impairments, including dementia.
Conflict of interest statement
The authors declare no competing interests.
Figures


Similar articles
-
Therapeutic Potential of Porcine Liver Decomposition Product: New Insights and Perspectives for Microglia-Mediated Neuroinflammation in Neurodegenerative Diseases.Biomedicines. 2020 Oct 22;8(11):446. doi: 10.3390/biomedicines8110446. Biomedicines. 2020. PMID: 33105637 Free PMC article. Review.
-
The Combined Effects of Lysophospholipids against Lipopolysaccharide-induced Inflammation and Oxidative Stress in Microglial Cells.J Oleo Sci. 2021 Jul 1;70(7):947-954. doi: 10.5650/jos.ess21069. Epub 2021 Jun 11. J Oleo Sci. 2021. PMID: 34121036
-
Persistent elevation of lysophosphatidylcholine promotes radiation brain necrosis with microglial recruitment by P2RX4 activation.Sci Rep. 2022 May 24;12(1):8718. doi: 10.1038/s41598-022-12293-3. Sci Rep. 2022. PMID: 35610277 Free PMC article.
-
Lysophospholipids-potent candidates for brain food, protects neuronal cells against α-Synuclein aggregation.Biomed Pharmacother. 2022 Dec;156:113891. doi: 10.1016/j.biopha.2022.113891. Epub 2022 Oct 18. Biomed Pharmacother. 2022. PMID: 36265307
-
Lysoglycerophospholipids in chronic inflammatory disorders: the PLA(2)/LPC and ATX/LPA axes.Biochim Biophys Acta. 2013 Jan;1831(1):42-60. doi: 10.1016/j.bbalip.2012.07.019. Epub 2012 Jul 31. Biochim Biophys Acta. 2013. PMID: 22867755 Review.
Cited by
-
Lysophospholipids: A Potential Drug Candidates for Neurodegenerative Disorders.Biomedicines. 2022 Dec 3;10(12):3126. doi: 10.3390/biomedicines10123126. Biomedicines. 2022. PMID: 36551882 Free PMC article. Review.
-
Pork Liver Decomposition Product May Improve Frontal Lobe Function in Humans-Open Trial.Brain Sci. 2024 Jun 7;14(6):586. doi: 10.3390/brainsci14060586. Brain Sci. 2024. PMID: 38928586 Free PMC article.
-
Anti-neuroinflammatory potential of porcine liver decomposition products in improving behavioral abnormalities: Effects on formalin- and LPS-induced inflammation.Biomed Rep. 2025 Jul 18;23(3):154. doi: 10.3892/br.2025.2032. eCollection 2025 Sep. Biomed Rep. 2025. PMID: 40746493 Free PMC article.
-
The Cactus (Opuntia ficus-indica) Cladodes and Callus Extracts: A Study Combined with LC-MS Metabolic Profiling, In-Silico, and In-Vitro Analyses.Antioxidants (Basel). 2023 Jun 23;12(7):1329. doi: 10.3390/antiox12071329. Antioxidants (Basel). 2023. PMID: 37507869 Free PMC article.
-
Therapeutic Potential of Porcine Liver Decomposition Product: New Insights and Perspectives for Microglia-Mediated Neuroinflammation in Neurodegenerative Diseases.Biomedicines. 2020 Oct 22;8(11):446. doi: 10.3390/biomedicines8110446. Biomedicines. 2020. PMID: 33105637 Free PMC article. Review.
References
-
- Matsuda Y, et al. Effects of Porcine Liver Decomposition product on the cognitive function in non-dementia patients. Jpn. J. Med. Pharm. Sci. 2016;73:1057–1066.
Publication types
MeSH terms
Substances
LinkOut - more resources
Full Text Sources
Research Materials

