

A mixed-model approach for powerful testing of genetic associations with cancer risk incorporating tumor characteristics
- PMID: 32112086
- PMCID: PMC8511944
- DOI: 10.1093/biostatistics/kxz065
A mixed-model approach for powerful testing of genetic associations with cancer risk incorporating tumor characteristics
Abstract
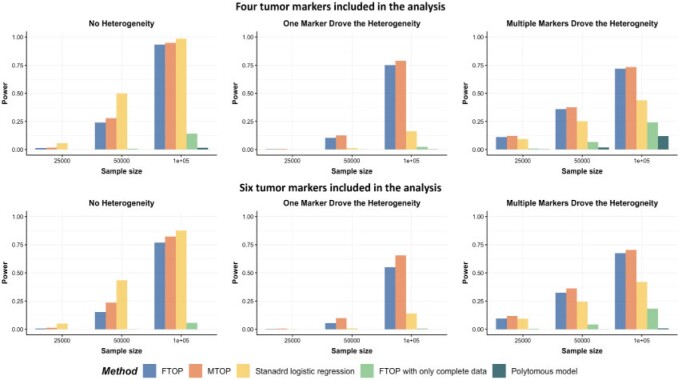
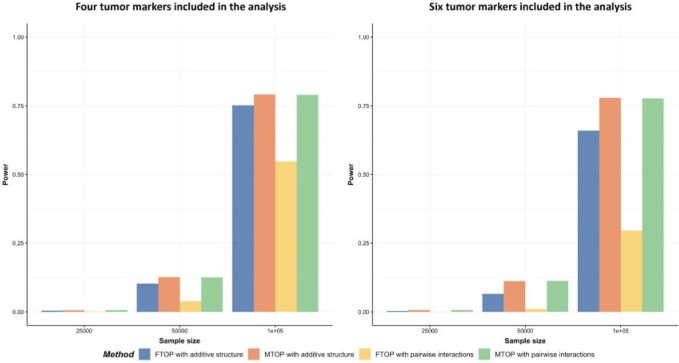
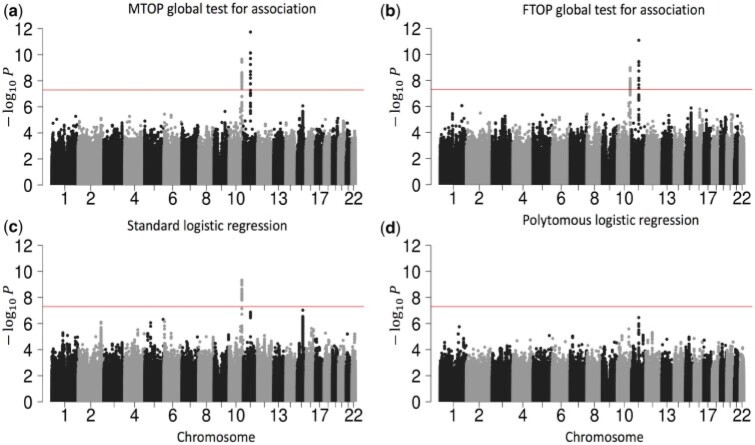
Cancers are routinely classified into subtypes according to various features, including histopathological characteristics and molecular markers. Previous genome-wide association studies have reported heterogeneous associations between loci and cancer subtypes. However, it is not evident what is the optimal modeling strategy for handling correlated tumor features, missing data, and increased degrees-of-freedom in the underlying tests of associations. We propose to test for genetic associations using a mixed-effect two-stage polytomous model score test (MTOP). In the first stage, a standard polytomous model is used to specify all possible subtypes defined by the cross-classification of the tumor characteristics. In the second stage, the subtype-specific case-control odds ratios are specified using a more parsimonious model based on the case-control odds ratio for a baseline subtype, and the case-case parameters associated with tumor markers. Further, to reduce the degrees-of-freedom, we specify case-case parameters for additional exploratory markers using a random-effect model. We use the Expectation-Maximization algorithm to account for missing data on tumor markers. Through simulations across a range of realistic scenarios and data from the Polish Breast Cancer Study (PBCS), we show MTOP outperforms alternative methods for identifying heterogeneous associations between risk loci and tumor subtypes. The proposed methods have been implemented in a user-friendly and high-speed R statistical package called TOP (https://github.com/andrewhaoyu/TOP).
Keywords: Cancer subtypes; EM algorithm; Etiologic heterogeneity; Score tests; Susceptibility variants; Two-stage polytomous model.
Published by Oxford University Press 2020. This work is written by US Government employees and is in the public domain in the US.
Figures
References
-
- Barnard, M. E., Boeke, C. E. and Tamimi, R. M. (2015). Established breast cancer risk factors and risk of intrinsic tumor subtypes. Biochimica et Biophysica Acta (BBA)-Reviews on Cancer 1856, 73–85. - PubMed
-
- Begg, C. B. and Zhang, Z. F. (1994). Statistical analysis of molecular epidemiology studies employing case-series. Cancer Epidemiology and Prevention Biomarkers 3, 173–175. - PubMed
Publication types
MeSH terms
Grants and funding
LinkOut - more resources
Full Text Sources
Medical
