. 2020 May 7;48(8):4480-4491.
doi: 10.1093/nar/gkaa127.

Long noncoding RNA HCP5 participates in premature ovarian insufficiency by transcriptionally regulating MSH5 and DNA damage repair via YB1

Affiliations

Long noncoding RNA HCP5 participates in premature ovarian insufficiency by transcriptionally regulating MSH5 and DNA damage repair via YB1

Xiaoyan Wang et al. Nucleic Acids Res. .

Abstract

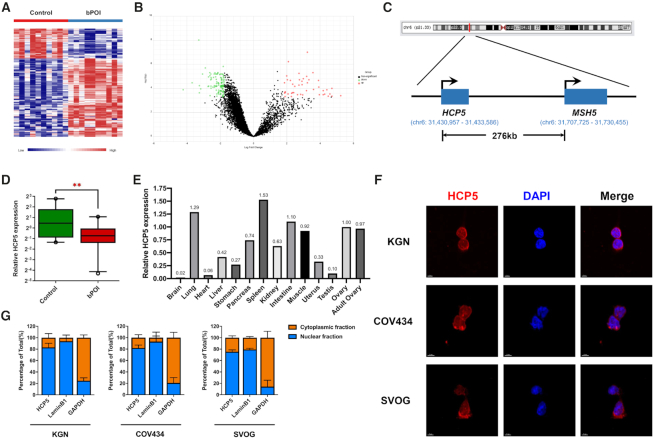
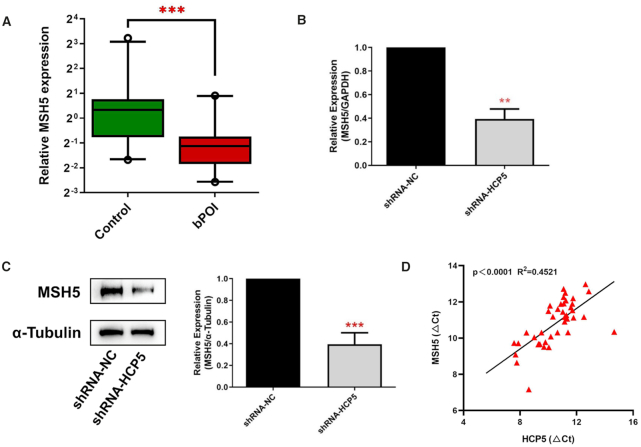
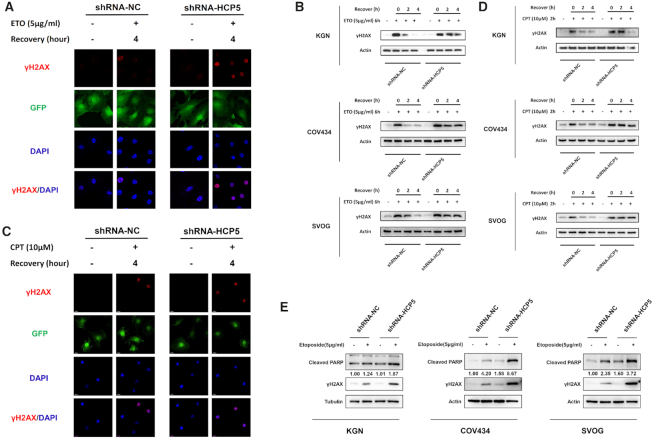
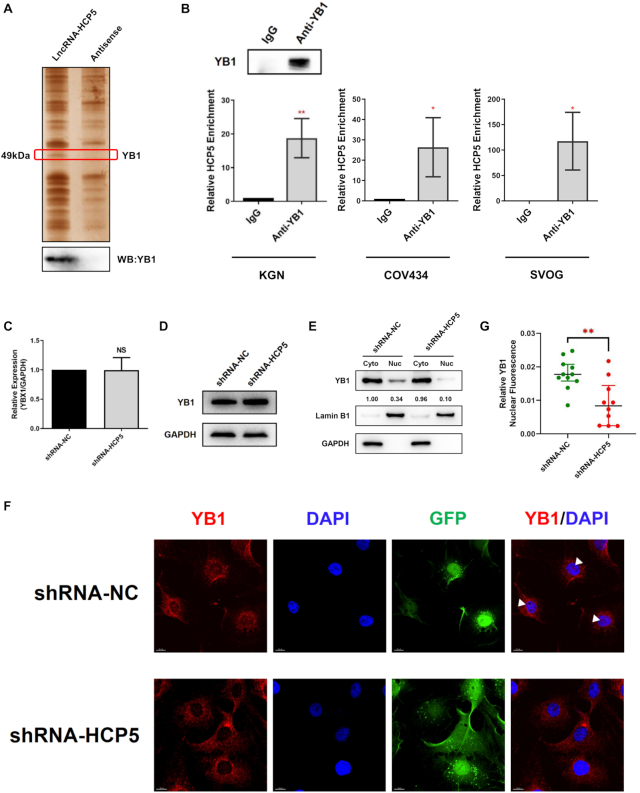
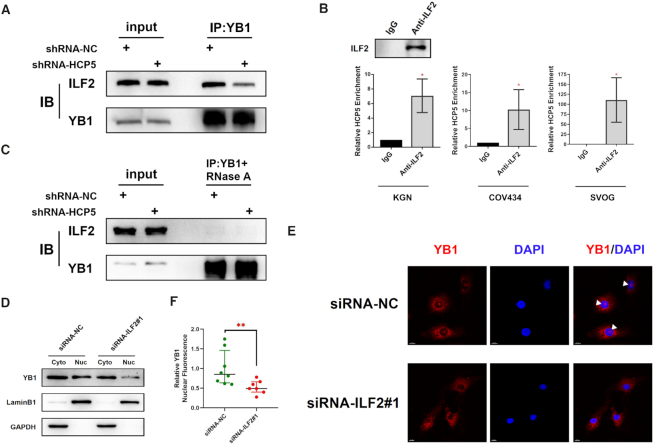
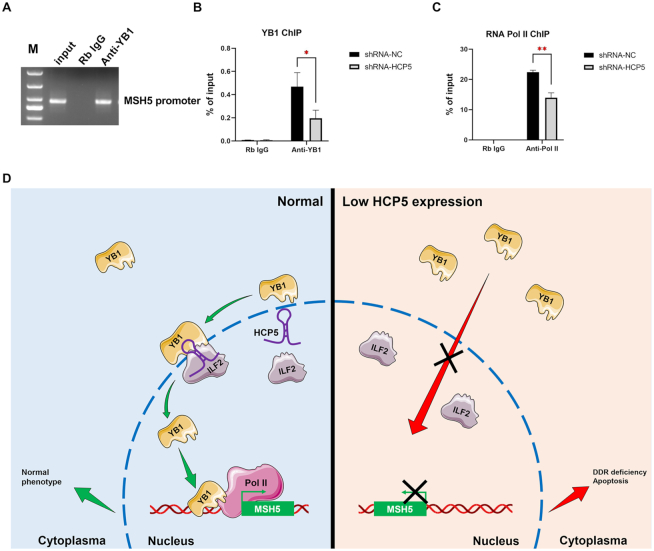
The genetic etiology of premature ovarian insufficiency (POI) has been well established to date, however, the role of long noncoding RNAs (lncRNAs) in POI is largely unknown. In this study, we identified a down-expressed lncRNA HCP5 in granulosa cells (GCs) from biochemical POI (bPOI) patients, which impaired DNA damage repair and promoted apoptosis of GCs. Mechanistically, we discovered that HCP5 stabilized the interaction between YB1 and its partner ILF2, which could mediate YB1 transferring into the nucleus of GCs. HCP5 silencing affected the localization of YB1 into nucleus and reduced the binding of YB1 to the promoter of MSH5 gene, thereby diminishing MSH5 expression. Taken together, we identified that the decreased expression of HCP5 in bPOI contributed to dysfunctional GCs by regulating MSH5 transcription and DNA damage repair via the interaction with YB1, providing a novel epigenetic mechanism for POI pathogenesis.


Figures

Figure 1.
Figure 1.
LncRNA HCP5 is down-regulated in GCs from patients with bPOI. (A) Microarray heatmap of differentially expressed lncRNAs between GCs from controls (n = 10) and bPOI patients (n = 10). (B) Volcano plot of differentially expressed lncRNAs between GCs from controls and bPOI patients. (C) Schematic representation of location of HCP5 and MSH5 in chromosome. (D) The expression level of HCP5 was validated by qRT-PCR in GCs from an independent cohort of controls (n = 22) and bPOI patients (n = 20). Ct values were normalized to GAPDH. Data are presented as the median ± interquartile range. **P < 0.01.Two-tailed Mann–Whitney U-test. (E) The mRNA level of HCP5 in 21-week fetal tissues was validated by qRT-PCR. The expression level in ovary was set as ‘1’. GAPDH was used as internal reference. (F) Subcellular localization of HCP5 was detected by RNA FISH assay in KGN, COV434 and SVOG cells. (G) Relative HCP5 expression levels in the cytoplasmic and nuclear fractions of KGN, COV434 and SVOG cells by qRT-PCR. Lamin B1 was used as nuclear control. GAPDH was used as cytoplasmic control.
Figure 2.
Figure 2.
HCP5 regulates MSH5 expression in granulosa cells. (A) The mRNA levels of MSH5 were validated by qRT-PCR in GCs from controls (n = 22) and bPOI patients (n = 20). Ct values were normalized to GAPDH. Data are presented as the median ± interquartile range. ***P < 0.001. Two-tailed Mann–Whitney U-test. (B, C) qRT-PCR and western blot indicated that MSH5 mRNA (B) and protein (C) levels were significantly reduced by shRNA-mediated knockdown of HCP5 in KGN cells. Protein quantification was analyzed using ImageJ software (right). ***P < 0.001. Data shown represent three independent experiments. (D) The correlation between HCP5 transcript levels and MSH5 mRNA levels was measured in the same cohort of GCs as in (A). The Ct values normalized to GAPDH were subjected to Pearson correlation analysis.
Figure 3.
Figure 3.
Knockdown of HCP5 impairs DSBs HR repair and promotes apoptosis of GCs through MSH5. (A) Immunofluorescence showed the γH2AX foci formation in HCP5-silencing and negative control KGN cells suffered from ETO treatment. (B) After exposed to ETO for 6 h, the γH2AX levels were detected by western blot in HCP5-silencing and negative control KGN, COV434 and SVOG cells. Data shown represent three independent experiments. (C) Immunofluorescence showed the γH2AX foci formation in HCP5-silencing and negative control KGN cells suffered from CPT treatment. (D) After exposed to CPT for 2 h, the γH2AX levels were detected by western blot in HCP5-silencing and negative control KGN, COV434 and SVOG cells. Data shown represent three independent experiments. (E) Knockdown of HCP5 enhanced the cleavage of PARP and formation of γH2AX caused by treatment with Etoposide in KGN, COV434 and SVOG cells. Data shown represent three independent experiments.
Figure 4.
Figure 4.
HCP5 directly binds to YB1 and is essential its nuclear localization. (A) Detection of HCP5-binding proteins by RNA pull-down assays. A specific band of ∼50 kDa (red box) was specific pulled down by HCP5 and subsequently identified as YB1 using mass spectrometry (Upper). Western blot showing the specific association between YB1 and HCP5 in the samples obtained from RNA pull-down (lower). The antisense transcript of HCP5 was used as a negative control. (B) Confirmation of the interaction between YB1 and HCP5 by RNA-binding protein immunoprecipitation (RIP) using YB1 antibody in KGN, COV434 and SVOG cells. Results are expressed as the mean ± SD (n = 3). *P < 0.05 and **P < 0.01. Two-tailed Student's t-test. (C) YB1 mRNA levels were analyzed by qRT-PCR after HCP5 silencing by shRNA in KGN cells. Values of qRT-PCR were obtained from triplicates and expressed as the mean ± SD (n = 3). Two-tailed Student's t-test. (D) YB1 protein levels were analyzed by western blot after HCP5 knockdown in KGN cells. Data shown represent three independent experiments. (E) Subcellular localization of YB1 protein was detected by western blot after HCP5 knockdown in KGN cells. Lamin B1 was used as nuclear control. GAPDH was used as cytoplasmic control. (F) Subcellular localization of YB1 protein was confirmed by immunofluorescence assay after HCP5 silencing. White triangles indicate representative YB1 expression in the nucleus. (G) Quantification of nuclear immunofluorescence intensity (mean gray value) in HCP5- knockdown (n = 10) and negative control (n = 11) KGN cells. Data are presented as the median ± interquartile range. **P < 0.01. Two-tailed Mann–Whitney U-test.
Figure 5.
Figure 5.
HCP5 is essential for YB1 locating to nucleus by acting as a scaffold for ILF2 and YB1. (A) The association between YB1 and ILF2 was shown in co-immunoprecipitation assays after silencing HCP5 in KGN cells. Data shown represent three independent experiments. (B) Confirmation of the interaction between ILF2 and HCP5 by RIP using ILF2 antibody in KGN, COV434 and SVOG cells. Results are expressed as the mean ± SD (n = 3). *P < 0.05. Two-tailed Student's t-test. (C) The association between YB1 and ILF2 was shown in co-immunoprecipitation assays after silencing HCP5 in KGN cells upon RNase A treatment. Data shown represent three independent experiments. (D) Subcellular localization of YB1 protein was detected by western blot after ILF2 silencing by siRNA in KGN cells. Lamin B1 was used as nuclear control. GAPDH was used as cytoplasmic control. (E) Subcellular localization of YB1 protein was confirmed by immunofluorescence assay after ILF2 silencing. White triangles indicate representative YB1 expression in the nucleus. (F) Quantification of nuclear immunofluorescence intensity (mean gray value) in ILF2-knockdown (n = 7) and negative control (n = 8) KGN cells. Data are presented as the median ± interquartile range. **P < 0.01. Two-tailed Mann–Whitney U-test.
Figure 6.
Figure 6.
Knockdown of HCP5 reduced YB1 binding to MSH5 promoter region and inhibited the transcriptional activation of MSH5. (A) ChIP analyses of KGN cells were performed with IgG or YB1 antibody. ChIP products were amplified by PCR with specific primers of the MSH5 promoter region and subjected to electrophoresis analyses. (B) ChIP analyses of KGN cells were performed with IgG or YB1 antibody after HCP5 silencing, followed by qPCR in the MSH5 promoter region. Values of qPCR were obtained from triplicates and expressed as the mean ± SD (n = 3). *P < 0.05. Two-tailed Student's t-test. (C) ChIP analyses of KGN cells were performed with IgG or RNA pol II antibody after HCP5 silencing, followed by qPCR in the MSH5 promoter region. Values of qPCR were obtained from triplicates and expressed as the mean ± SD (n = 3). **P < 0.01. Two-tailed Student's t-test. (D) Schematic summary of the critical role of HCP5 in MSH5 expression and GCs function through direct binding and modulating the subcellular localization of YB1.

References

    1. Coulam C.B., Adamson S.C., Annegers J.F.. Incidence of premature ovarian failure. Obstet. Gynecol. 1986; 67:604–606. - PubMed
    1. Wu X., Cai H., Kallianpur A., Li H., Yang G., Gao J., Xiang Y.B., Ji B.T., Yu T., Zheng W. et al. .. Impact of premature ovarian failure on mortality and morbidity among Chinese women. PLoS One. 2014; 9:e89597. - PMC - PubMed
    1. Welt C.K. Primary ovarian insufficiency: a more accurate term for premature ovarian failure. Clin. Endocrinol. (Oxf.). 2008; 68:499–509. - PubMed
    1. Qin Y., Jiao X., Simpson J.L., Chen Z.J.. Genetics of primary ovarian insufficiency: new developments and opportunities. Hum. Reprod. Update. 2015; 21:787–808. - PMC - PubMed
    1. Jiao X., Ke H., Qin Y., Chen Z.J.. Molecular genetics of premature ovarian insufficiency. Trends Endocrinol. Metab. 2018; 29:795–807. - PubMed

Publication types