. 2020 Apr;34(4):5401-5419.
doi: 10.1096/fj.201902961R. Epub 2020 Feb 28.

Role of monocarboxylate transporters in regulating metabolic homeostasis in the outer retina: Insight gained from cell-specific Bsg deletion

Affiliations

Role of monocarboxylate transporters in regulating metabolic homeostasis in the outer retina: Insight gained from cell-specific Bsg deletion

John Y S Han et al. FASEB J. 2020 Apr.

Abstract

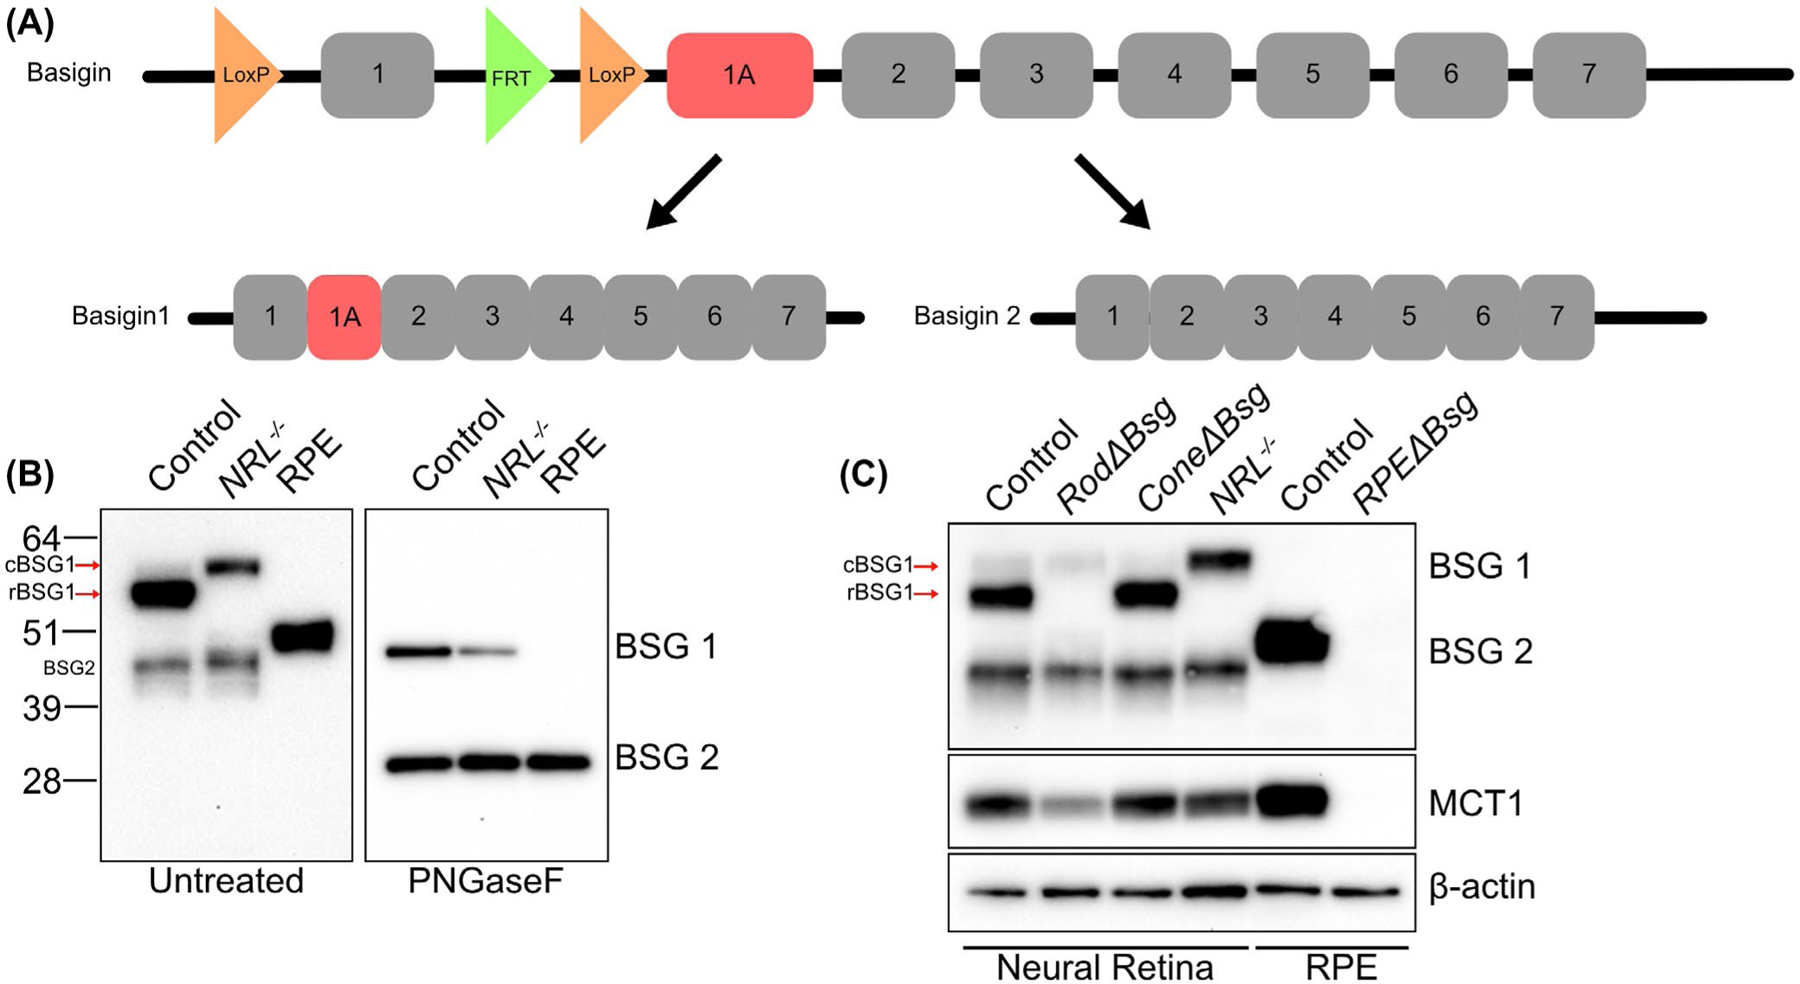
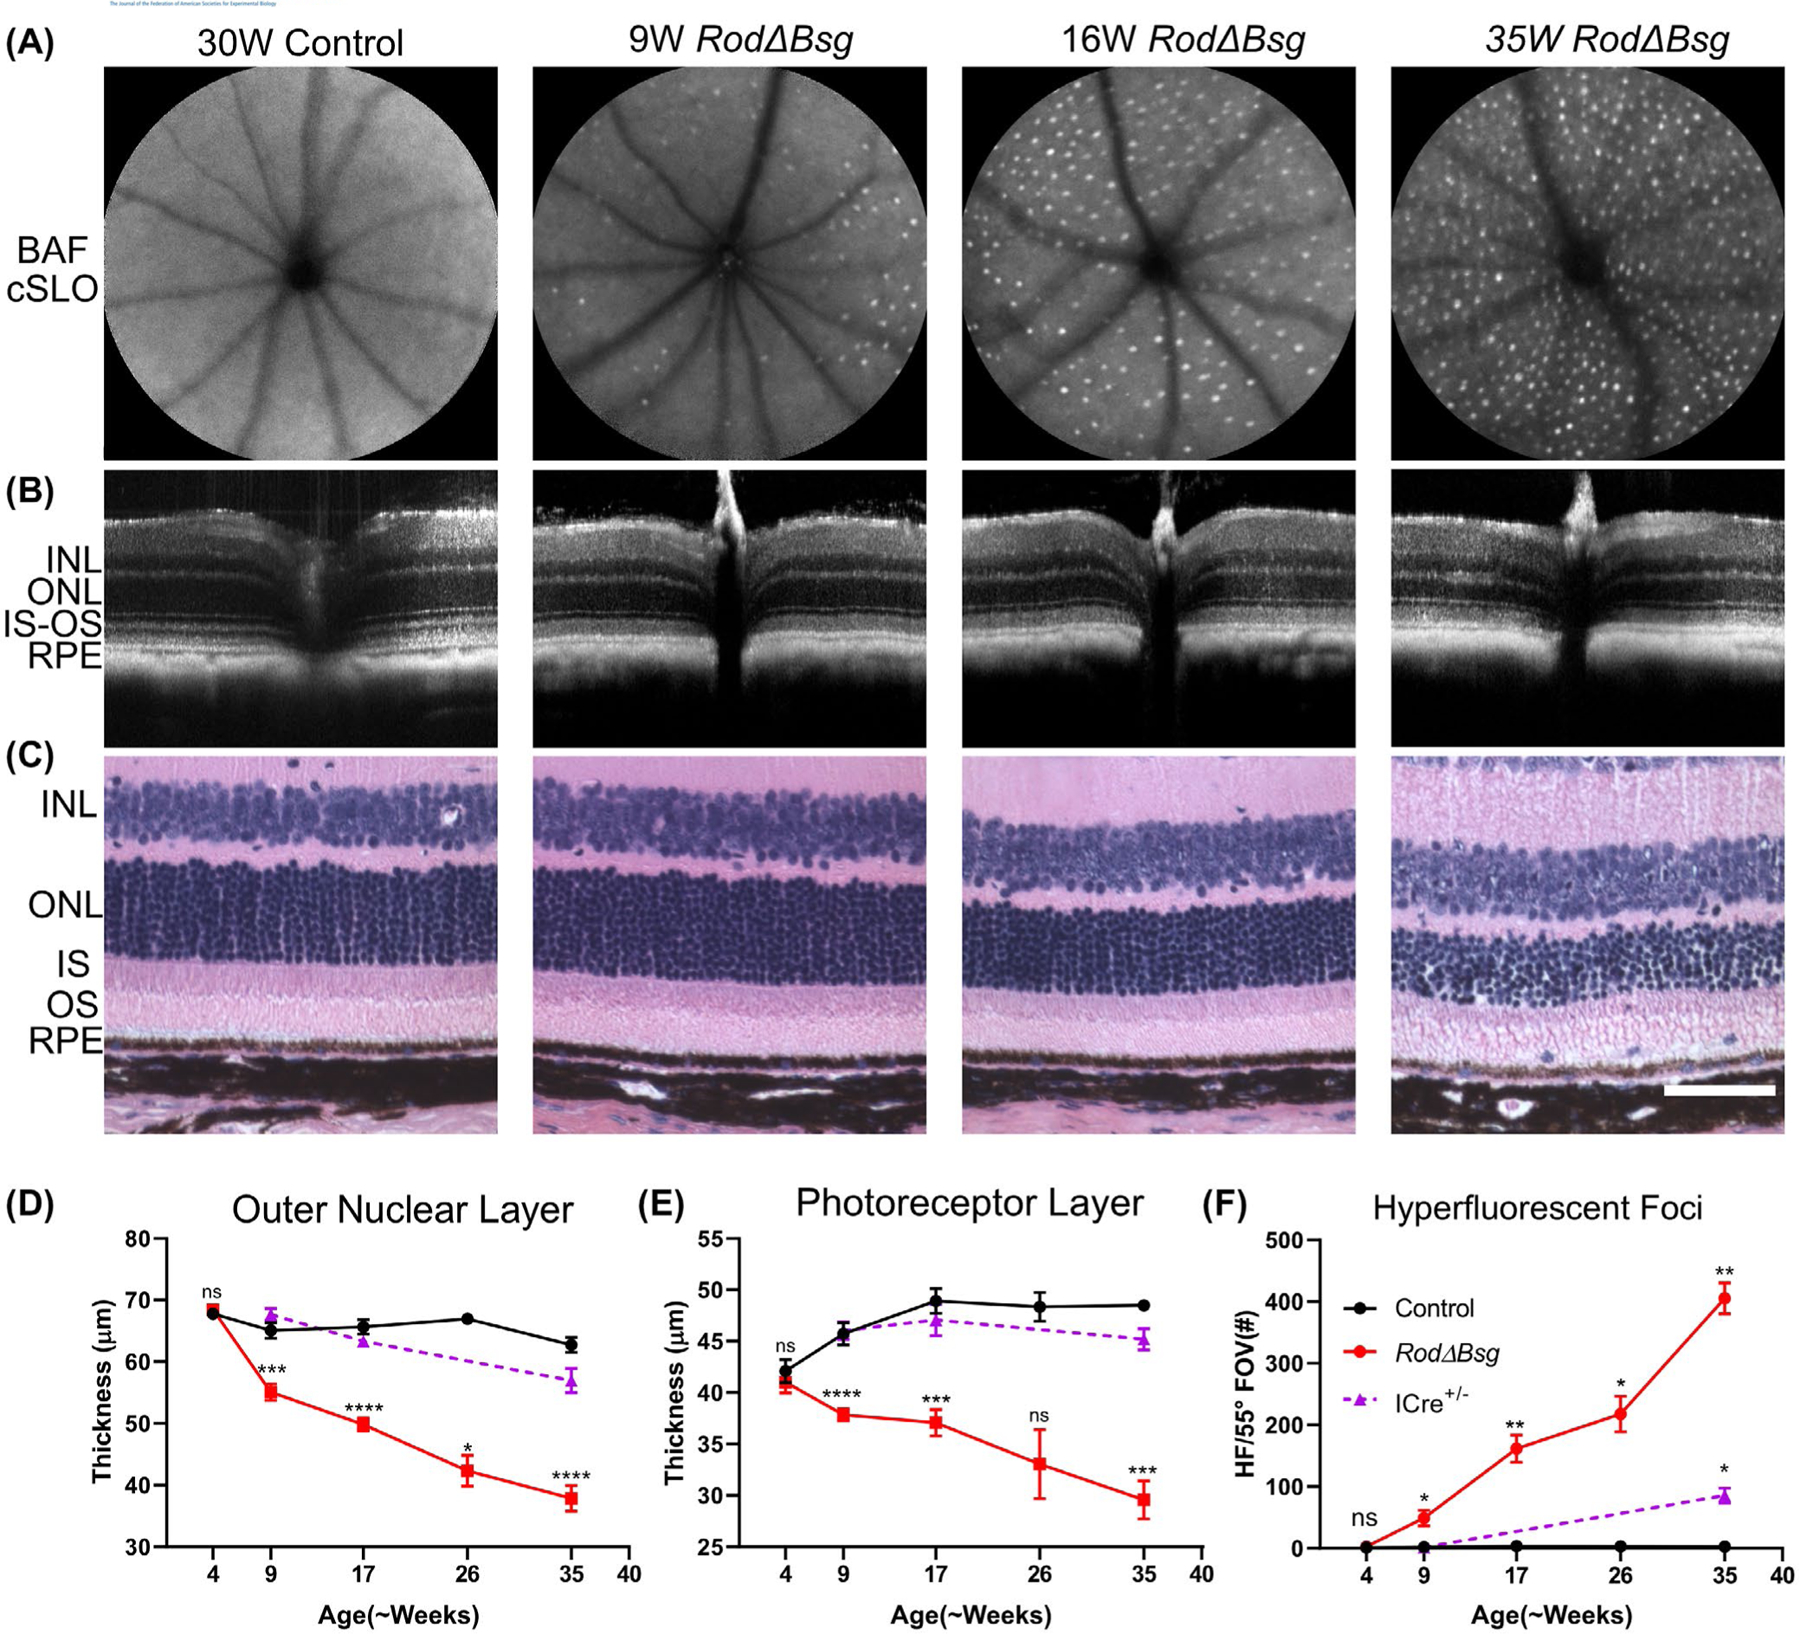
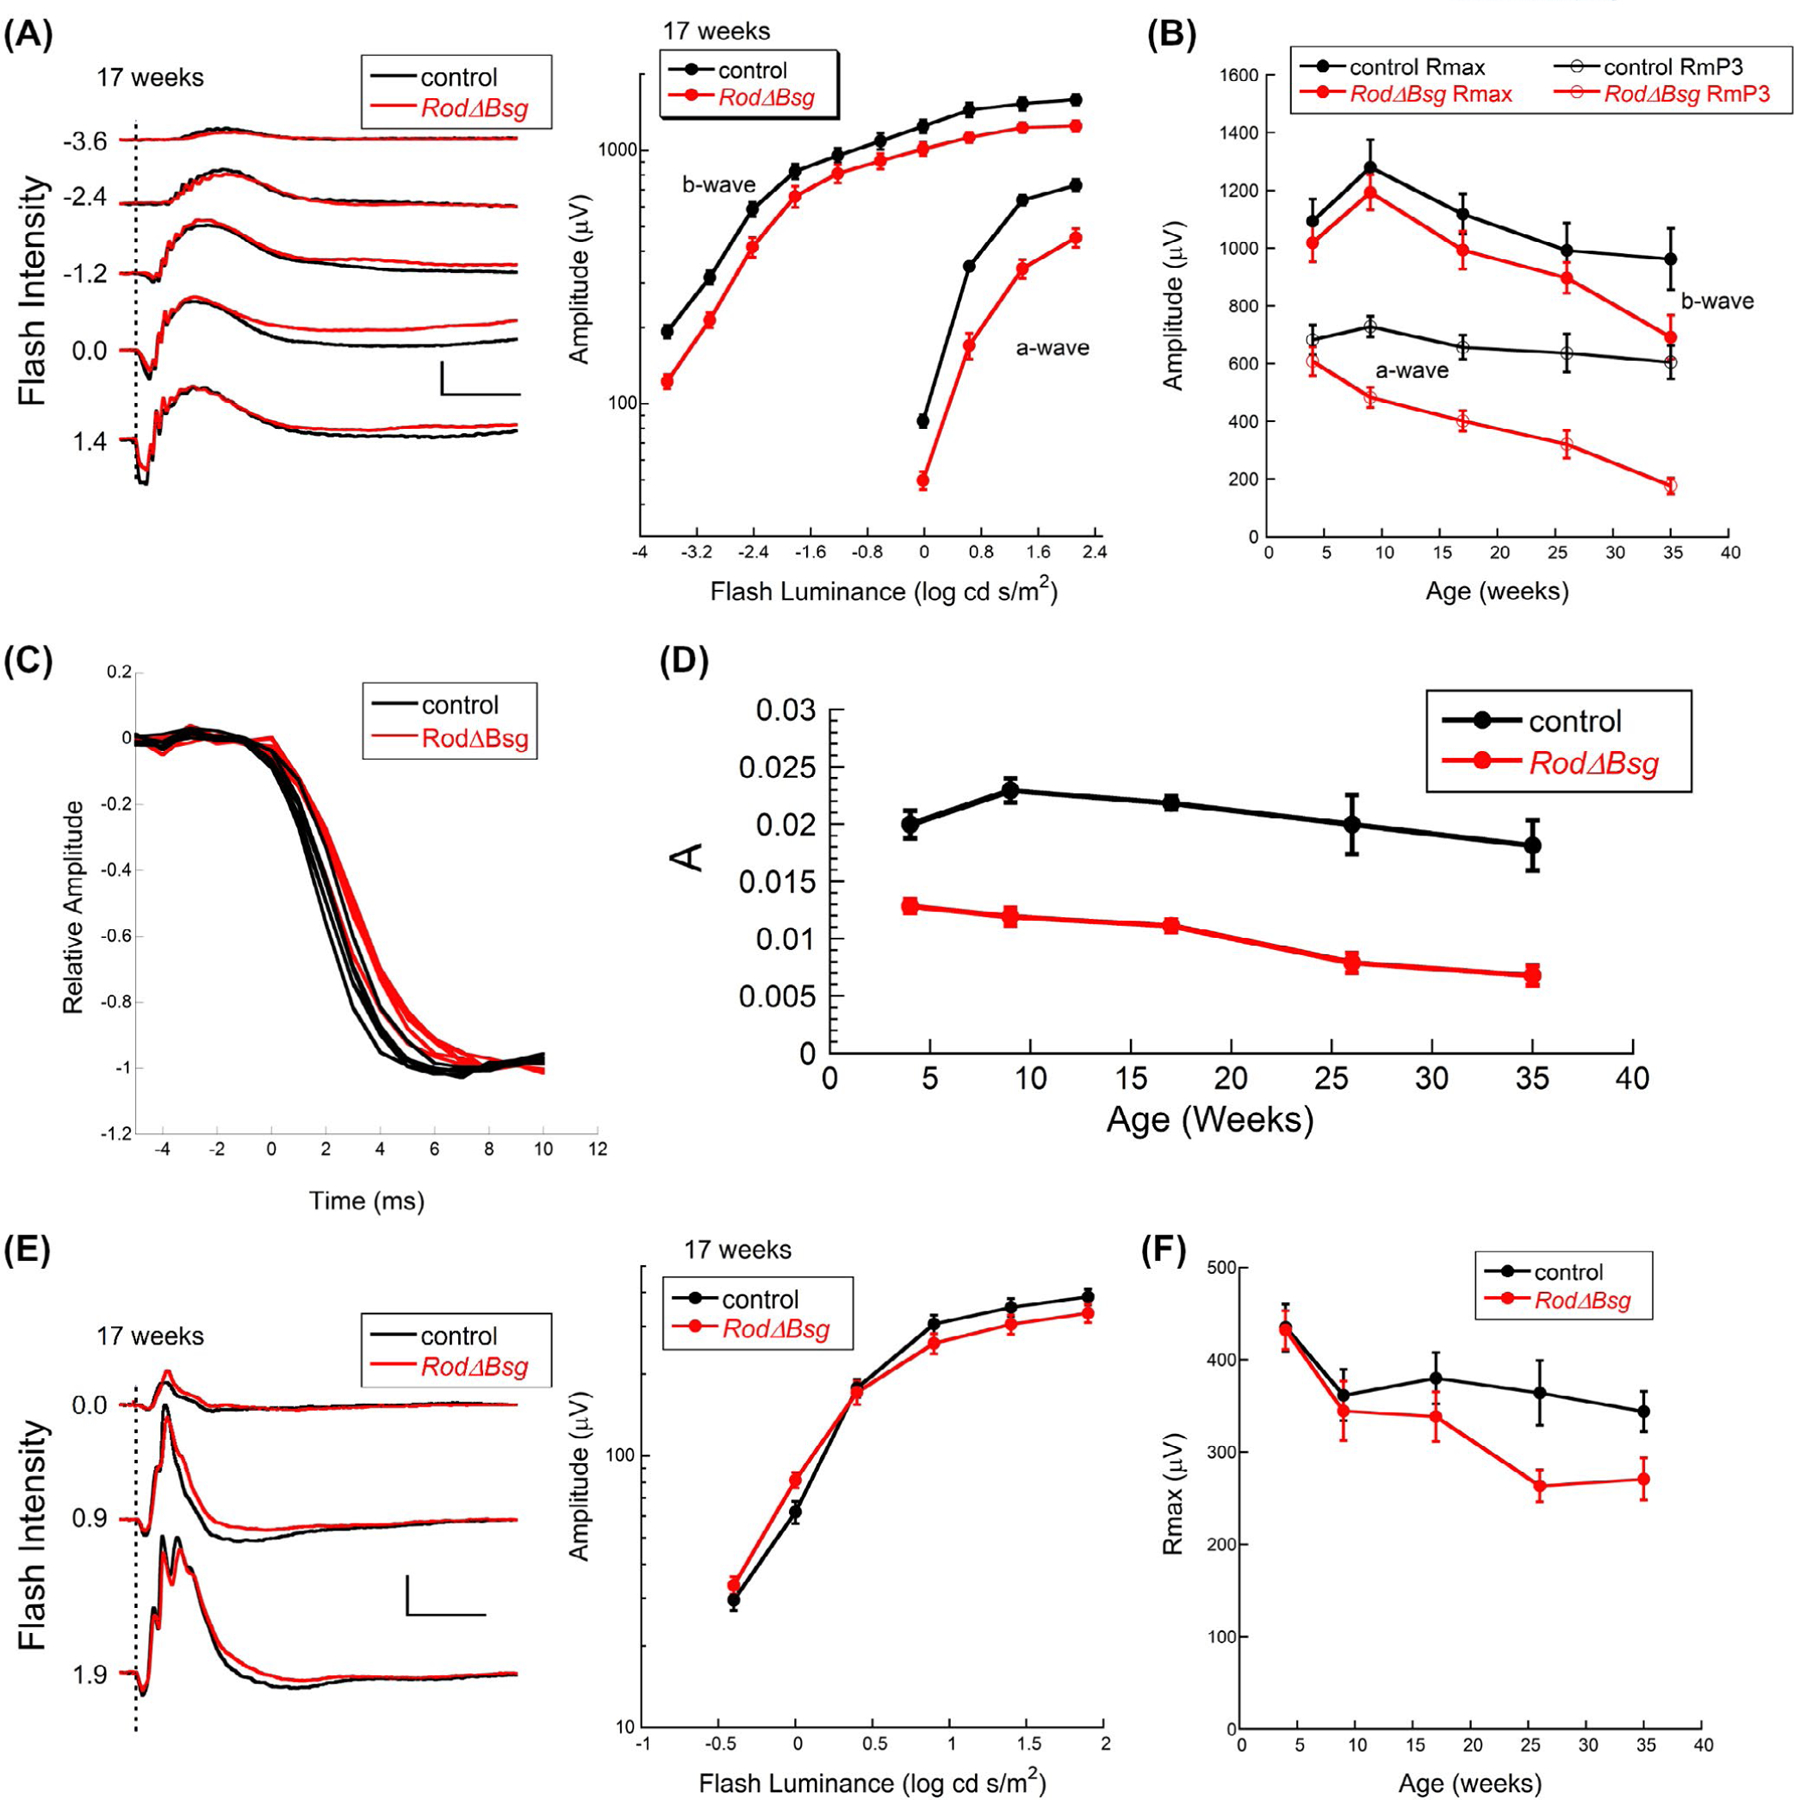
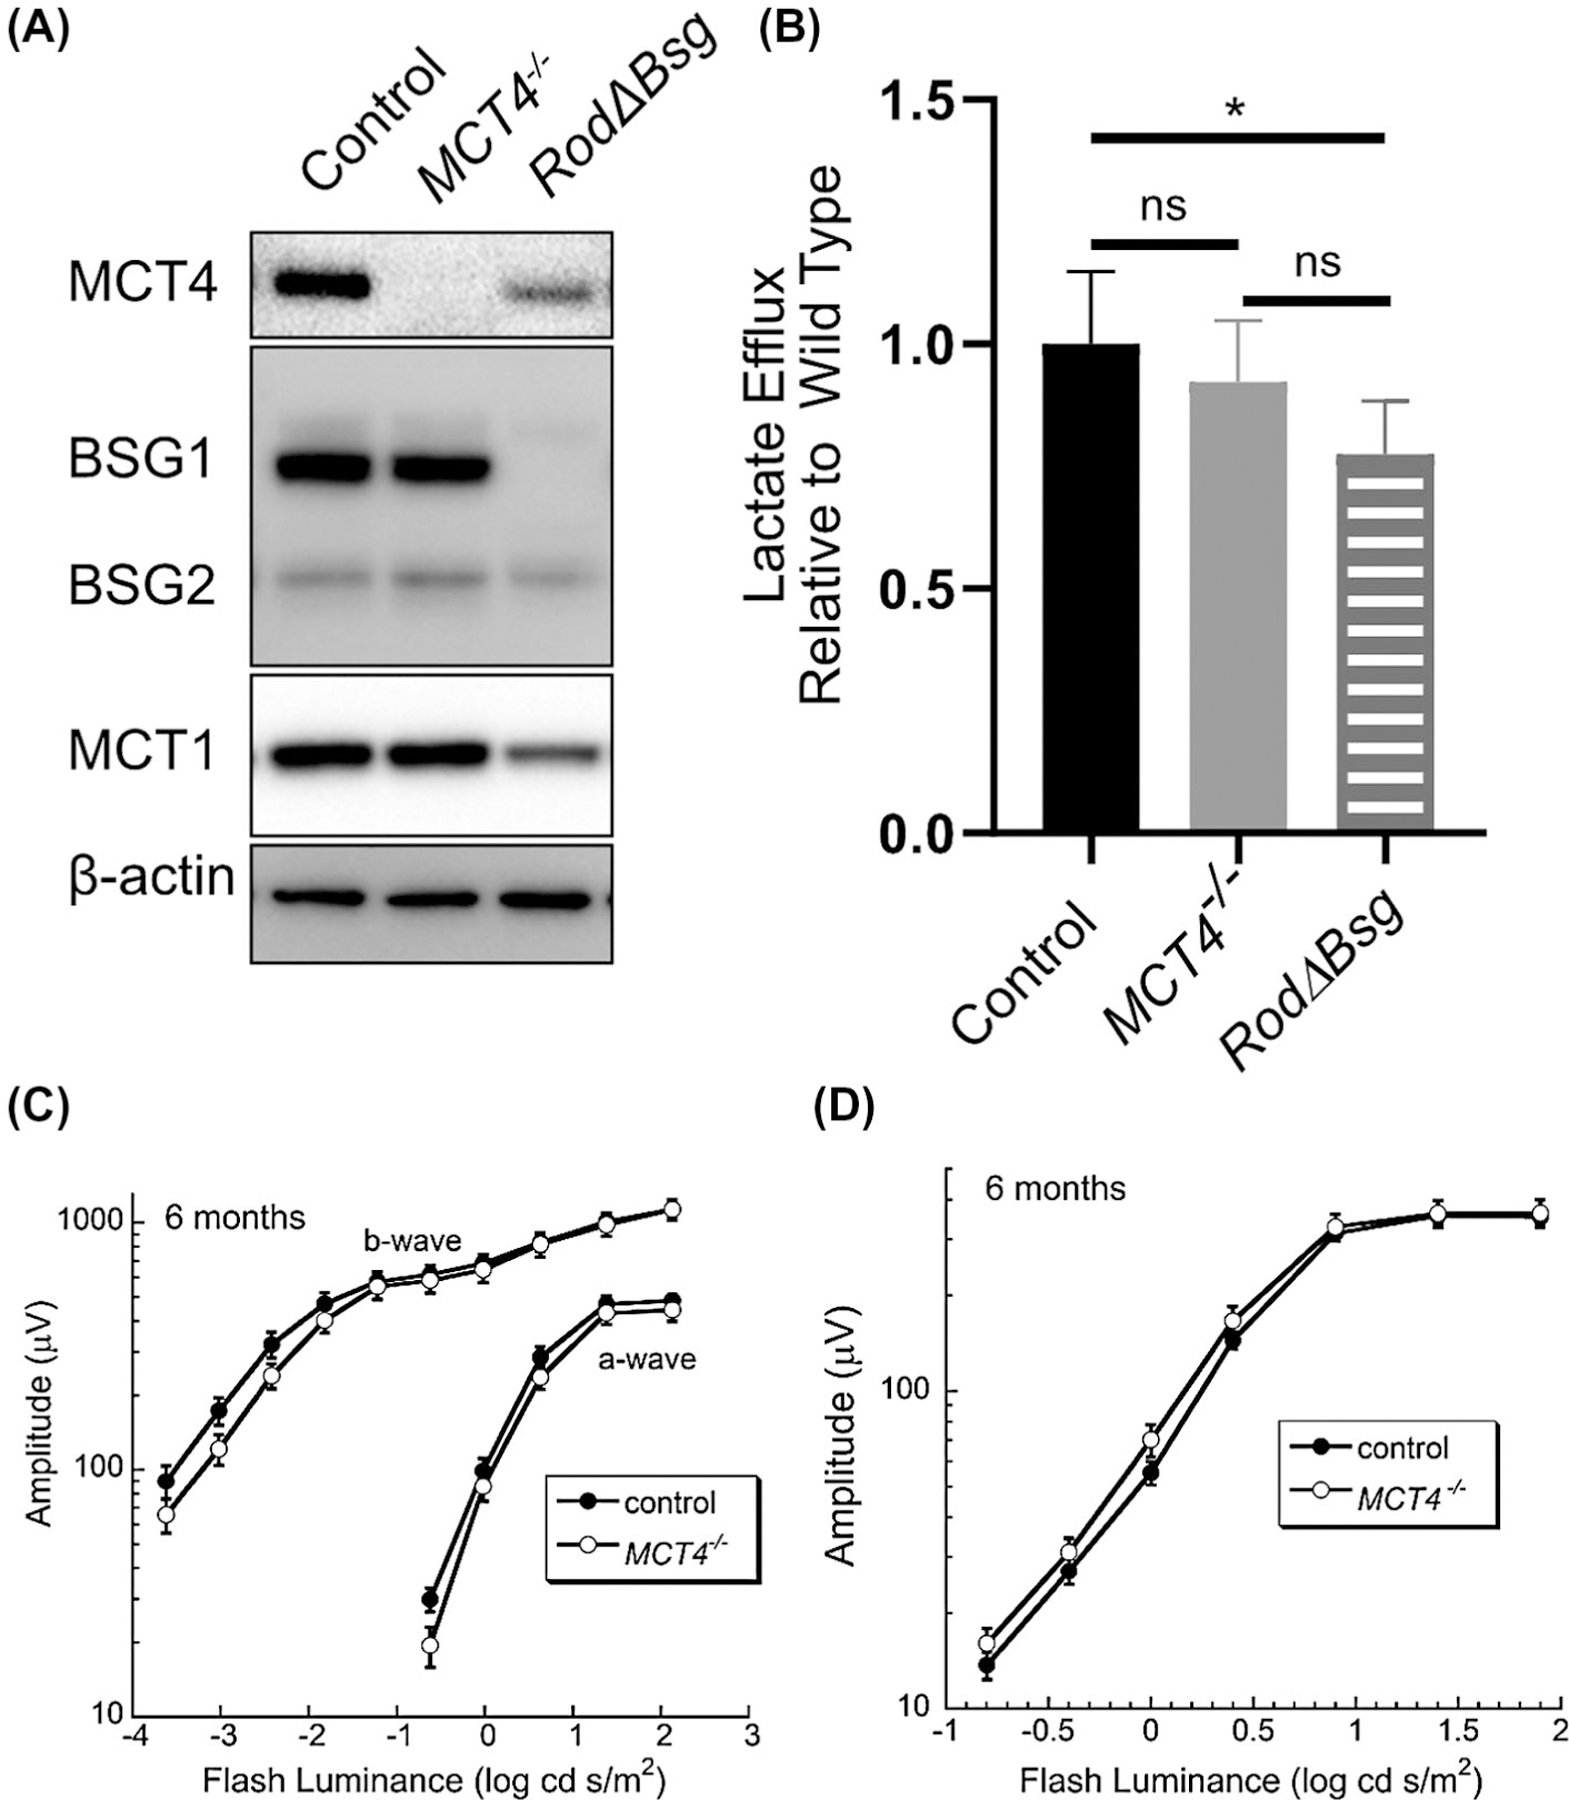
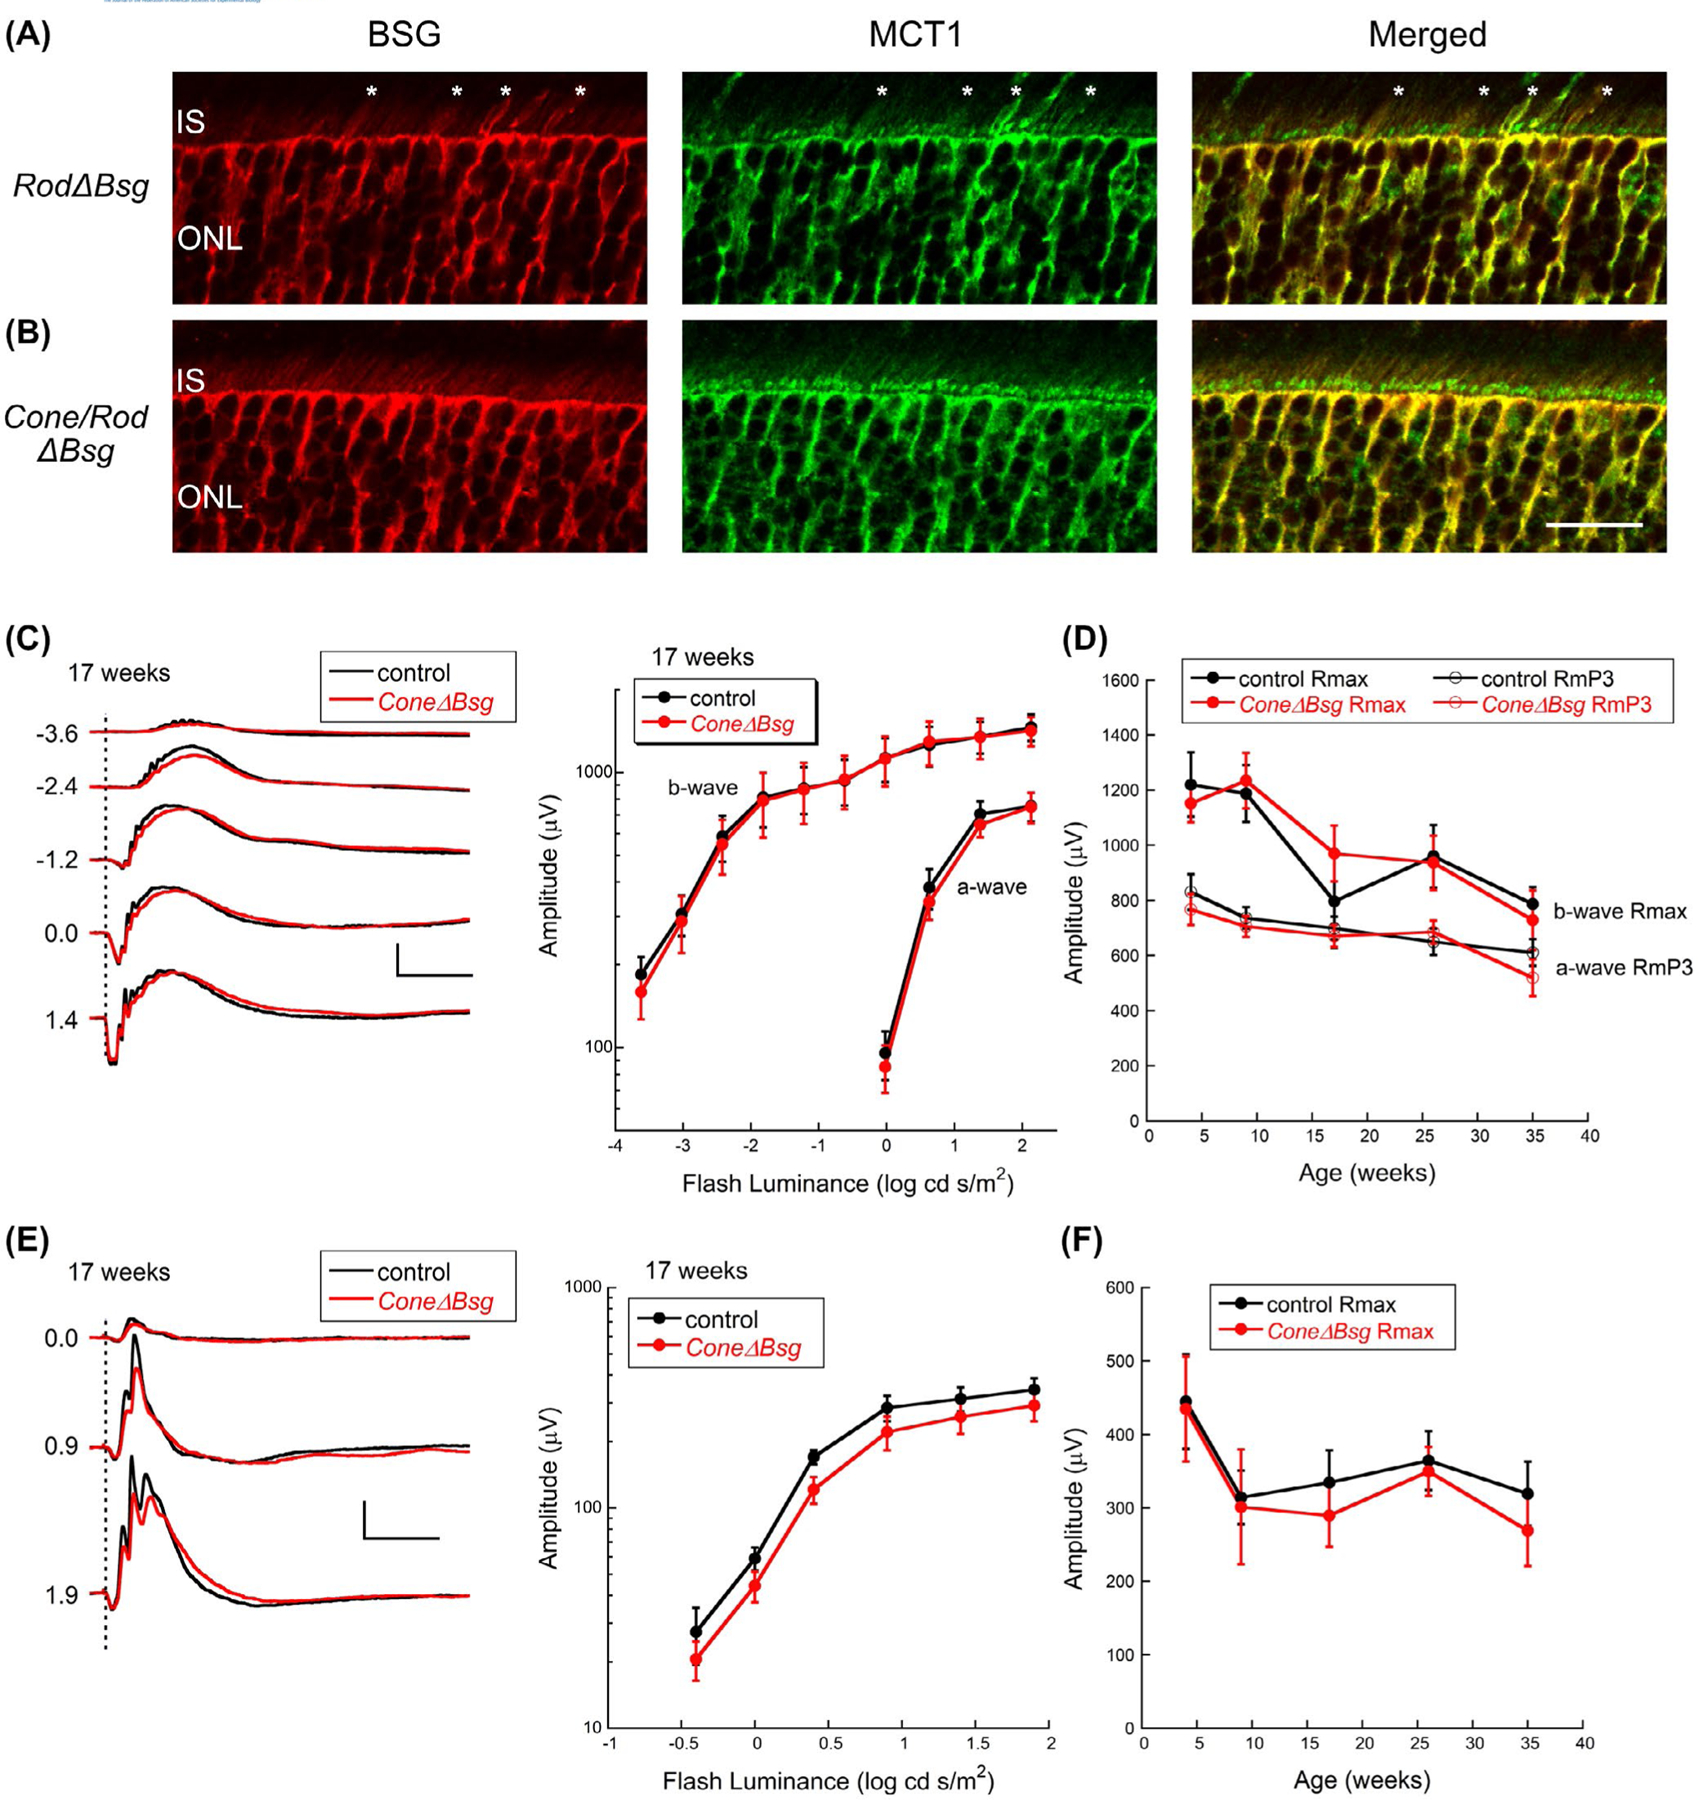
The neural retina metabolizes glucose through aerobic glycolysis generating large amounts of lactate. Lactate flux into and out of cells is regulated by proton-coupled monocarboxylate transporters (MCTs), which are encoded by members of the Slc16a family. MCT1, MCT3, and MCT4 are expressed in the retina and require association with the accessory protein basigin, encoded by Bsg, for maturation and trafficking to the plasma membrane. Bsg-/- mice have severely reduced electroretinograms (ERGs) and progressive photoreceptor degeneration, which is presumed to be driven by metabolic dysfunction resulting from loss of MCTs. To understand the basis of the Bsg-/- phenotype, we generated mice with conditional deletion of Bsg in rods (RodΔBsg), cones (Cone∆Bsg), or retinal pigment epithelial cells (RPEΔBsg). RodΔBsg mice showed a progressive loss of photoreceptors, while ConeΔBsg mice did not display a degenerative phenotype. The RPEΔBsg mice developed a distinct phenotype characterized by severely reduced ERG responses as early as 4 weeks of age. The loss of lactate transporters from the RPE most closely resembled the phenotype of the Bsg-/- mouse, suggesting that the regulation of lactate levels in the RPE and the subretinal space is essential for the viability and function of photoreceptors.

Keywords: RPE; basigin; lactate; monocarboxylate transporters; photoreceptors; retina.


Conflict of interest statement

CONFLICT OF INTEREST

The authors declare that the research was conducted in the absence of any commercial or financial relationships that could be construed as a potential conflict of interest.

Figures

FIGURE 1
FIGURE 1
Validation of mouse models with cell-specific deletion of Bsg in photoreceptors or RPE. A, Diagram of floxed Bsg gene and the splice variants Bsg1 and Bsg2. LoxP sites were placed on either side of exon 1 so crossing the Bsgflox/flox mice with the cell-specific Cre recombinase transgenic lines resulted in loss of expression of both Bsg1 and Bsg2. Exon 1A, present in Bsg1 but not Bsg2, is highlighted in red. B, Western blot of detergent-soluble lysate from control retina, NRL−/− retina, and control RPE untreated (left) or after PNGaseF treatment (right). Note that rBSG1 is absent from the cone-rich NRL−/− retina and cone BSG1 (cBSG1) and rod BSG1 (rBSG1) from control retinas have different mobilities on SDS-PAGE in the untreated control samples but not after PNGaseF treatment. BSG2 between the neural retinas and the RPE also appear differentially glycosylated, but not after PNGaseF treatment. C, Western blot of detergent soluble retinal lysates from control, RodΔBsg, ConeΔBsg, and NRL−/− mice shows the rod-specific deletion of rBSG1 in RodΔBsg and cone-specific deletion of cBSG1 in ConeΔBsg. Western blot confirms the deletion of BSG2 from RPEΔBsg RPE. In B) and C) blots are representative of SDS-PAGE and blots performed on lysates from at least three animals per genotype
FIGURE 2
FIGURE 2
rBSG1 is required MCT1 and MCT4 in rod photoreceptor cells. A, qPCR showing reduced levels of Bsg1 in RodΔBsg retina without compensatory increases in levels of other Ig superfamily members. Bars indicate average ± SEM for N = 4 mice. B, Immunofluorescence of BSG (red) and MCT1 (green) of frozen sections of eyes from control and RodΔBsg mice. Loss of BSG1 resulted in loss of MCT1 in inner segments. MCT1 was still detected in rods (arrows) but was not trafficked to the plasma membrane (Scale bar = 25 µm). Asterisks indicate cones which retain both BSG1 and MCT1. Data are representative of N = 3 experiments. C, Western blots of detergent soluble lysates from RodΔBsg retinas confirms genetic deletion of Bsg from rod photoreceptors targets MCTs for degradation. Blots are representative of N = 8 mice. D, Western blot quantification of MCT1 and MCT4 compared to β-tubulin of control and RodΔBsg samples. E, Comparison of Log2(CPM) values of Slc16a1 (MCT1) and Slc16a3 (MCT4) between rods and cones at P28 from GSE74660. F, Immunoprecipitation of MCT1 and MCT4 shows enrichment of rBSG1 in control as compared to RodΔBsg retina. Data are representative of N = 3 experiments
FIGURE 3
FIGURE 3
Age-related structural changes in RodΔBsg retina. A, Blue-light autofluorescence cSLO imaging of control and RodΔBsg eyes and F) quantification of hyperfluorescent foci (HF), number of HF increased with age in RodΔBsg retina (average (±SEM) of N ≥ 3 mice per genotype). B, SD-OCT images of control and RodΔBsg eyes. C, Histology of paraffin section of eyes from control and RodΔBsg mice (scale bar indicates 50 µm). D, E, quantification of thickness of ONL and PL layers from SD-OCT images. Data points indicate average (±SEM) of N ≥ 3 mice
FIGURE 4
FIGURE 4
Age-related changes in ERGs of RodΔBsg retina highlights importance of lactate transporters on rod photoreceptor function. A, Representative dark-adapted ERGs (left) and summary luminance-response functions from control and RodΔBsg littermates at 17 weeks of age. Values to the left of each pair of waveforms indicates flash strength in log cd s/m2. Calibration indicates 500 µV and 100 ms. B, Values of Rmax and RmP3 from control and RodΔBsg littermates at the ages indicated. C, Comparison of the leading edge of the a-wave of 4-week-old mice. For each mouse, amplitude was normalized to the a-wave trough. D, Values of A from control and RodΔBsg littermates at the ages indicated. E, Representative light-adapted ERGs (left) and summary luminance-response functions from control and RodΔBsg littermates at 17 weeks of age. Values to the left of each pair of waveforms indicates flash strength in log cd s/m2. Calibration indicates 100 µV and 100 ms. F, Values of Rmax for the cone ERG at the ages indicated. Data points indicate average (±SEM) for 4–7 mice
FIGURE 5
FIGURE 5
Retinal phenotype of the MCT4−/− mouse A) Western blot analysis of control, MCT4−/−, and RodΔBsg retinas. Blots are representative of N = 3 mice. B) Lactate efflux from control (N = 6), MCT4−/− (N = 3), and RodΔBsg retinas (N = 3). Luminance-response functions for the major components of the C) dark-adapted and D) light-adapted ERGs obtained from control and MCT4−/− mice. Data points indicate average (±SEM) for 12 mice
FIGURE 6
FIGURE 6
Age-related changes in ERGs of ConeΔBsg retina. A, Immunofluorescence confocal microscopy of frozen sections of RodΔBsg and B, Cone/RodΔBsg eyes with BSG (red) and MCT1 (green) confirms BSG and MCT1 are not expressed in cone photoreceptors of Opn1mwcre transgenic mice (scale bar = 20 µm). C, Representative dark-adapted ERGs (left) and summary luminance-response functions (right) obtained from control and ConeΔBsg littermates at 17 weeks of age. Values to the left of each pair of waveforms indicates flash strength in log cd s/ m2. Calibration indicates 500 µV and 100 ms. D, Values of Rmax and RmP3 from control and ConeΔBsg littermates at the ages indicated. E, Representative light-adapted ERGs from ConeΔBsg at 17 weeks of age. Values to the left of each pair of waveforms indicates flash strength in log cd s/m2. Calibration indicates 100 µV and 100 ms. F, Values of Rmax for the cone ERG at the ages indicated. Data points indicate average (±SEM) for 6–9 mice
FIGURE 7
FIGURE 7
RPE-specific deletion of BSG1. A, Immunofluorescent labeling of flatmounts of RPE from control and RPEΔBsg mice label with antibodies to BSG (green) and Cre (red) (scale bar = 100 µm). B, Western blot of lysates from control and RPEΔBsg RPE. C, BAF-cSLO demonstrates the increase in hyperfluorescent foci in RPEΔBsg. D, SD-OCT images of control and RPEΔBsg retina in 10-month-old RPEΔBsg. Red asterisk indicates retinal detachment. E, Representative H&E stained retinal cross sections of control and RPEΔBsg at 26 weeks of age (scale bar = 25 µm). F, Disorganized and enlarged RPE cells in RPEΔBsg flatmounts stained with ZO-1. All images are representative of N = 3 experiments (scale bar = 100 µm). Representative dark-adapted G) and light-adapted H) ERGs (left) and summary luminance-response functions right obtained from control and RPEΔBsg littermates at 17 weeks of age. Values to the left of each pair of waveforms indicates flash strength in log cd s/m2. Calibration indicates 500 µV and 100 ms. Data points indicate average (±SEM) for 30 control and 6 RPEΔBsg mice
FIGURE 8
FIGURE 8
Comparison of ERG a-wave changes in Bsg−/− cell-specific Bsg knockout mice. Summary of a-wave changes across the age range examined for RodΔBsg (Figure 4B), ConeΔBsg (Figure 6D), RPEΔBsg (Figure 7G), and Bsg−/−

References

    1. Léveillard T, Philp NJ, Sennlaub F. Is retinal metabolic dysfunction at the center of the pathogenesis of age-related macular degeneration? Sci Int J Mol. 2019;20:762.(1–20). - PMC - PubMed
    1. Joyal J-SS, Gantner ML, Smith LEH. Retinal energy demands control vascular supply of the retina in development and disease: the role of neuronal lipid and glucose metabolism. Prog Retin Eye Res. 2018;64:131–156. - PMC - PubMed
    1. Swarup A, Samuels IS, Bell BA, et al. Modulating GLUT1 expression in retinal pigment epithelium decreases glucose levels in the retina: impact on photoreceptors and müller glial cells. Am J Physiol - Cell Physiol. 2019;316:C121–C133. - PMC - PubMed
    1. Du J, Rountree A, Cleghorn WM, et al. Phototransduction influences metabolic flux and nucleotide metabolism in mouse retina. J Biol Chem. 2016;291:4698–4710. - PMC - PubMed
    1. Basigin Muramatsu T. (CD147), a multifunctional transmembrane glycoprotein with various binding partners. J Biochem. 2016;159:481–490. - PMC - PubMed

Publication types

LinkOut - more resources