. 2021 Apr;98(4):956-970.
doi: 10.1111/jfb.14300. Epub 2020 Mar 30.

Transgene-mediated skeletal phenotypic variation in zebrafish

Affiliations

Transgene-mediated skeletal phenotypic variation in zebrafish

Charles B Kimmel et al. J Fish Biol. 2021 Apr.

Abstract

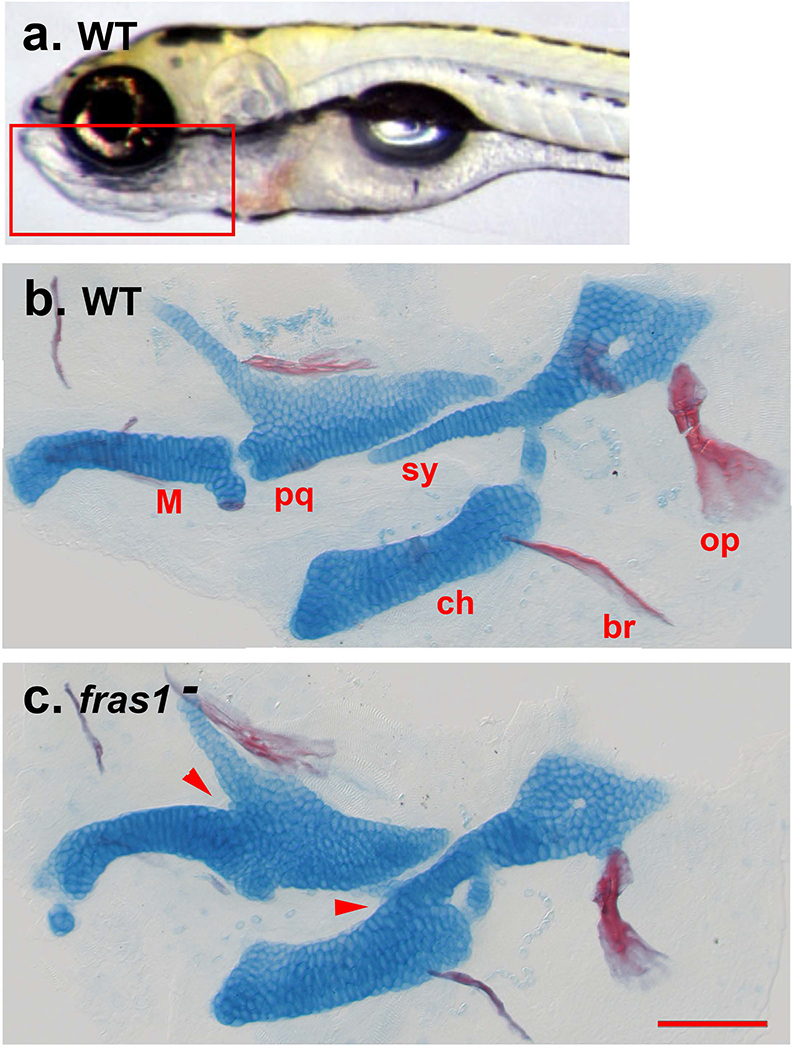
When considering relationships between genotype and phenotype we frequently ignore the fact that the genome of a typical animal, notably including that of a fish and a human, harbours a huge amount of foreign DNA. Such DNA, in the form of transposable elements, can affect genome function in a major way, and transgene biology needs to be included in our understanding of the genome. Here we examine an unexpected phenotypic effect of the chromosomally integrated transgene fli1a-F-hsp70l:Gal4VP16 that serves as a model for transgene function generally. We examine larval fras1 mutant zebrafish (Danio rerio). Gal4VP16 is a potent transcriptional activator that is already well known for toxicity and mediating unusual transcriptional effects. In the presence of the transgene, phenotypes in the neural crest-derived craniofacial skeleton, notably fusions and shape changes associated with loss of function fras1 mutations, are made more severe, as we quantify by scoring phenotypic penetrance, the fraction of mutants expressing the trait. A very interesting feature is that the enhancements are highly specific for fras1 mutant phenotypes, occurring in the apparent absence of more widespread changes. Except for the features due to the fras1 mutation, the transgene-bearing larvae appear generally healthy and to be developing normally. The transgene behaves as a genetic partial dominant: a single copy is sufficient for the enhancements, yet, for some traits, two copies may exert a stronger effect. We made new strains bearing independent insertions of the fli1a-F-hsp70l:Gal4VP16 transgene in new locations in the genome, and observed increased severities of the same phenotypes as observed for the original insertion. This finding suggests that sequences within the transgene, for example Gal4VP16, are responsible for the enhancements, rather than the effect on neighbouring host sequences (such as an insertional mutation). The specificity and biological action underlying the traits are subjects of considerable interest for further investigation, as we discuss. Our findings show that work with transgenes needs to be undertaken with caution and attention to detail.

Keywords: Fraser syndrome; Gal4VP16; canalization; craniofacial skeleton; fras1; opercle; skeletal fusion.


Figures

FIGURE 1
FIGURE 1
Skeletal elements in young wild type and fras1 mutant zebrafish larvae. (a) Live larva, the rectangle indicates the region of the ventral head that contains the skeletal elements of interest. Left side view, anterior to the left. (b, c) Flat mounts stained with Alcian Blue and Alizarin Red (for cartilage and bone, respectively), same orientation as A. Most of the cartilage at this stage is replaced with cartilage-replacement bone in the adult. The cartilages of interest in this study are labeled, br: branchiostegal ray, ch: ceratohyal, M: Meckel’s, pq: palatoquadrate, sy: symplectic region of the hyosymplectic. Two cartilage fusions are visible in c and indicated by arrowheads, the M-pq, and the sy-ch. The opercle (op) is a dermal bone, note its modestly reduced size in c. Abbreviations: WT: wild type, fras1: fras1 mutant. Scale bar, for b and c: 100 μm.
FIGURE 2
FIGURE 2
Details of larval skeletal anatomy; Alcian Blue-Alizarin Red stained preparations, photographed using Nomarski interference contrast illumination to enhance contrast and reveal unstained tissues. Similar orientations to Figure 1. (a) Wild type, showing the cartilages surrounding the late-developing region of the first pharyngeal pouch (late p1). Cartilages are labeled as in Figure 1. (b-d) fras1 mutants. (b) Two mutant fusions are illustrated, the M-pq (asterisk) and sy-ch (arrowhead). The sy has a short unfused extended region about three-four cells long (arrow), distal to the fusion. A band of muscle (striations visible) is present where late p1 would be located in the WT. (c, d) Higher magnification views of sy-ch configurations. (c) the sy and ch come into close apposition, but we do not score this condition as a full fusion; note the thin blue line separating the two elements. (d) Here, in contrast to c, the sy-ch full fusion is evident from the way that the cartilage cells from the two elements are interdigitated. In contrast to b, there is no extended region of the sy in this case.
FIGURE 3
FIGURE 3
Heritable increase in penetrance in three cartilage fusion phenotypes due to presence of the fli1a-F-hsp70l:Gal4VP16 transgene. Mosaic plot comparing fras1 mutant siblings, with and without transgenes. Normalized penetrance of the fusion is indicated by the lower, more darkly shaded part of a bar (y axis, range from 0 to 1). The numbers along the right side of each plot indicate the presence (1) or absence (0) of the mutant phenotype. The normalized fraction of each transgene class is given by the width of the bars. Scores from the left and right side of the animals are shown as separate plots (L, R). The p-values comparing the two transgene classes to each other (lower for each plot) showed no significant difference for all of the plots at alpha=0.05. The p-values comparing the mutants with no transgenes to the combination of both transgene classes together (upper for each) showed significant differences for all of the plots. A set of 188 mutants were scored, obtained from incrosses of parents each heterozygous for fras1, heterozygous for a single copy of the fli1a-F-hsp70l:Gal4VP16 transgene, and heterozygous for the UAS:GFP transgene. Progeny were scored as fras1 homozygous mutants by the blistered fins phenotype, and scored by fluorescence for presence of neither transgene (no fluorescence) or either the fli1a-F-hsp70l:Gal4VP16 transgene alone (fluorescent hearts only), or the combination of the fli1a-F-hsp70l:Gal4VP16 and UAS:GFP transgene (fluorescent hearts, bright pharyngeal arches and lower general body fluorescence).
FIGURE 4
FIGURE 4
For progeny of both incrosses (inx) and outcrosses (ox) most traits show significantly higher penetrance when the fli1a-F-hsp70l:Gal4VP16 is present (+) than when no transgene is present (−).Mosaic plots as in Figure 3. Significance at alpha=0.05 is indicated by an asterisk. Increased penetrance of the transgene-bearing outcross progeny, as compared with progeny without the transgene, indicate that a single transgene copy is sufficient, i.e., the transgene behaves as a dominant trait. n=120 individuals for the inx progeny and 106 for the ox progeny. Incross data are from crosses as explained in the legend to Figure 3 (but here UAS:GFP is not present). As a control we compared inx and ox fish that did not possess the transgene (−), and found only insignificant differences for 7 out of 8 traits. This result strongly suggests that dosage of the transgene itself, and not some other background feature, is responsible for increased severity. Outcross data are from crosses in which one parent only was heterozygous for presence of the fli1a-F-hsp70l:Gal4VP16; both parents were heterozygous for fras1.
FIGURE 5
FIGURE 5
For some fras1 mutant traits, particularly the sy extension and the M-pq fusion, fli1a-F-hsp70l:Gal4VP16 transgene-bearing incross progeny show significantly higher penetrance than transgene-bearing outcross progeny. Mosaic plots as in Figure 3, here comparing incross and outcross groups. We use only the fli1a-F-hsp70l:Gal4VP16 transgene classes for this analysis. Significant differences are indicated by asterisks. n=115 individuals. Incross data from crosses as explained in the legend to Figure 3 (but here UAS:GFP was not present). Outcross data from crosses in which one parent only was heterozygous for the fli1a-F-hsp70l:Gal4VP16 transgene; both parents were heterozygous for fras1.
FIGURE 6
FIGURE 6
Micro-injection of the fli1a-F-hsp70l:Gal4VP16-plasmid results in no significant enhancement of fras1 mutant phenotypes in the recipients. Mosaic plots as in previous figures. In the experiment shown, the plasmid was injected into eggs derived from fish heterozygous for fras1, and heterozygous for UAS:GFP. The resulting embryos were scored for fras1 homozygosity, for fluorescence in the heart and pharyngeal arches, and, after skeletal staining, for fras1 mutant skeletal phenotypes. The comparisons shown are between classes with medium-to-high arch fluorescence (+), and no fluorescence (−); (individuals with only dim fluorescence were omitted from the analysis). None of the comparisons showed a significant effect of the transgene in these ‘transient’ mosaic analyses.
FIGURE 7
FIGURE 7
Four out of five new, independently derived fli1a-F-hsp70l:Gal4VP16 transgenic lines (lines B-G) enhance penetrance of at least some fras1 mutant phenotypes. F1 progeny from the plasmid injected fish. Line A is our original line. n=712 individuals. Mosaic plots as in previous figures, comparing penetrance in the presence and absence of the transgene. Asterisks indicate differences significant at alpha=0.05. Enhancement of penetrance varies remarkably among the new lines – B is approximately as active as line A, and line D showed no significant enhancement (see also observations described in the text). For the B-D lines no UAS:GFP is present. Gal4 function was assessed In line D, and found to be present, by raising F1s and crossing the transgenic adults to a heterozygous UAS:GFP stock. For lines E and G, the recipients of the plasmid possessed the UAS:GFP transgene, such that we could show directly that Gal4 was functional in the F1s.
FIGURE 8
FIGURE 8
Possession of the fli1a-F-hsp70l:Gal4VP16 transgene does not appear to increase developmental instability of the penetrance traits. Plot of proportion of unilateral expression of fras1 mutant traits (U) as a function of trait frequency (F). Ordinary least squares regression lines for transgene-containing sets (red data points and regression lines) and groups without the transgene (blue). Slopes for both relationships are essentially identical (−0.76 and −0.71 respectively), suggesting no difference in developmental instability. The data are from the large analysis shown in Figure 7, and the different points indicate different traits as set out there. Calculations (from Hallgrimsson et al., 2005): We consider proportions, normalized such that a+b+c+d=1 for a given trait (e.g. an sy-ch fusion) and for each given condition (here, 2 conditions: mutants with included transgene compared with mutants without the transgene). Let a=neither the left nor right sides express the trait, b=only the left side expresses the trait, c=only the right side expresses the trait, d=both left and right sides express the trait. Then F= b+c+d and U= (b+c)/(b+c+d).

Similar articles

Cited by

References

    1. Asakawa K, & Kawakami K (2009). The Tol2-mediated Gal4-UAS method for gene and enhancer trapping in zebrafish. Methods, 49, 275–281 - PMC - PubMed
    1. Asakawa K, Suster ML, Mizusawa K, Nagayoshi S, Kotani T, Urasaki A, Kishimoto Y, Hibi M, & Kawakami K (2008). Genetic dissection of neural circuits by Tol2 transposon-mediated Gal4 gene and enhancer trapping in zebrafish. Proceedings of the National Academy of Sciences of the United States of America, 105, 1255–1260 - PMC - PubMed
    1. Barske L, Askary A, Zuniga E, Balczerski B, Bump P, Nichols JT, Crump JG (2016). Competition between Jagged-Notch and Endothelin1 signaling selectively restricts cartilage formation in the zebrafish upper face. PLoS Genetics, 12, e1005967. - PMC - PubMed
    1. Belancio VP, Hedges DJ, & Deininger P (2008). The Tol2-mediated Gal4-UAS method for gene and enhancer trapping in zebrafish. Genome Research, 18, 343–358 - PubMed
    1. Bolger AM, Lohse M, M., & Usadel B (2014). Trimmomatic: a flexible trimmer for Illumina sequence data. Bioinformatics, 30, 2114–2120 - PMC - PubMed

LinkOut - more resources