. 2020 Mar:53:102683.
doi: 10.1016/j.ebiom.2020.102683. Epub 2020 Feb 27.

FGFR1 and FGFR4 oncogenicity depends on n-cadherin and their co-expression may predict FGFR-targeted therapy efficacy

Affiliations

FGFR1 and FGFR4 oncogenicity depends on n-cadherin and their co-expression may predict FGFR-targeted therapy efficacy

Álvaro Quintanal-Villalonga et al. EBioMedicine. 2020 Mar.

Abstract

Background: Fibroblast growth factor receptor (FGFR)1 and FGFR4 have been associated with tumorigenesis in a variety of tumour types. As a therapeutic approach, their inhibition has been attempted in different types of malignancies, including lung cancer, and was initially focused on FGFR1-amplified tumours, though with limited success.

Methods: In vitro and in vivo functional assessments of the oncogenic potential of downregulated/overexpressed genes in isogenic cell lines were performed, as well as inhibitor efficacy tests in vitro and in vivo in patient-derived xenografts (PDXs). mRNA was extracted from FFPE non-small cell lung cancer samples to determine the prognostic potential of the genes under study.

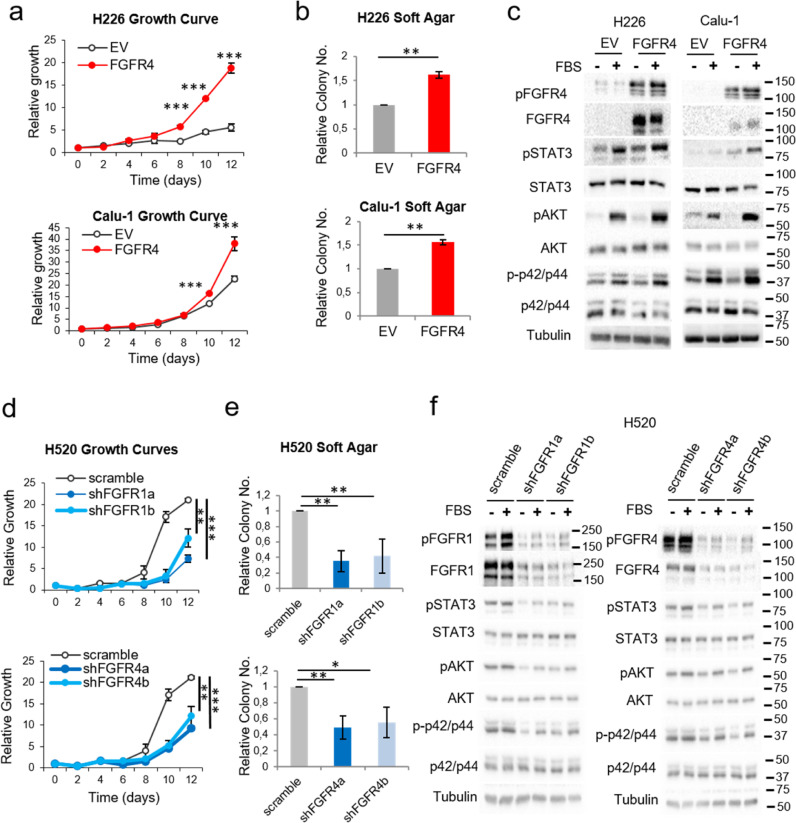
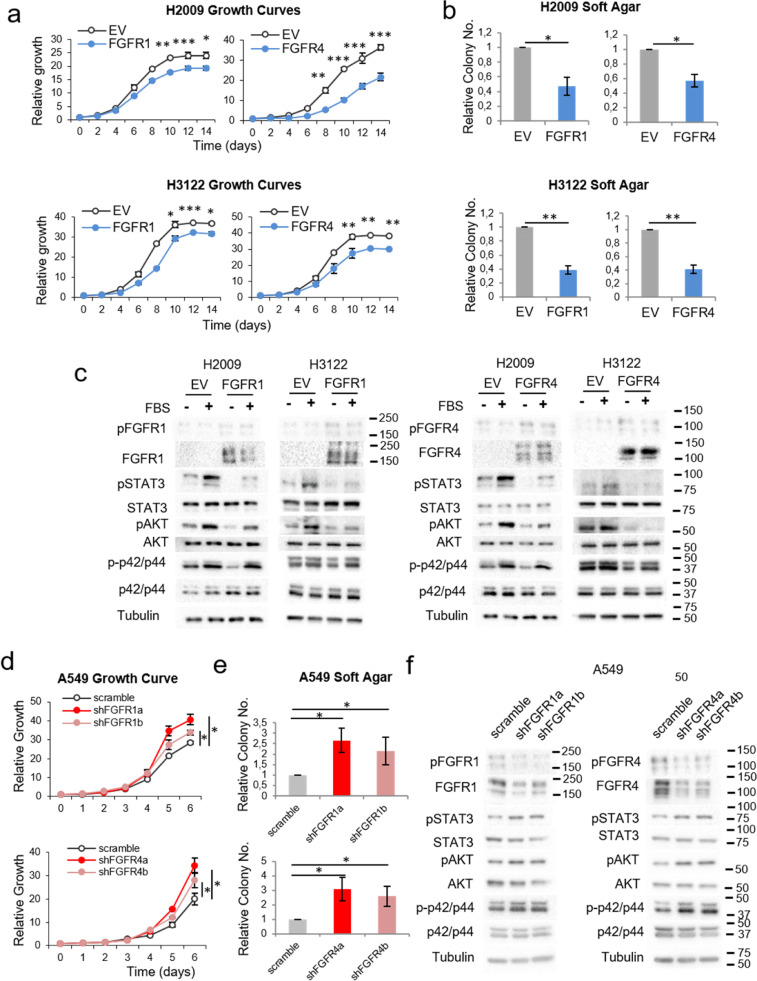
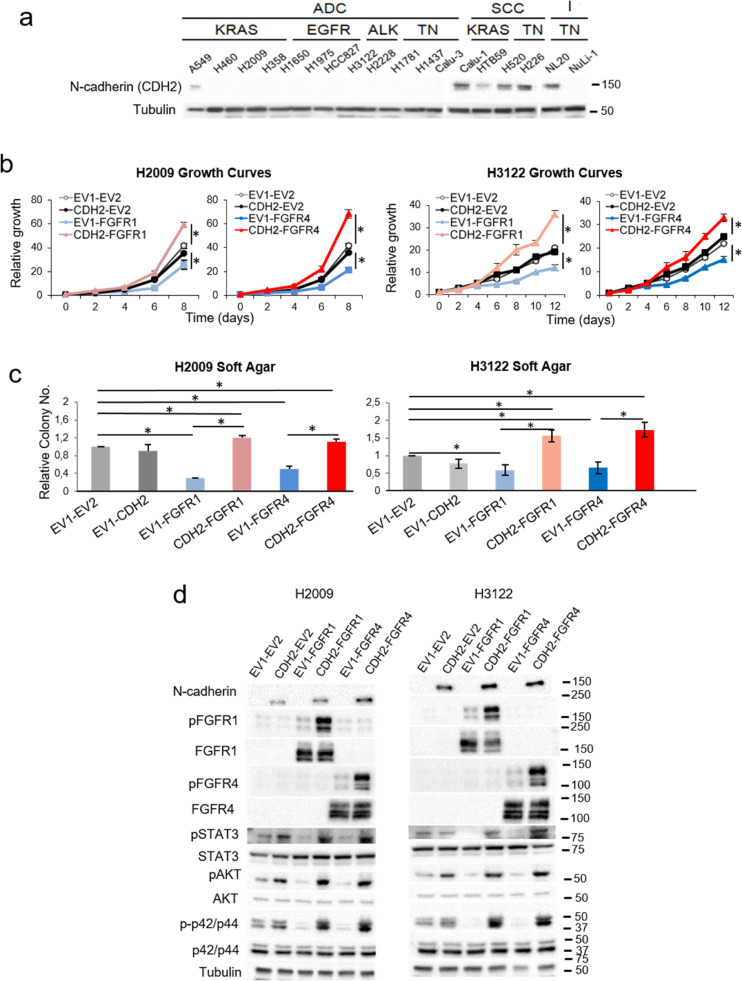
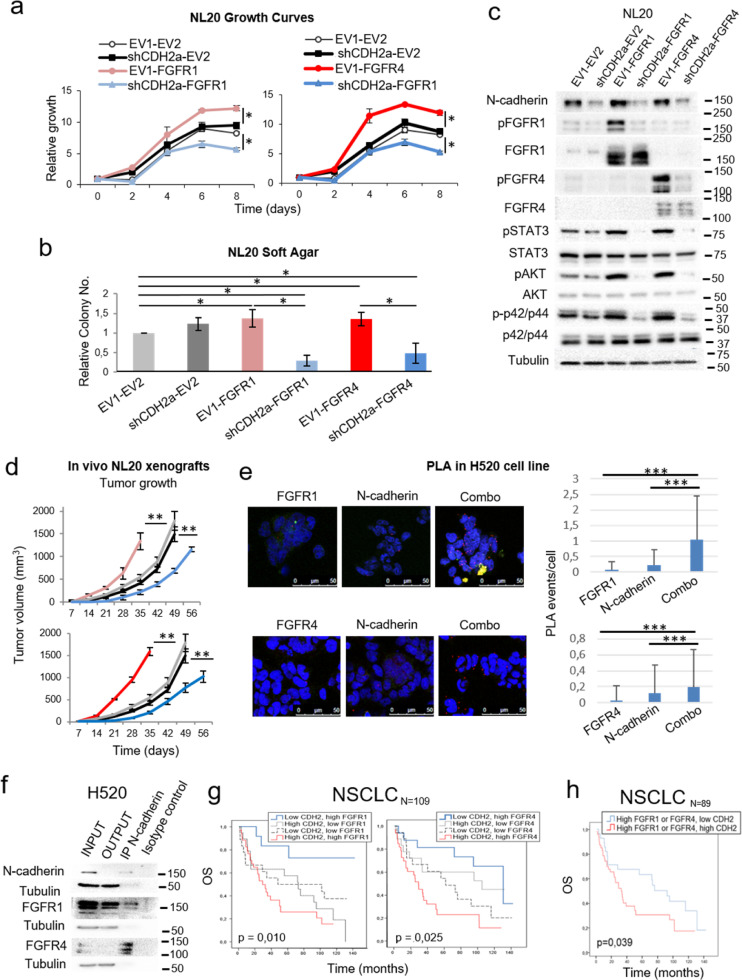
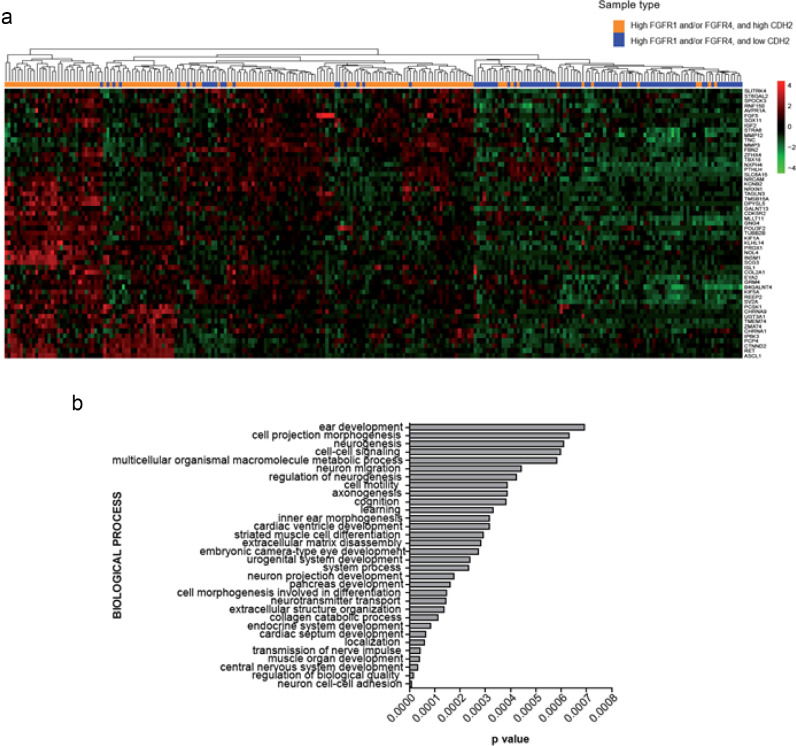
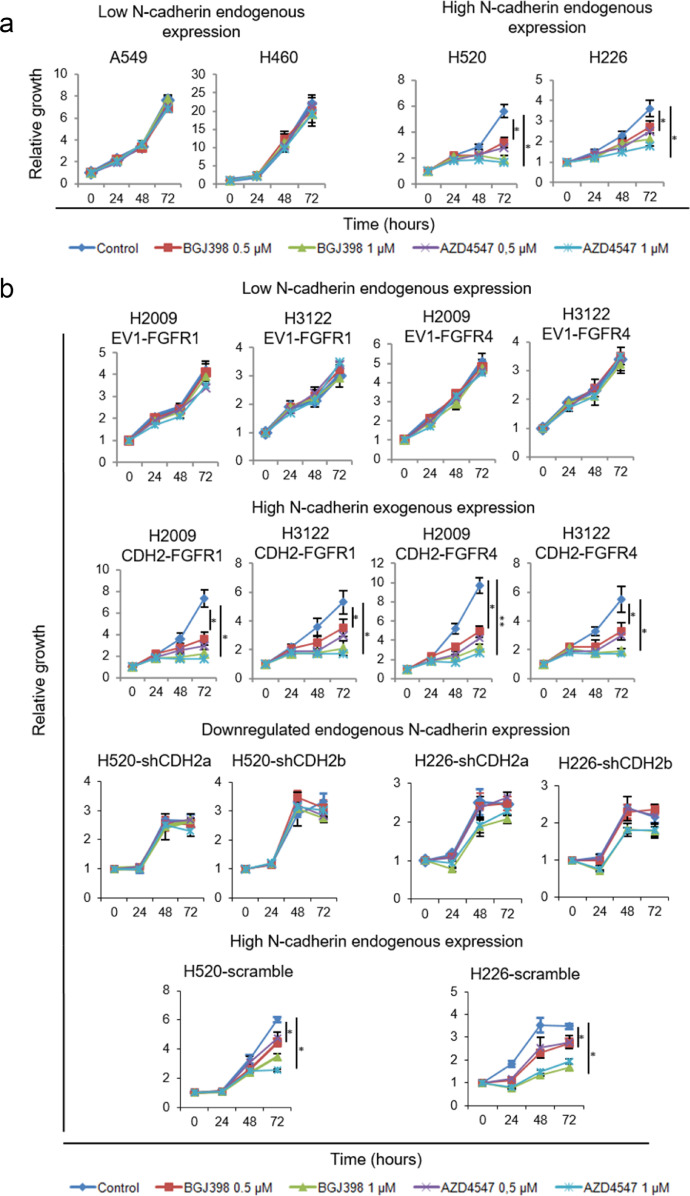
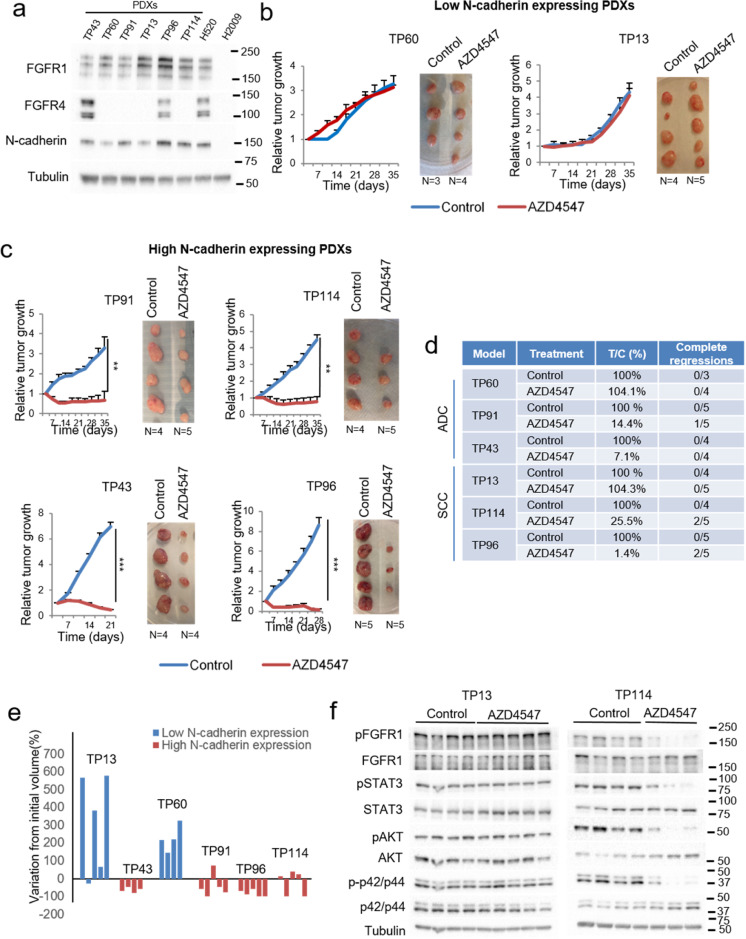
Findings: We provide in vitro and in vivo evidence showing that expression of the adhesion molecule N-cadherin is key for the oncogenic role of FGFR1/4 in non-small cell lung cancer. According to this, assessment of the expression of genes in different lung cancer patient cohorts showed that FGFR1 or FGFR4 expression alone showed no prognostic potential, and that only co-expression of FGFR1 and/or FGFR4 with N-cadherin inferred a poorer outcome. Treatment of high-FGFR1 and/or FGFR4-expressing lung cancer cell lines and patient-derived xenografts with selective FGFR inhibitors showed high efficacy, but only in models with high FGFR1/4 and N-cadherin expression.

Interpretation: Our data show that the determination of the expression of FGFR1 or FGFR4 alone is not sufficient to predict anti-FGFR therapy efficacy; complementary determination of N-cadherin expression may further optimise patient selection for this therapeutic strategy.

Keywords: FGFR inhibitors; FGFR1; FGFR4; N-cadherin; Predictive biomarker.


Conflict of interest statement

Declaration of Competing Interest Drs Quintanal-Villalonga, Molina-Pinelo, Carnero, Paz-Ares, and Ferrer jointly hold patent WO2019012174A1 and patent WO2019016422A1 (pending). Dr. Paz-Ares also reports personal fees from Roche, Lilly, MSD, BMS, AstraZeneca, Boehringer Ingelheim, Pfizer, Takeda, Novartis, Merck Serono, Amgen, Sanofi, Pharmamar, Clovis Oncology and Janssen outside the submitted work. JZ reports personal fees from Guardant Health. The remaining authors declare no conflict of interest.

Figures

Fig. 1
Fig. 1
Effects of FGFR1 and FGFR4 on lung squamous carcinoma cell lines. See also Supplementary Figure S1. Growth curves in 10% FBS (a) and soft agar assays (b) of FGFR4-overexpressing lung squamous carcinoma cell lines. (c) Western blot analysis of the activation of FGFR-related signalling pathways in FGFR4-overexpressing lung squamous carcinoma cell lines compared to empty-vector-expressing cell lines after stimulation with FBS. Growth curves in 0.5% FBS (d) and soft agar assays (e) of FGFR1- and FGFR4-silenced H520 cells (lung squamous cell carcinoma). (f) Western blot analysis of the activation of FGFR-related signalling pathways in FGFR1- and FGFR4-silenced H520 cells. All experiments were reproduced a minimum of three times in the laboratory, and three technical replicates were obtained for each experiment. For growth curves and western blots, a representative figure/image is shown. On the growth curves, the means and standard deviations of the technical replicates are shown. In the soft agar assays, all values were normalised to the empty vector control, and the mean and standard deviation of all the normalised replicates are presented. Silencing of either gene was performed using two different shRNAs, referred to as “a” and “b”. p-values were obtained with the two-sided Mann-Whitney U test and are indicated by asterisks (* p<0.05; ** p<0.01; *** p<0.001). ADC = Adenocarcinoma, SCC = Squamous cell carcinoma, I = Immortalised, KRAS = KRAS-mutated, EGFR = EGFR-mutated, ALK = ALK translocation bearer, TN = “Triple negative” (referring to the absence of alterations in KRAS, EGFR and ALK), EV = empty vector control, FGFR1 = FGFR1-overexpressing, FGFR4 = FGFR4-overexpressing, scramble = scrambled shRNA control, shFGFR1 = FGFR1 shRNA, shFGFR4 = FGFR4 shRNA, FBS = foetal bovine serum. Western blot molecular weight references are indicated to the right of the images.
Fig. 2
Fig. 2
Effects of FGFR1 and FGFR4 on non-squamous lung cell lines. See also Supplementary Figure S2. Growth curves in 10% FBS (a) and soft agar assays (b) of the FGFR1- or FGFR4-overexpressing lung adenocarcinoma cell lines H2009 and H3122. (c) Western blot analysis of the activation of FGFR-related signalling pathways in FGFR1-overexpressing H2009 and H3122 cells compared to empty-vector-expressing cells. Growth curves in 10% FBS (d) and soft agar assays (e) of FGFR1- and FGFR4-silenced A549 cells (adenocarcinoma cell line). (f) Western blot analysis of the activation of FGFR-related signalling pathways in FGFR1- and FGFR4-silenced A549 cells. All experiments were reproduced a minimum of three times in the laboratory, and three technical replicates were obtained for each experiment. For growth curves and western blots, a representative figure/image is shown. On the growth curves, the means and standard deviations of the technical replicates are shown. In the soft agar assays, all values were normalised to the empty vector control, and the mean and standard deviation of all the normalised replicates are presented. For western blots, cells were serum-starved for five hours prior to protein extraction. For the serum-stimulated conditions, serum-starved cells were incubated in serum-containing complete medium for 15 min before protein extraction. Silencing of either gene was performed using two different shRNAs, referred to as “a” and “b”. p-values were obtained with the two-sided Mann-Whitney U test and are indicated by asterisks (* p<0.05; ** p<0.01; *** p<0.001). EV = empty vector control, FGFR1 = FGFR1-overexpressing, FGFR4 = FGFR4-overexpressing, scramble = scrambled shRNA control, shFGFR1 = FGFR1 shRNA, shFGFR4 = FGFR4 shRNA, FBS = foetal bovine serum. Western blot molecular weight references are indicated to the right of the images.
Fig. 3
Fig. 3
Effects of N-cadherin on the pro-oncogenic role of FGFR1 and FGFR4. See also Supplementary Figures S3 and S4. (a) Western blots of N-cadherin and E-cadherin protein expression in our lung cell line panel. To assess the expression of these proteins in the 18 cell lines, different blots were performed in parallel with an internal reference sample and the assembled images are shown. 10% FBS growth curves (b) and soft agar assays (c) of H2009 and H3122 cells overexpressing N-cadherin and either FGFR1 or FGFR4. (d) Western blot analysis of the activation of FGFR-related signalling pathways in these cell lines. All experiments were reproduced a minimum of three times in the laboratory and three technical replicates were obtained for each experiment. For growth curves and western blots, a representative figure/image is shown. On the growth curves, the means and standard deviations of the technical replicates are shown. In the soft agar assays, all values were normalised to the empty vector control, and the mean and standard deviation of all the normalised replicates are presented. p-values were obtained with the two-sided Mann-Whitney U test and are indicated by asterisks (* p<0.05; ** p<0.01; *** p<0.001) non-SCC = non-Squamous, SCC = Squamous cell carcinoma, I = Immortalised, KRAS = KRAS-mutated, EGFR = EGFR-mutated, ALK = ALK translocation bearer, TN = “Triple negative” (referring to the absence of alterations in KRAS, EGFR and ALK), EV1 = empty vector 1, EV2 = empty vector 2, FGFR1 = FGFR1-overexpressing, FGFR4 = FGFR4-overexpressing, CDH2 = N-cadherin-overexpressing. Western blot molecular weight references are indicated to the right of the images.
Fig. 4
Fig. 4
Effects of N-cadherin on the pro-oncogenic role of FGFR1 and FGFR4 and the interaction of N-cadherin with FGFR1 and FGFR4. See also Supplementary Figure S4. (a) 0.5% FBS growth curves for FGFR1-overexpressing and N-cadherin-silenced (left) or FGFR4-overexpressing and N-cadherin-silenced (right) NL20 cells. (b) Soft agar assays of FGFR-overexpressing and N-cadherin-silenced NL20 cells. (c) Western blot analysis of the activation of FGFR-related signalling pathways in these cell lines. (d) Xenograft tumour volumes of the FGFR1, FGFR4 and N-cadherin interaction models in the immortalised NL20 cell line. (e) Proximity ligation assays (PLA) to assess the physical interaction of N-cadherin with FGFR1 (upper panel) or FGFR4 (lower panel). The interactions detected were quantified and normalised by cell number for each condition. As controls to distinguish signal from noise, interactions were quantified in the single antibody conditions (labelled as “N-cadherin”, “FGFR1” and “FGFR4”). To assess the interaction between the two proteins, both antibodies were used, either N-cadherin + FGFR1 (upper panel) or N-cadherin + FGFR4 (lower panel), in the condition labelled as “combo”. Representative images and quantifications are shown. (f) Co-immunoprecipitation of N-cadherin with FGFR1 and with FGFR4 in the H520 cell line. (g) Kaplan-Meier curves of overall survival (OS) for the entire NSCLC patient cohort (N  =  109). Patients were grouped based on FGFR1 and N-cadherin expression levels or on FGFR4 and N-cadherin expression levels. (h) OS curve of patients in the cohort with high expression of FGFR1 and/or FGFR4 stratified by N-cadherin expression levels. In each analysis, for the FGFR1 and N-cadherin genes, the cut-off point was the median mRNA expression value for that variable. For FGFR4, the cut-off point was the first-quartile mRNA expression value in the TCGA adenocarcinoma cohort. The Kaplan-Meier method was used for survival analyses of the clinical data and cell line xenograft experiments, with a Cox proportional hazards model used to adjust for explanatory variables. A log Rank analysis was used to analyse differences in survival between groups. To obtain the hazard ratio values, the Cox proportional hazards model was used. All in vitro experiments were reproduced a minimum of three times in the laboratory, and three technical replicates were obtained for each experiment. For growth curves and western blots, a representative figure/image is shown. On the growth curves, the means and standard deviations of the technical replicates are shown. In the soft agar assays, all values were normalised to the empty vector control, and the mean and standard deviation of all the normalised replicates are presented. N-cadherin silencing was performed using two different shRNAs. Results generated with the alternative shRNA are shown in Supplementary Figure S3 c-e. p-values were obtained with the two-sided Mann-Whitney U test and are indicated by asterisks (* p<0.05; ** p<0.01; *** p<0.001). EV1 = empty vector 1, EV2 = empty vector 2, FGFR1 = FGFR1-overexpressing, FGFR4 = FGFR4-overexpressing, CDH2 = N-cadherin-overexpressing, scramble = scrambled shRNA control, shCDH2 = silenced with N-cadherin shRNA. Western blot molecular weight references are indicated to the right of the images.
Fig. 5
Fig. 5
RNAseq analysis of TCGA lung adenocarcinoma and squamous cell carcinoma datasets. (a) Differential gene expression analysis in FGFR1/4high-CDH2high (n  =  145) versus FGFR1/4high-CDH2low (n  =  94) patients. The gene dataset was filtered by discarding genes whose expression was dependant on CDH2 high/low status irrespective of FGFR1 and/or FGFR4 expression (FGFR1/4low-CDH2high patients, n  =  21). Parameters were set up as logFC>1, B>0. (b) Query of defined gene expression signature against Gene Ontology. The results shown here are based in whole or in part upon data generated by the TCGA Research Network: http://cancergenome.nih.gov/.
Fig. 6
Fig. 6
Predictive potential of N-cadherin expression for anti-FGFR therapy in vitro. See also Supplementary Figure S5. Treatment for 72 h with AZD4547 or BGJ398 at a concentration of 0.5 or 1 µM was applied to cells with high endogenous expression of FGFR1 and/or FGFR4, with high or low endogenous expression of N-cadherin (a) and to cells either exogenously expressing FGFR1 or FGFR4, alone or in combination with N-cadherin, or to cells with high endogenous expression of the three genes with N-cadherin downregulation (b). All experiments were reproduced a minimum of three times in the laboratory. For growth curves, a representative figure is shown and the mean and standard deviation for the technical replicates are indicated. N-cadherin silencing was performed using two different shRNAs to avoid off-target effects. p-values were obtained with the two-sided Mann-Whitney U test and are indicated by asterisks (* p<0.05; ** p<0.01; *** p<0.001). EV1 = empty vector 1, EV2 = empty vector 2, FGFR1 = FGFR1-overexpressing, FGFR4 = FGFR4-overexpressing, CDH2 = N-cadherin-overexpressing, scramble = scrambled shRNA control, shCDH2 = silenced with N-cadherin shRNA.
Fig. 7
Fig. 7
FGFR efficacy in N-cadherin, FGFR1 and/or FGFR4 co-expressing patient-derived xenografts (PDXs). See also Supplementary Figure S6. (a) Western blot showing FGFR1, FGFR4 and N-cadherin protein expression in five different lung PDXs. AZD4547 treatment of low (b) and high (c) N-cadherin-expressing PDXs. (d) Results of the PDX treatments in terms of tumour versus control volume (T/C), and complete regressions. T/C values are expressed as percentages. (e) Graph showing the median variation in tumour volume from the initial volume, for every model, calculated as the increase or decrease in volume and expressed as a percentage. (f) Western blot showing the effects of AZD4547 treatment on FGFR-related signalling pathways in one low-N-cadherin-expressing (TP13) and one high-N-cadherin-expressing (TP114) adenocarcinoma PDX. p-values were obtained with the two-sided Mann-Whitney U test and are indicated by asterisks (* p<0.05; ** p<0.01; *** p<0.001). Western blot molecular weight references are indicated to the right of the images.

References

    1. Siegel R.L., Miller K.D., Jemal A. Cancer statistics, 2016. CA Cancer J Clin. 2016;66(1):7–30. - PubMed
    1. Lu M., Tian H., Yue W., Li L., Li S., Qi L. TFIIB-related factor 2 over expression is a prognosis marker for early-stage non-small cell lung cancer correlated with tumor angiogenesis. PLoS ONE. 2014;9(2):e88032. - PMC - PubMed
    1. Heist R.S., Engelman J.A. SnapShot: non-small cell lung cancer. Cancer Cell. 2012;21(3):448. e2. - PubMed
    1. Casaluce F., Sgambato A., Maione P., Rossi A., Ferrara C., Napolitano A. ALK inhibitors: a new targeted therapy in the treatment of advanced NSCLC. Target Oncol. 2013;8(1):55–67. - PubMed
    1. Jazieh A.R., Al Sudairy R., Abu-Shraie N., Al Suwairi W., Ferwana M., Murad M.H. Erlotinib in wild type epidermal growth factor receptor non-small cell lung cancer: a systematic review. Ann Thorac Med. 2013;8(4):204–208. - PMC - PubMed

MeSH terms