. 2020 Feb;8(1):e000831.
doi: 10.1136/bmjdrc-2019-000831.

Role of the DNA repair genes H2AX and HMGB1 in human fat distribution and lipid profiles

Affiliations

Role of the DNA repair genes H2AX and HMGB1 in human fat distribution and lipid profiles

Kerstin Rohde et al. BMJ Open Diabetes Res Care. 2020 Feb.

Abstract

Introduction: Regional fat distribution strongly relates to metabolic comorbidities. We identified the DNA repair genes H2AX and HMGB1 to be differentially expressed between human subcutaneous (SAT) and omental visceral adipose tissue (OVAT) depots. As increased DNA damage is linked to metabolic disease, we here sought to analyze whether depot-specific H2AX and HMGB1 expression is related to anthropometric and metabolic profiles of obesity. We further tested for different H2AX mRNA regulatory mechanisms by analyzing promoter DNA methylation and genotyped rs7350 in the H2AX locus.

Research design and methods: Gene expression (OVAT n=48; SAT n=55) and DNA promoter methylation data (OVAT and SAT n=77) were extracted from an existing dataset as described elsewhere. Genotype data for the 3'untranslated region (3'UTR) H2AX variant rs7350 were generated by using the TaqMan genotyping system in 243 subjects of the same cohort. Statistical analyses were done using SPSS statistics software 24 and GraphPad Prism 6.

Results: We identified H2AX being higher (p=0.002) and HMGB1 being less expressed (p=0.0001) in OVAT compared with SAT. Further, we observed positive interdepot correlations of OVAT and SAT for both HMGB1 (p=1×10⁻⁶) and H2AX mRNA levels (p=0.024). Depot-specific associations were observed for both genes' methylation levels with either high density lipoprotein cholesterol, low density lipoprotein cholesterol, triglycerides and/or with OVAT/SAT-ratio (all p<0.05). A significantly lower level of total cholesterol in minor A-Allele carriers of rs7350 compared with AG and GG carriers (p=0.001) was observed. Additionally, subjects carrying the A-allele showed lower SAT HMGB1 expression level (p=0.030).

Conclusion: Our results suggest a fat depot-specific regulation of H2AX and HMGB1 potentially mediated by both DNA methylation and genetic variation. Rs7350, DNA methylation and/or mRNA levels of H2AX and HMGB1 are related to lipid parameters. Further studies are warranted to evaluate the functional role of the DNA repair genes H2AX and HMGB1 in obesity and fat distribution.

Keywords: fat distribution; metabolic syndrome; obesity and body fat distribution; transcription.


Conflict of interest statement

Competing interests: None declared.

Figures

Figure 1
Figure 1
Proxy SNPs for rs7350 in Americans with CEU. Presented are SNPs in linkage disequilibrium to rs7350 in Americans with CEU. The x-axis represents chromosomal position in mega bases on Chr11 according to GRCh37. In addition, genomic location of H2AX is indicated on the x-axis. Peaks highlight recombination hot spots while colors represent functional classes of the genetic variants presented (yellow=coding; red=noncoding; blue=query variant: rs7350). Numbers within the dots rates the regulatory potential of the variant from 1 (high) to 7 (low). Size of dots represents minor allele frequency from small (rare variant) to large (common variant). Details can be found at: (https://ldlink.nci.nih.gov/?var=rs7350&pop=CEU&r2_d=r2&tab=ldproxy). CEU, Central European Ancestry; Chr 11, chromosome 11; cMMb=combined recombination rate; GRCh37, Genome Release 37; Mb, mega bases; R², recombination rate, SNP, single nucleotide polymorphism.
Figure 2
Figure 2
Adipose tissue depot-specific differences in H2AX and HMGB1 gene expression and correlation analyses. (A, B) Data are presented as mean±SD. P-values were calculated using paired samples t-tests in n=41 due to overlapping mRNA data in SAT and OVAT and given as asterix (** = P<0.01; *** = P<0.001). OVAT, omental visceral adipose tissue; SAT, subcutaneous adipose tissue.
Figure 3
Figure 3
Adipose tissue depot-specific correlations of H2AX and HMGB1 gene expression and DNA promoter methylation. (A–D) Data were calculated using linear regression analyses adjusted for age, sex, BMI in (A, C) n=38 and in (B, D) n=33. B, regression coefficient; BMI, body mass index; OVAT, omental visceral adipose tissue; P, P-value; SAT, subcutaneous adipose tissue.
Figure 4
Figure 4
Interdepot correlation of H2AX and HMGB1 mRNA expression level. Data were calculated using linear regression analyses adjusted for age, sex and BMI in n=41 subjects due to overlapping mRNA expression data of SAT and OVAT. (A) correlation of H2AX mRNA expression level between SAT and OVAT, (B) correlation of HMGB1 mRNA expression level between SAT and OVAT. B, regression coefficient; BMI, body mass index; OVAT, omental visceral adipose tissue; P, P-value; SAT, subcutaneous adipose tissue.
Figure 5
Figure 5
The minor allele of rs7350 is associated with lower total cholesterol level. Data are presented as boxplots with median and quartile distribution. P-values were evaluated using linear regression analyses adjusted for age, sex and BMI for an additive (AA versus AG versus GG; p=0.001), dominant (AA+AG versus GG; p=0.004) or recessive (AA versus AG+GG; p=0.026) mode of inheritance. Numbers of subjects with overlapping SNP and phenotype data for total cholesterol are AA=27, AG=59 and GG=47. BMI, body mass index; **, P-value of additive model; log, logarithmus10. SNP, single nucleotide polymorphism.
Figure 6
Figure 6
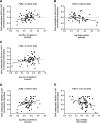
Association analyses between DNA methylation level and clinical relevant parameters of lipid metabolism and fat distribution. Data were calculated using linear regression analyses adjusted for age, sex and BMI. Numbers of subjects (N) vary due to availability of phenotype data. CT ratio. (A, B) correlation of H2AX promoter methylation level in SAT with HDL-C (n=57) and triglycerides (n=47). (C) Correlation between H2AX promoter methylation level in OVAT and LDL-C (n=58). (D, E) correlation of HMGB1 promoter methylation level in SAT with HDL-C (n=57) and CT ratio (n=69). B, regression coefficient; BMI, body mass index; HDL-C, high density lipoprotein cholesterol; LDL-C, low density lipoprotein cholesterol; OVAT, omental visceral adipose tissue; P, P-value; SAT, subcutaneous adipose tissue.

Similar articles

Cited by

References

    1. Blüher M. The distinction of metabolically ‘healthy’ from ‘unhealthy’ obese individuals. Curr Opin Lipidol 2010;21:38–43. 10.1097/MOL.0b013e3283346ccc - DOI - PubMed
    1. Klöting N, Fasshauer M, Dietrich A, et al. . Insulin-sensitive obesity. Am J Physiol Endocrinol Metab 2010;299:E506–15. 10.1152/ajpendo.00586.2009 - DOI - PubMed
    1. Villaret A, Galitzky J, Decaunes P, et al. . Adipose tissue endothelial cells from obese human subjects: differences among depots in angiogenic, metabolic, and inflammatory gene expression and cellular senescence. Diabetes 2010;59:2755–63. 10.2337/db10-0398 - DOI - PMC - PubMed
    1. Vergoni B, Cornejo P-J, Gilleron J, et al. . Dna damage and the activation of the p53 pathway mediate alterations in metabolic and secretory functions of adipocytes. Diabetes 2016;65:3062–74. 10.2337/db16-0014 - DOI - PubMed
    1. Bonner WM, Redon CE, Dickey JS, et al. . γH2AX and cancer. Nat Rev Cancer 2008;8:957–67. 10.1038/nrc2523 - DOI - PMC - PubMed

Publication types

MeSH terms