. 2020 Aug;15(8):841-858.
doi: 10.1080/15592294.2020.1734149. Epub 2020 Feb 29.

A Dysregulated DNA Methylation Landscape Linked to Gene Expression in MLL-Rearranged AML

Affiliations

A Dysregulated DNA Methylation Landscape Linked to Gene Expression in MLL-Rearranged AML

Michael A Koldobskiy et al. Epigenetics. 2020 Aug.

Abstract

Translocations of the KMT2A (MLL) gene define a biologically distinct and clinically aggressive subtype of acute myeloid leukaemia (AML), marked by a characteristic gene expression profile and few cooperating mutations. Although dysregulation of the epigenetic landscape in this leukaemia is particularly interesting given the low mutation frequency, its comprehensive analysis using whole genome bisulphite sequencing (WGBS) has not been previously performed. Here we investigated epigenetic dysregulation in nine MLL-rearranged (MLL-r) AML samples by comparing them to six normal myeloid controls, using a computational method that encapsulates mean DNA methylation measurements along with analyses of methylation stochasticity. We discovered a dramatically altered epigenetic profile in MLL-r AML, associated with genome-wide hypomethylation and a markedly increased DNA methylation entropy reflecting an increasingly disordered epigenome. Methylation discordance mapped to key genes and regulatory elements that included bivalent promoters and active enhancers. Genes associated with significant changes in methylation stochasticity recapitulated known MLL-r AML expression signatures, suggesting a role for the altered epigenetic landscape in the transcriptional programme initiated by MLL translocations. Accordingly, we established statistically significant associations between discordances in methylation stochasticity and gene expression in MLL-r AML, thus providing a link between the altered epigenetic landscape and the phenotype.

Keywords: DNA methylation; DNA methylation stochasticity; Leukaemia.


Conflict of interest statement

R.M. is co-founder, consultant, equity holder, and serves on the Board of Directors of Forty Seven Inc. The are no other potential competing interests.

Figures

Figure 1.
Figure 1.
Distributions of the DNA methylation state in MLL-r AML and normal controls. (a) Boxplots of genome-wide distributions of mean methylation level (MML), normalized methylation entropy (NME), and methylation sensitivity index (MSI) values in 9 MLL-r AML and 6 normal control samples. Centre line, median; box, interquartile range (IQR); whiskers, 1.5 × IQR. Median differences between AML and normal were statistically evaluated using the Wilcoxon signed-rank test with p-values (p) and effect sizes (e) as shown. (b) Densities of genome-wide distributions of MML, NME, and MSI values in a representative MLL-r AML sample (AML-2) versus a CD34 sample (CD34-1). (c) Aggregate (mean) MML, NME, and MSI values in all MLL-r AML and normal control samples at CpG sites within promoter regions (± 2-kb from TSS). (d) First two coordinates of the multidimensional scaling (MDS) representation of the MLL-r AML and normal control samples based on a dissimilarity measure using the average Jensen-Shannon distances (JSDs) between the probability distributions of mean methylation levels within analysis regions in chromosome 1 computed from each AML/normal comparison.
Figure 2.
Figure 2.
Quantifying discordance of methylation stochasticity in MLL-r AML. (a) Boxplots of distributions of Jensen-Shannon distance (JSD), differential mean methylation level (dMML), differential normalized methylation entropy (dNME), and differential methylation sensitivity (dMSI) values observed in all MLL-r AML/normal CD34 comparisons genome-wide, and within CpG islands (CGIs), island shores, shelves, open sea, gene bodies, exons, introns, and intergenic regions. Centre line, median; box, interquartile range (IQR); whiskers, 1.5 × IQR. (b) Boxplots of distributions of JSD, dMML, dNME, and dMSI values observed in all MLL-r AML/normal CD34 comparisons within 25 ChromHMM genomic annotations [12] of normal haematopoietic stem and progenitor cells. Centre line, median; box, interquartile range (IQR); whiskers, 1.5 × IQR. p-values and effect sizes (Wilcoxon rank-signed test) are provided in Tables S3B-S3E. (c) Aggregate (mean) MML, NME, and MSI values in all MLL-r AML and normal control samples at CpG sites within active enhancer 1 (EnhA1) and bivalent promoter (PromBiv) regions (±4-kb).
Figure 3.
Figure 3.
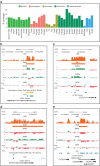
Discordance of DNA methylation stochasticity localizes to key regulatory regions and genes.
Figure 4.
Figure 4.
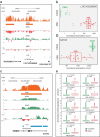
DNA methylation relates to gene expression in MLL-r AML. (a) UCSC genome browser image of the 15q13.1 chromosomal band previously found to contain the most differentially expressed genes in MLL-r AML, including LOC100289656, a suggested MLL-r AML biomarker [6]. The image shows the Jensen-Shannon distance (JSD) values and computed differential methylated regions (DMRs) of statistically significant JSDs, as well values of the differential mean methylation level (dMML), the differential normalized methylation entropy (dNME), and the differential methylation sensitivity index (dMSI). (b) Gene expression of LOC100289656 in normal CD34 (n=17) and MLL-r AML (n=31) cell populations, showing its upregulation in MLL-r AML. (c) UCSC genome browser image of a genomic region containing GATA2. The image shows the JSD values along the genome and a computed DMR of statistically significant JSDs, as well associated dMML, dNME, and dMSI values. (d) Gene expression of GATA2 in normal CD34 (n=17) and MLL-r AML (n=31) cell populations, showing its downregulation in MLL-r AML. (e) Boxplots of distributions of absolute log-fold changes in the expression of differentially methylated genes (DMGs) and non-DMGs in all MLL-r AML to CD34-1 comparisons. Centre line, median; box, interquartile range (IQR); whiskers, 1.5 × IQR. Few outliers above 15 are not shown for legibility. Differences in absolute log-fold expression changes between DMGs and non-DMGs were statistically evaluated using Wilcoxon rank-sum tests with p-values (p) and effect sizes (e) as shown.

References

    1. Papaemmanuil E, Gerstung M, Bullinger L, et al. Genomic classification and prognosis in acute myeloid leukemia. N Engl J Med. 2016;374(23):2209–2221. - PMC - PubMed
    1. Krivtsov AV, Hoshii T, Armstrong SA.. Mixed-lineage leukemia fusions and chromatin in leukemia. Cold Spring Harb Perspect Med. 2017;7(11):a026658. - PMC - PubMed
    1. Meyer C, Burmeister T, Groger D, et al. The MLL recombinome of acute leukemias in 2017. Leukemia. 2018;32(2):273–284. - PMC - PubMed
    1. Cancer Genome Atlas Research N, Ley TJ, Miller C, Ding L, et al. Genomic and epigenomic landscapes of adult de novo acute myeloid leukemia. N Engl J Med 2013;368(22):2059–2074. - PMC - PubMed
    1. Armstrong SA, Staunton JE, Silverman LB, et al. MLL translocations specify a distinct gene expression profile that distinguishes a unique leukemia. Nat Genet. 2002;30(1):41–47. - PubMed

Publication types

MeSH terms

Substances