. 2020 May;14(5):1101-1117.
doi: 10.1002/1878-0261.12655. Epub 2020 Mar 13.

Transcriptome profiling of Ewing sarcomas - treatment resistance pathways and IGF-dependency

Affiliations

Transcriptome profiling of Ewing sarcomas - treatment resistance pathways and IGF-dependency

Yi Chen et al. Mol Oncol. 2020 May.

Abstract

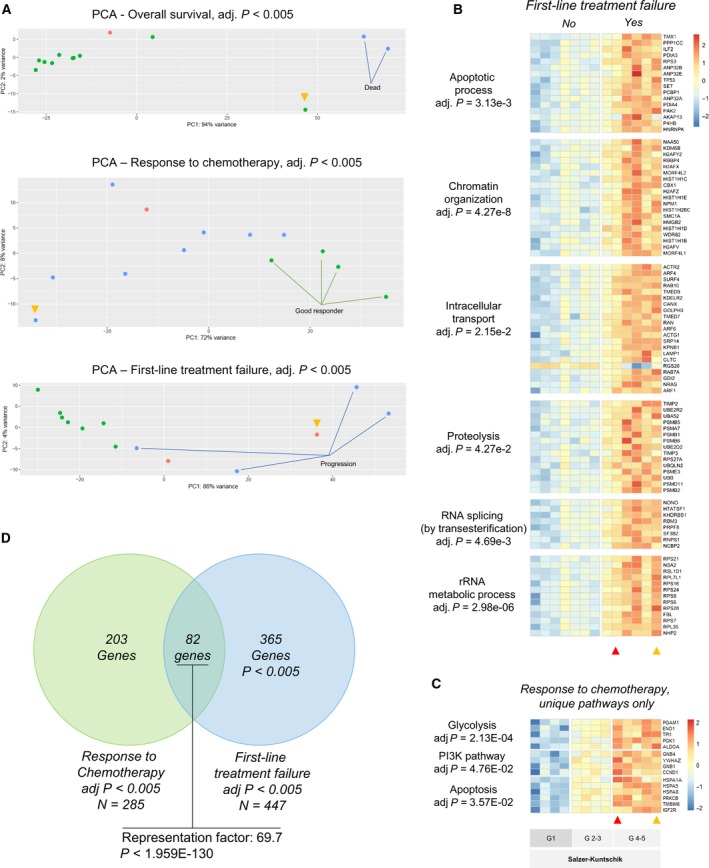
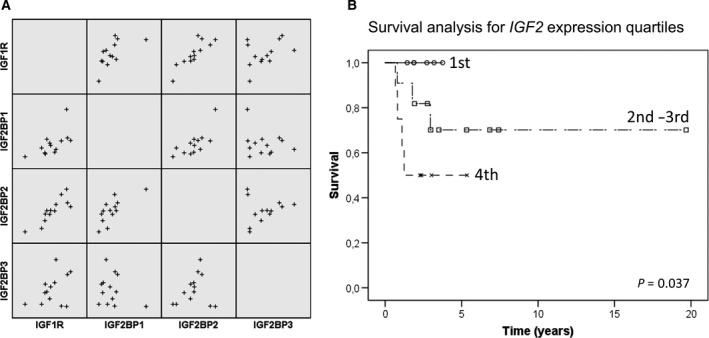
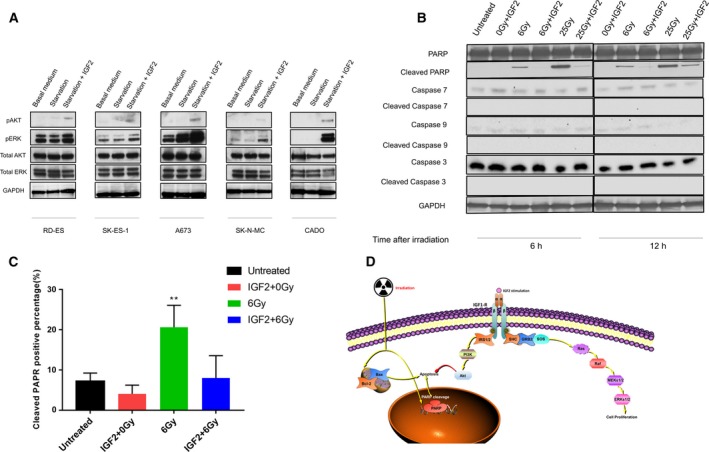
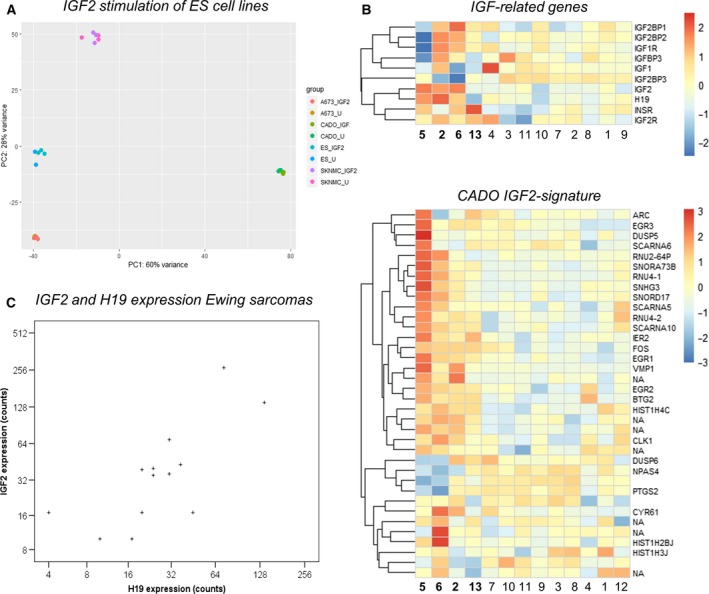
Ewing sarcomas (ESs) are aggressive sarcomas driven by EWS fusion genes. We sought to investigate whether whole-transcriptome sequencing (RNA-seq) could be used to detect patterns associated with chemotherapy response or tumor progression after first-line treatment. Transcriptome sequencing (RNA-seq) of 13 ES cases was performed. Among the differentially expressed pathways, we identified IGF2 expression as a potential driver of chemotherapy response and progression. We investigated the effect of IGF2 on proliferation, radioresistance, apoptosis, and the transcriptome pattern in four ES cell lines and the effect of IGF2 expression in a validation series of 14 patients. Transcriptome analysis identified differentially expressed genes (adj. P < 0.005) and pathways associated with chemotherapy response (285 genes), short overall survival (662 genes), and progression after treatment (447 genes). Imprinting independent promoter P3-mediated IGF2 expression was identified in a subset of cases with aggressive clinical course. In ES cell lines, IGF2 induced proliferation, but promoted radioresistance only in CADO cells. High IGF2 expression was also significantly associated with shorter overall survival in patients with ES. Transcriptome analysis of the clinical samples and the cell lines revealed an IGF-dependent signature, potentially related to a stem cell-like phenotype. Transcriptome analysis is a potentially powerful complementary tool to predict the clinical behavior of ES and may be utilized for clinical trial stratification strategies and personalized oncology. Certain gene signatures, for example, IGF-related pathways, are coupled to biological functions that could be of clinical importance. Finally, our results indicate that IGF inhibition may be successful as a first-line therapy in conjunction with conventional radiochemotherapy for a subset of patients.

Keywords: Ewing sarcoma; IGF2; RNA-seq; apoptosis; transcriptome profiling; tumor progression.


Conflict of interest statement

The authors declare no conflict of interest.

Figures

Fig. 1
Fig. 1
Differentially expressed genes and pathways in Ewing sarcomas. (A) Principal component analysis (PCA) depicting differentially expressed (DE) genes at adjusted P < 0.005. In the top plot (overall survival), green dots indicate living patients and blue dots dead patients at follow‐up. In the middle plot (response to chemotherapy), green dots indicate good response to chemotherapy (> 90% necrosis or complete radiological response) and blue dots indicate poor responders. In the bottom plot (first‐line treatment failure), blue dots indicate progression after therapy. In all PCAs, the red dots were not included (lost to follow‐up). The yellow arrow indicates the patient who was excluded from (first‐line treatment failure) analysis as described in the Materials and methods section. The heat maps depict expression levels of DE genes in six pathways linked to first‐line treatment failure (B) and three pathways only associated with response to chemotherapy (C). Tumor chemotherapy response was graded according to Salzer‐Kuntschik (G1–G5) as indicated. A Venn diagram (D) shows the overlap of genes involved in response to chemotherapy and first‐line treatment failure.
Fig. 2
Fig. 2
Co‐variation of IGF‐related genes and survival analysis based on IGF2 expression in Ewing sarcomas: (A) Scatter plot showing expression correlation of four IGF‐associated genes in ES using RNA‐seq. There was a significant correlation (Pearson’s correlation, P < 0.05, R > 0.5) between many IGF‐related genes, including IGF1R and IGF2R, IGF1BP3, IGF2BP1, and IGF2BP2; or IGF2 and IGF2BP1, IGF2BP2, and H19 (not all genes and correlates shown in the scatterplot). (B) The Kaplan–Meier curves comparing IGF2 expression in ES using RNA‐seq (13 cases) and qRT–PCR (14 cases). Expression quartiles were calculated separately for the two methods. A log‐rank (Mantel–Cox) comparison showed significantly shorter survival with increased IGF2 expression quartiles (P = 0.037).
Fig. 3
Fig. 3
Effects of IGF2 on ES cell proliferation and cell apoptosis in vitro. ES cells were cultured in serum‐free medium for 24 h and stimulated with IGF2 (100 ng·mL−1) for 3 h prior to irradiation (6 Gy). (A) CCK‐8 assays were performed to detect the effects of irradiation and IGF2 stimulation on ES cell viability by 24 and 48 h. (B) Flow cytometry analysis showing the late (upper right) and early (lower right) apoptotic rates of CADO cells after irradiation and/or IGF2 stimulation, respectively. (C) Bar plots representing the percentages of early, late, and total apoptotic rates in RD‐ES (black), SK‐ES‐1 (red), A673 (green), SK‐N‐MC (blue), and CADO (purple) cells. Error bars represent the standard error of the mean from at least three independent experiments. *P < 0.05, **P < 0.01 (Student’s t‐tests).
Fig. 4
Fig. 4
IGF2 contributes to the development of radioresistance in ES lines based on AKT and ERK phosphorylation. ES cells were cultured at serum‐free medium for 24 h, and then stimulated with IGF2 (100 ng·mL−1) for 0.5 h (A) or 3 h (B–D) prior to irradiation (6 Gy). Western blot analysis (A) showing IGF2/IGF‐1R signal transduction in ES cells, including pAKT, pERK, total AKT, and total ERK following IGF2 stimulation, and PARP and Caspase cleavage following irradiation (6 or 25 Gy) and IGF2 stimulation in CADO cell by 6 and 12 h. GAPDH was stained as a loading control. (C) Bar plots representing the proportion of cleaved PARP after irradiation and/or IGF2 stimulation as determined by an immunofluorescence assay. Error bars represent the standard error of the mean from at least ten random areas. *P < 0.05, **P < 0.01 (Student’s t‐test). (D) Schematic model of IGF2/IGF1R‐induced AKT and ERK signaling in Ewing sarcoma cells, including increase in proliferation and PARP‐mediated radioresistance and decreased apoptosis.
Fig. 5
Fig. 5
IGF2 induced changes in ES cell lines and IGF2 signatures in clinical ES. (A) Principal component analysis (PCA) plot of all genes in four ES cell lines with and without IGF2 stimulation. Dot colors indicate cell line (A673, CADO, ES‐1, or SKNMC) and IGF2 treatment condition (IGF2 = 100 ng·mL−1 of IGF2 treatment, U = untreated) for three replicates per condition as shown in the legend to the right. The clearest separation was seen in the CADO cells. (B) Heat maps showing expression levels of IGF‐related genes and the CADO IGF2 signature (differentially expressed after IGF2 stimulation) in Ewing sarcomas identified by RNA‐seq. Euclidean clustering of cases showed a similar separation of cases with bona fide higher IGF‐signaling dependency (cases 5, 6, 2, and 13). (C) Scatter plot showing a significant correlation (Pearson’s correlation; P = 0.010 and r = 0.683) between IGF2 expression and H19 gene expression in Ewing sarcomas by RNA‐seq.

References

    1. Akhtar M, Holmgren C, Gondor A, Vesterlund M, Kanduri C, Larsson C and Ekstrom TJ (2012) Cell type and context‐specific function of PLAG1 for IGF2 P3 promoter activity. Int J Oncol 41, 1959–1966. - PMC - PubMed
    1. Anderson ND, de Borja R, Young MD, Fuligni F, Rosic A, Roberts ND, Hajjar S, Layeghifard M, Novokmet A, Kowalski PE et al (2018) Rearrangement bursts generate canonical gene fusions in bone and soft tissue tumors. Science 361, 30166462. 10.1126/science.aam8419 - DOI - PMC - PubMed
    1. Biswas B and Bakhshi S (2016) Management of Ewing sarcoma family of tumors: current scenario and unmet need. World J Orthop 7, 527–538. - PMC - PubMed
    1. Brohl AS, Solomon DA, Chang W, Wang J, Song Y, Sindiri S, Patidar R, Hurd L, Chen L, Shern JF et al (2014) The genomic landscape of the Ewing Sarcoma family of tumors reveals recurrent STAG2 mutation. PLoS Genet 10, e1004475. - PMC - PubMed
    1. Crompton BD, Stewart C, Taylor‐Weiner A, Alexe G, Kurek KC, Calicchio ML, Kiezun A, Carter SL, Shukla SA, Mehta SS et al (2014) The genomic landscape of pediatric Ewing sarcoma. Cancer Discov 4, 1326–1341. - PubMed

Publication types

MeSH terms