

Unraveling the transcriptional determinants of liver sinusoidal endothelial cell specialization
- PMID: 32116021
- PMCID: PMC7191457
- DOI: 10.1152/ajpgi.00215.2019
Unraveling the transcriptional determinants of liver sinusoidal endothelial cell specialization
Abstract
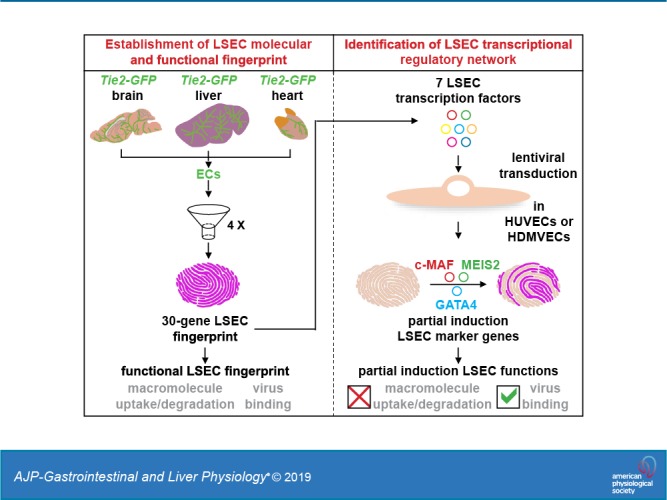
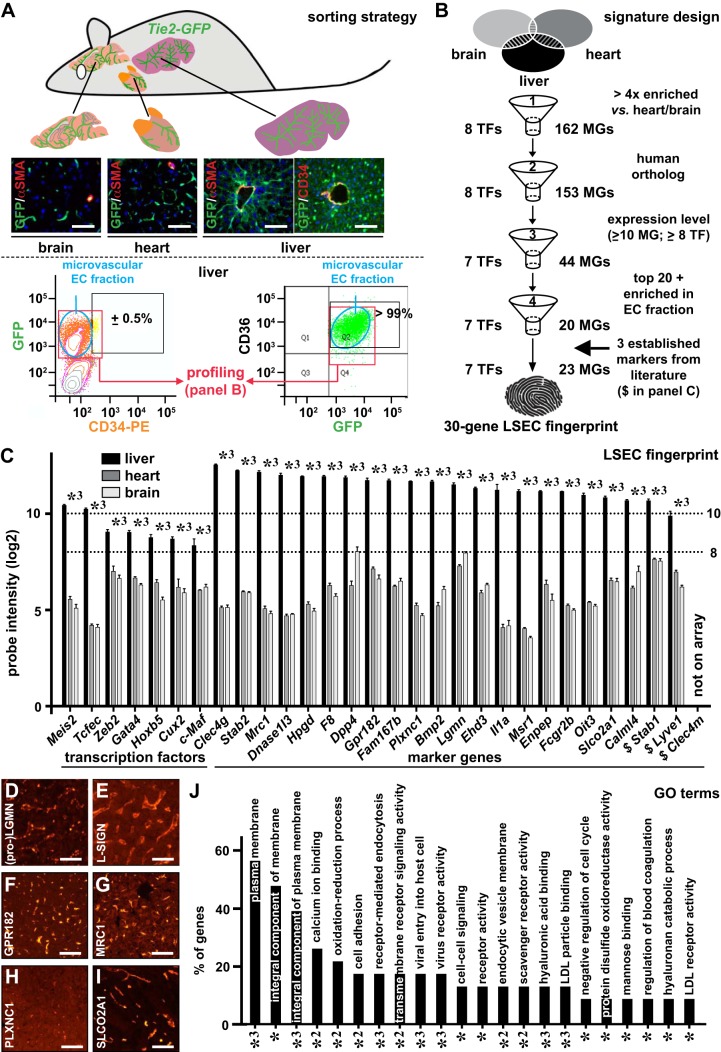
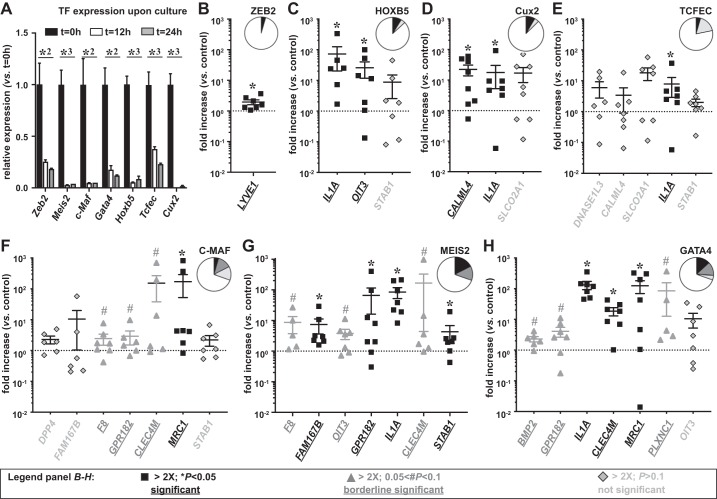
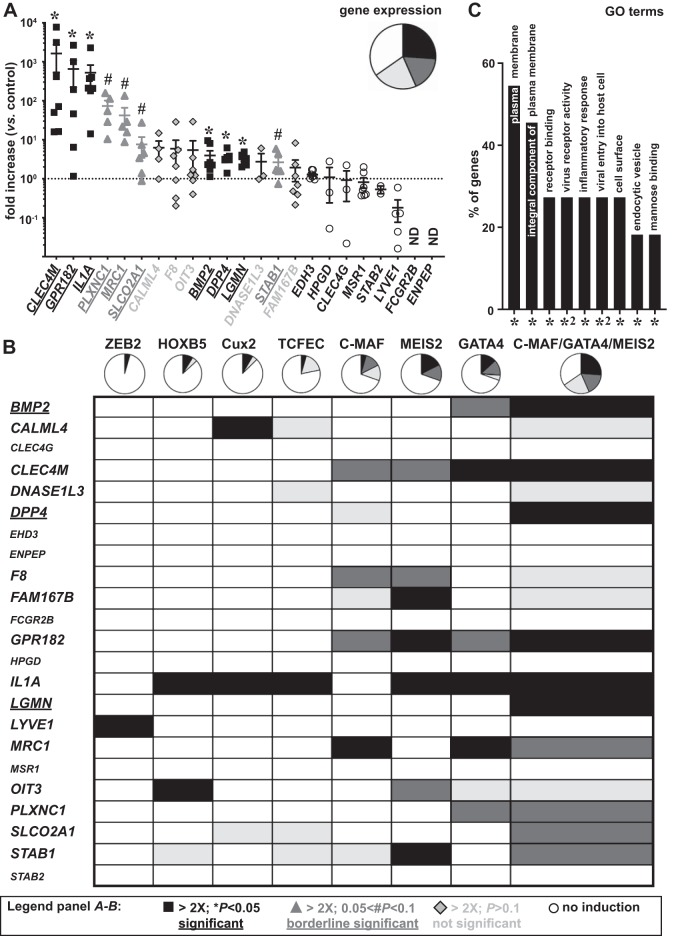
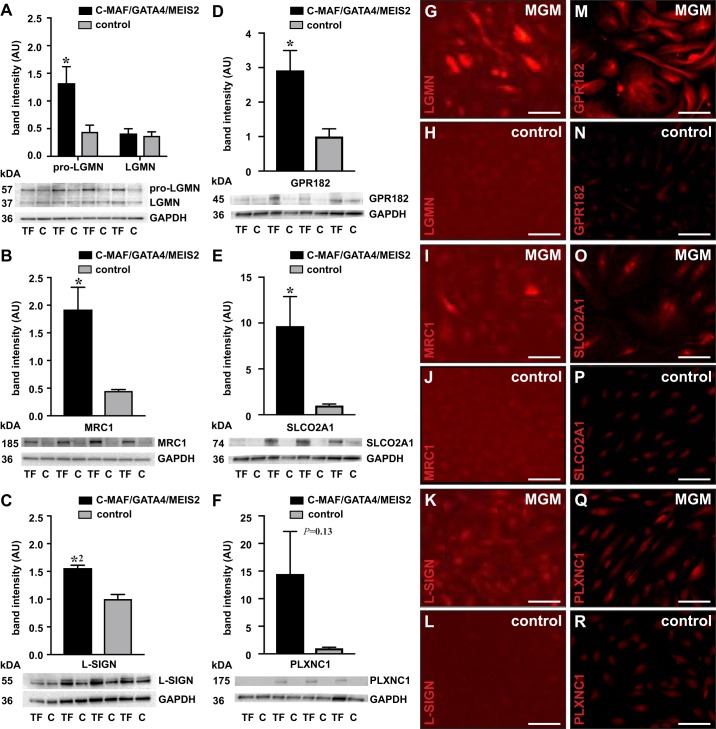
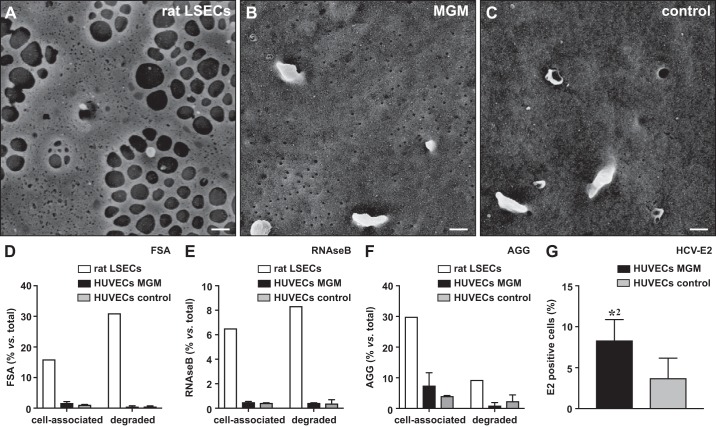
Liver sinusoidal endothelial cells (LSECs) are the first liver cells to encounter waste macromolecules, pathogens, and toxins in blood. LSECs are highly specialized to mediate the clearance of these substances via endocytic scavenger receptors and are equipped with fenestrae that mediate the passage of macromolecules toward hepatocytes. Although some transcription factors (TFs) are known to play a role in LSEC specialization, information about the specialized LSEC signature and its transcriptional determinants remains incomplete.Based on a comparison of liver, heart, and brain endothelial cells (ECs), we established a 30-gene LSEC signature comprising both established and newly identified markers, including 7 genes encoding TFs. To evaluate the LSEC TF regulatory network, we artificially increased the expression of the 7 LSEC-specific TFs in human umbilical vein ECs. Although Zinc finger E-box-binding protein 2, homeobox B5, Cut-like homolog 2, and transcription factor EC (TCFEC) had limited contributions, musculoaponeurotic fibrosarcoma (C-MAF), GATA binding protein 4 (GATA4), and MEIS homeobox 2 (MEIS2) emerged as stronger inducers of LSEC marker expression. Furthermore, a combination of C-MAF, GATA4, and MEIS2 showed a synergistic effect on the increase of LSEC signature genes, including liver/lymph node-specific ICAM-3 grabbing non-integrin (L-SIGN) (or C-type lectin domain family member M (CLEC4M)), mannose receptor C-Type 1 (MRC1), legumain (LGMN), G protein-coupled receptor 182 (GPR182), Plexin C1 (PLXNC1), and solute carrier organic anion transporter family member 2A1 (SLCO2A1). Accordingly, L-SIGN, MRC1, pro-LGMN, GPR182, PLXNC1, and SLCO2A1 protein levels were elevated by this combined overexpression. Although receptor-mediated endocytosis was not significantly induced by the triple TF combination, it enhanced binding to E2, the hepatitis C virus host-binding protein. We conclude that C-MAF, GATA4, and MEIS2 are important transcriptional regulators of the unique LSEC fingerprint and LSEC interaction with viruses. Additional factors are however required to fully recapitulate the molecular, morphological, and functional LSEC fingerprint.NEW & NOTEWORTHY Liver sinusoidal endothelial cells (LSECs) are the first liver cells to encounter waste macromolecules, pathogens, and toxins in the blood and are highly specialized. Although some transcription factors are known to play a role in LSEC specialization, information about the specialized LSEC signature and its transcriptional determinants remains incomplete. Here, we show that Musculoaponeurotic Fibrosarcoma (C-MAF), GATA binding protein 4 (GATA4), and Meis homeobox 2 (MEIS2) are important transcriptional regulators of the unique LSEC signature and that they affect the interaction of LSECs with viruses.
Keywords: endothelial heterogeneity; liver sinusoidal endothelial cell specification; transcription factors.
Conflict of interest statement
No conflicts of interest, financial or otherwise, are declared by the authors.
Figures
References
-
- Aird WC. Phenotypic heterogeneity of the endothelium. II. Representative vascular beds. Circ Res 100: 174–190, 2007. doi:10.1161/01.RES.0000255690.03436.ae. - DOI - PubMed
-
- Arai T, Sakurai T, Kamiyoshi A, Ichikawa-Shindo Y, Iinuma N, Iesato Y, Koyama T, Yoshizawa T, Uetake R, Yamauchi A, Yang L, Kawate H, Ogawa S, Kobayashi A, Miyagawa S, Shindo T. Induction of LYVE-1/stabilin-2-positive liver sinusoidal endothelial-like cells from embryoid bodies by modulation of adrenomedullin-RAMP2 signaling. Peptides 32: 1855–1865, 2011. doi:10.1016/j.peptides.2011.07.005. - DOI - PubMed
-
- Aranguren XL, Agirre X, Beerens M, Coppiello G, Uriz M, Vandersmissen I, Benkheil M, Panadero J, Aguado N, Pascual-Montano A, Segura V, Prósper F, Luttun A. Unraveling a novel transcription factor code determining the human arterial-specific endothelial cell signature. Blood 122: 3982–3992, 2013. doi:10.1182/blood-2013-02-483255. - DOI - PubMed
Publication types
MeSH terms
Substances
LinkOut - more resources
Full Text Sources
Other Literature Sources
Research Materials
Miscellaneous