

GR-mediated FTO transactivation induces lipid accumulation in hepatocytes via demethylation of m6A on lipogenic mRNAs
- PMID: 32116145
- PMCID: PMC7549648
- DOI: 10.1080/15476286.2020.1736868
GR-mediated FTO transactivation induces lipid accumulation in hepatocytes via demethylation of m6A on lipogenic mRNAs
Abstract
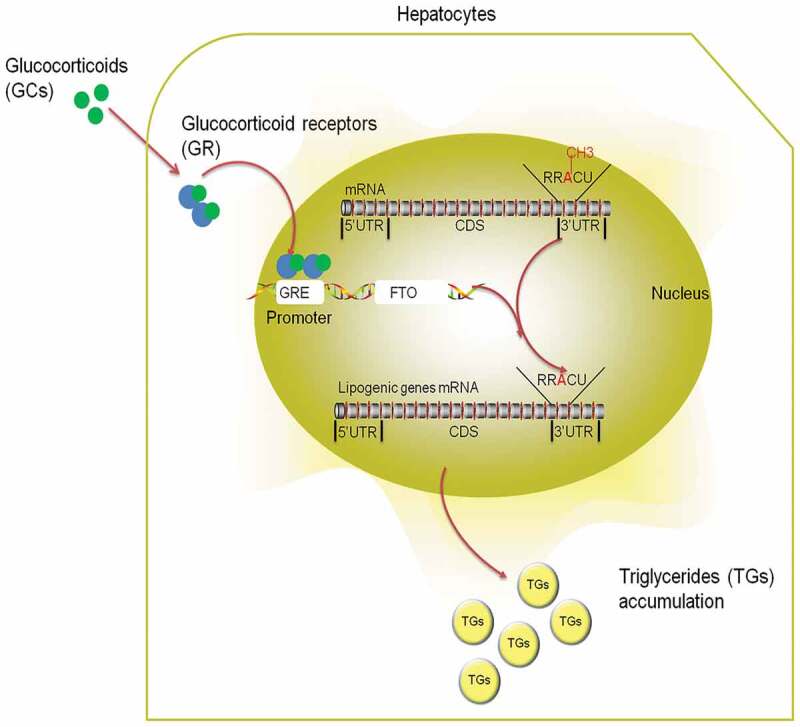
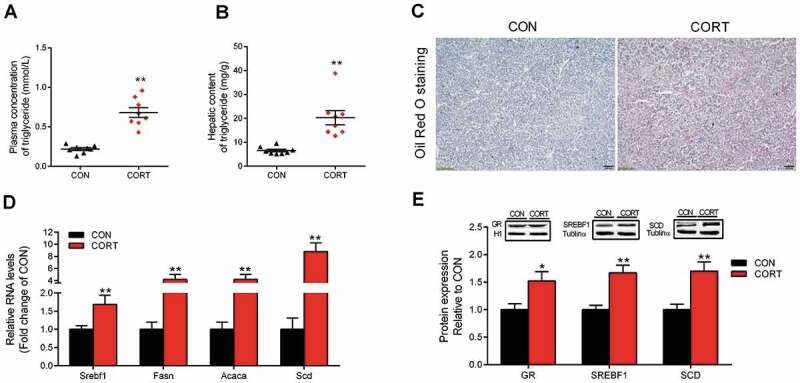
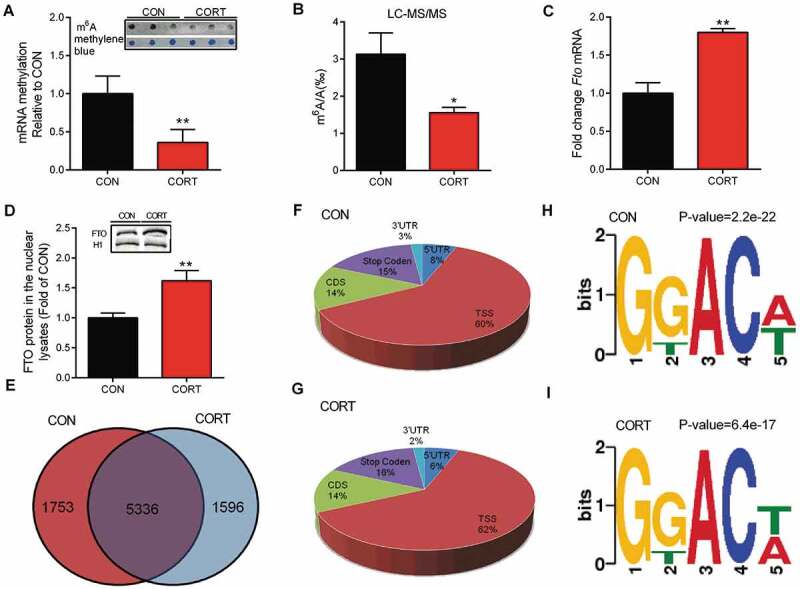
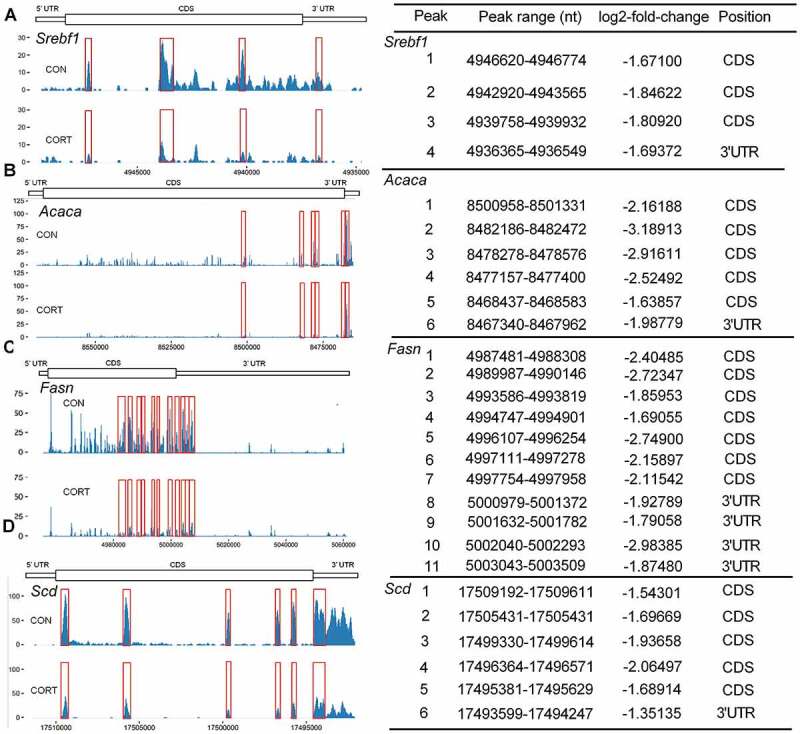
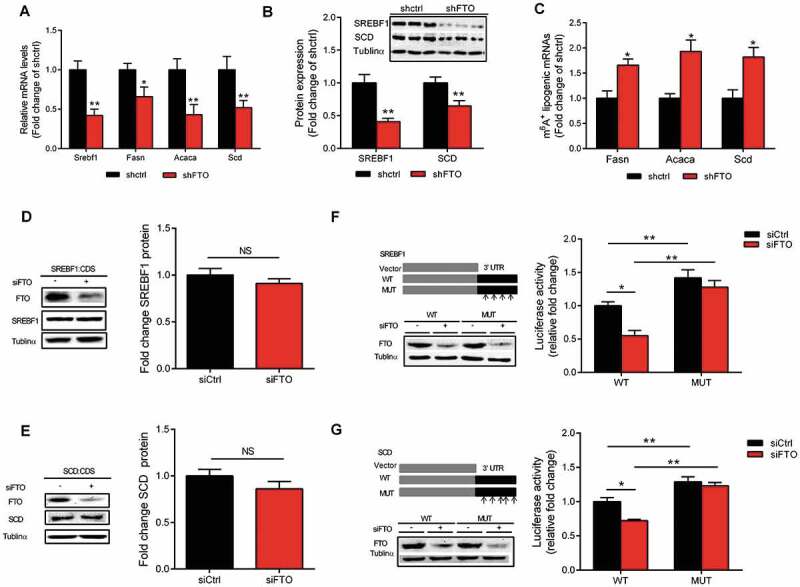
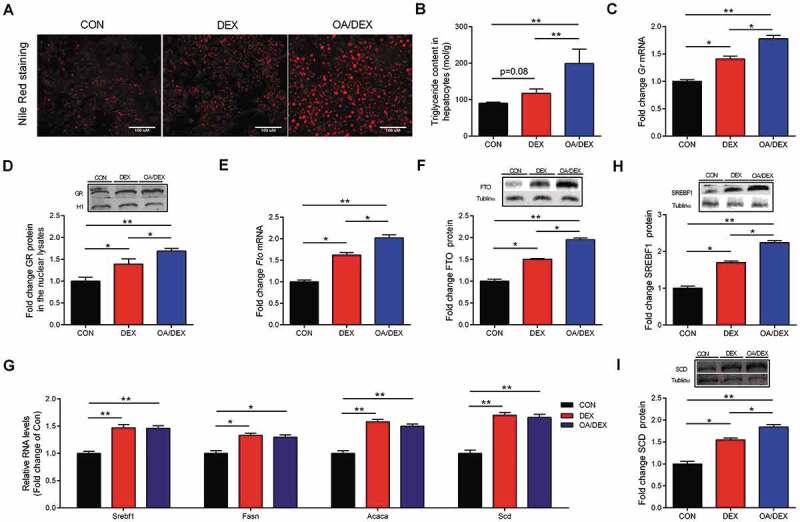
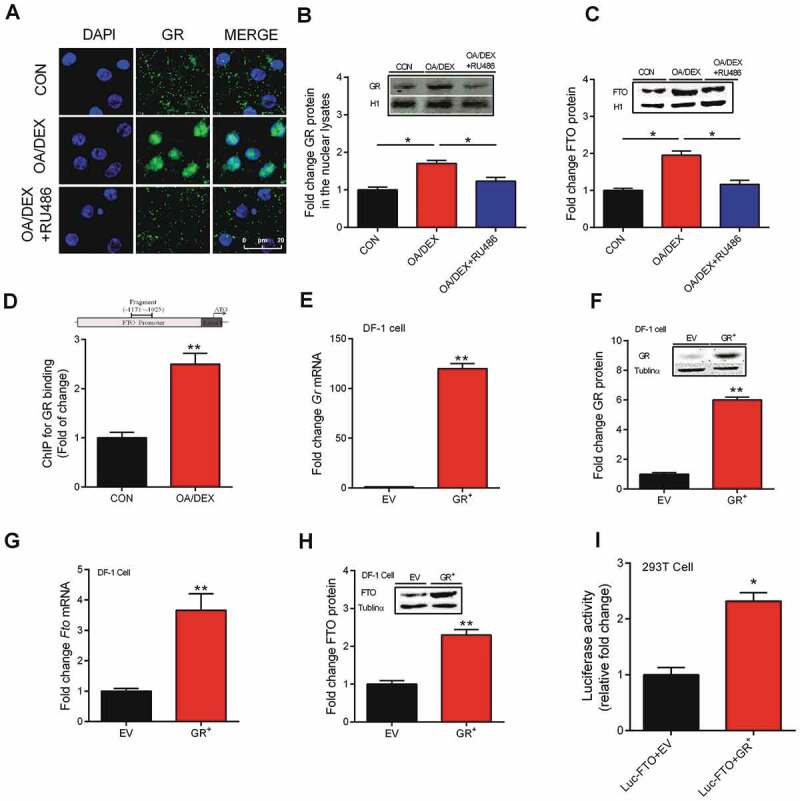
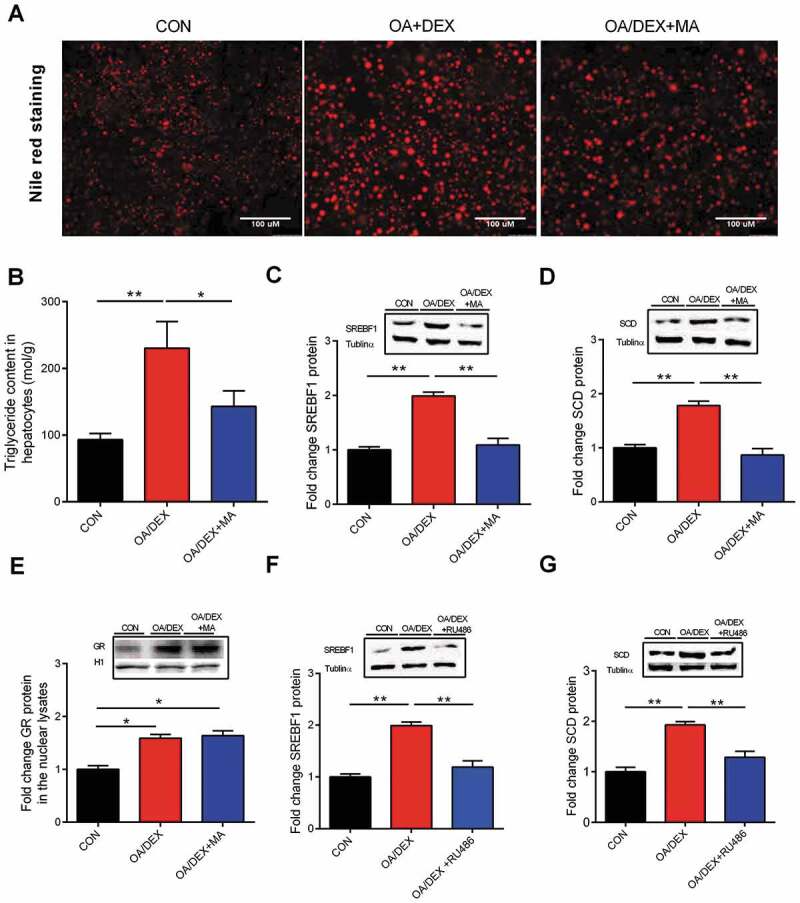
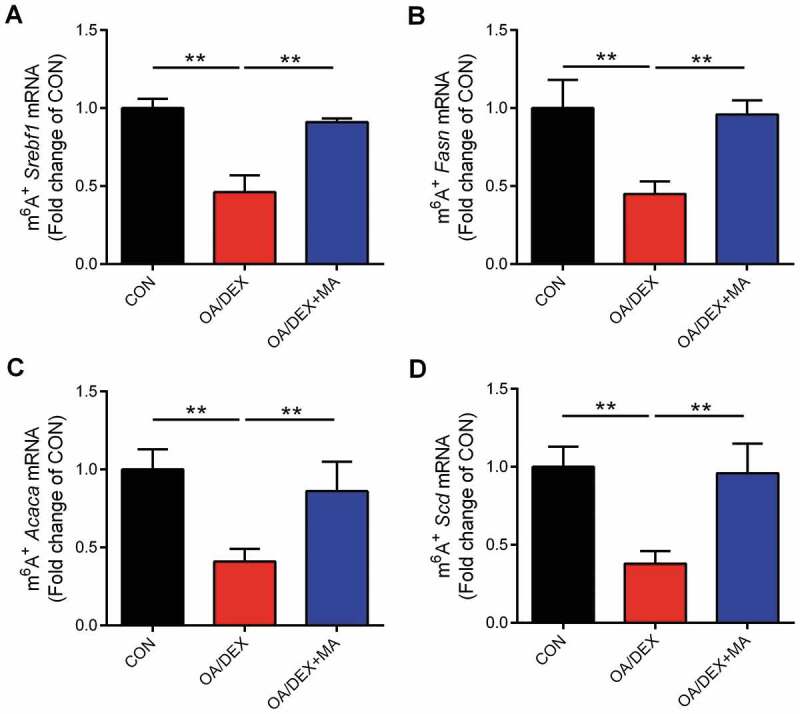
Chronic stress or excessive exposure to glucocorticoids (GC) contributes to the pathogenesis of non-alcoholic fatty liver disease (NAFLD). Glucocorticoid receptor (GR) mediates the action of GC, but its downstream signalling is not fully understood. Fat mass and obesity associated (FTO) protein and its demethylation substrate N6-methyladenosine (m6A) are both reported to participate in the regulation of lipid metabolism, yet it remains unknown whether they are involved in GC-induced hepatic lipid accumulation as new components of GR signalling. In this study, we use both in vivo and in vitro models of GC-induced hepatic lipid accumulation and demonstrate that the activation of lipogenic genes and accumulation of lipid in liver cells are mediated by GR-dependent FTO transactivation and m6A demethylation on mRNA of lipogenic genes. Targeted mutation of m6A methylation sites and FTO knockdown further validated the role of m6A on 3'UTR of sterol regulatory element-binding transcription factor 1 and stearoyl-CoA desaturase mRNAs. Finally, FTO knockdown significantly alleviated dexamethasone-induced fatty liver in mice. These results demonstrate a role of GR-mediated FTO transactivation and m6A demethylation in the pathogenesis of NAFLD and provide new insight into GR signalling in the regulation of fat metablism in the liver.
Keywords: FTO; Fatty liver; chicken primary hepatocyte; glucocorticoid receptor; lipogenesis; m6A.
Conflict of interest statement
No competing interests are declared.
Figures
Similar articles
-
Aberrant elevation of FTO levels promotes liver steatosis by decreasing the m6A methylation and increasing the stability of SREBF1 and ChREBP mRNAs.J Mol Cell Biol. 2023 Feb 7;14(9):mjac061. doi: 10.1093/jmcb/mjac061. J Mol Cell Biol. 2023. PMID: 36352530 Free PMC article.
-
FTO promotes SREBP1c maturation and enhances CIDEC transcription during lipid accumulation in HepG2 cells.Biochim Biophys Acta Mol Cell Biol Lipids. 2018 May;1863(5):538-548. doi: 10.1016/j.bbalip.2018.02.003. Epub 2018 Feb 25. Biochim Biophys Acta Mol Cell Biol Lipids. 2018. PMID: 29486327
-
FTO reduces mitochondria and promotes hepatic fat accumulation through RNA demethylation.J Cell Biochem. 2018 Jul;119(7):5676-5685. doi: 10.1002/jcb.26746. Epub 2018 Mar 14. J Cell Biochem. 2018. PMID: 29384213
-
The glucocorticoid receptor: cause of or cure for obesity?Am J Physiol Endocrinol Metab. 2016 Feb 15;310(4):E249-57. doi: 10.1152/ajpendo.00478.2015. Epub 2015 Dec 29. Am J Physiol Endocrinol Metab. 2016. PMID: 26714851 Free PMC article. Review.
-
m6A RNA Methylation and Implications for Hepatic Lipid Metabolism.DNA Cell Biol. 2024 Jun;43(6):271-278. doi: 10.1089/dna.2023.0410. Epub 2024 Apr 18. DNA Cell Biol. 2024. PMID: 38635960 Review.
Cited by
-
N6-methyladenosine modification in ischemic stroke: Functions, regulation, and therapeutic potential.Heliyon. 2024 Jan 23;10(3):e25192. doi: 10.1016/j.heliyon.2024.e25192. eCollection 2024 Feb 15. Heliyon. 2024. PMID: 38317953 Free PMC article. Review.
-
Reorganization of 3D genome architecture provides insights into pathogenesis of early fatty liver disease in laying hens.J Anim Sci Biotechnol. 2024 Mar 7;15(1):40. doi: 10.1186/s40104-024-01001-y. J Anim Sci Biotechnol. 2024. PMID: 38448979 Free PMC article.
-
Gill Oxidative Stress Protection through the Use of Phytogenics and Galactomannan Oligosaccharides as Functional Additives in Practical Diets for European Sea Bass (Dicentrarchus labrax) Juveniles.Animals (Basel). 2022 Nov 28;12(23):3332. doi: 10.3390/ani12233332. Animals (Basel). 2022. PMID: 36496852 Free PMC article.
-
N6-methyladenosine RNA methylation in liver diseases: from mechanism to treatment.J Gastroenterol. 2023 Aug;58(8):718-733. doi: 10.1007/s00535-023-02008-4. Epub 2023 Jun 28. J Gastroenterol. 2023. PMID: 37380929 Review.
-
NR3C1/Glucocorticoid receptor activation promotes pancreatic β-cell autophagy overload in response to glucolipotoxicity.Autophagy. 2023 Sep;19(9):2538-2557. doi: 10.1080/15548627.2023.2200625. Epub 2023 Apr 20. Autophagy. 2023. PMID: 37039556 Free PMC article.
References
-
- Targher G, Bertolini L, Rodella S, et al. Associations between liver histology and cortisol secretion in subjects with nonalcoholic fatty liver disease. Clin Endocrinol (Oxf). 2006;64:337–341. - PubMed
-
- Candia R, Riquelme A, Baudrand R, et al. Overexpression of 11beta-hydroxysteroid dehydrogenase type 1 in visceral adipose tissue and portal hypercortisolism in non-alcoholic fatty liver disease. Liver Int. 2012;32:392–399. - PubMed
-
- Hayashi R, Wada H, Ito K, et al. Effects of glucocorticoids on gene transcription. Eur J Pharmacol. 2004;500:51–62. - PubMed
Publication types
MeSH terms
Substances
LinkOut - more resources
Full Text Sources
Other Literature Sources
Medical
Miscellaneous