. 2020 Feb 13:14:35.
doi: 10.3389/fnins.2020.00035. eCollection 2020.

ECoG Beta Suppression and Modulation During Finger Extension and Flexion

Affiliations

ECoG Beta Suppression and Modulation During Finger Extension and Flexion

Julian Unterweger et al. Front Neurosci. .

Abstract

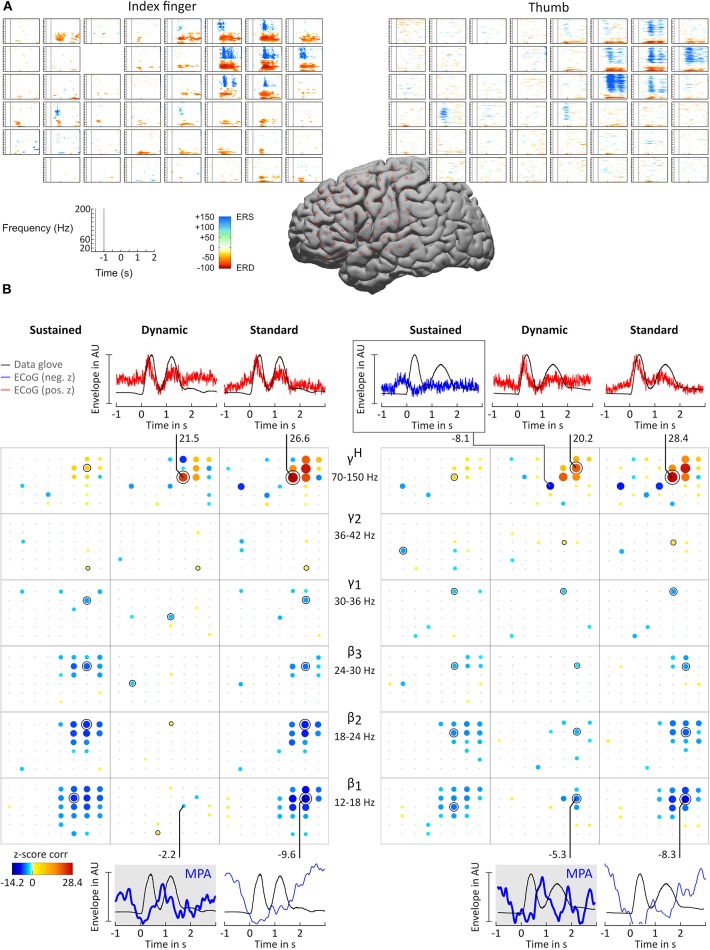
Neural oscillations originate predominantly from interacting cortical neurons and consequently reflect aspects of cortical information processing. However, their functional role is not yet fully understood and their interpretation is debatable. Amplitude modulations (AMs) in alpha (8-12 Hz), beta (13-30 Hz), and high gamma (70-150 Hz) band in invasive electrocorticogram (ECoG) and non-invasive electroencephalogram (EEG) signals change with behavior. Alpha and beta band AMs are typically suppressed (desynchronized) during motor behavior, while high gamma AMs highly correlate with the behavior. These two phenomena are successfully used for functional brain mapping and brain-computer interface (BCI) applications. Recent research found movement-phase related AMs (MPA) also in high beta/low gamma (24-40 Hz) EEG rhythms. These MPAs were found by separating the suppressed AMs into sustained and dynamic components. Sustained AM components are those with frequencies that are lower than the motor behavior. Dynamic components those with frequencies higher than the behavior. In this paper, we study ECoG beta/low gamma band (12-30 Hz/30-42 Hz) AM during repetitive finger movements addressing the question whether or not MPAs can be found in ECoG beta band. Indeed, MPA in the 12-18 Hz and 18-24 Hz band were found. This additional information may lead to further improvements in ECoG-based prediction and reconstruction of motor behavior by combining high gamma AM and beta band MPA.

Keywords: beta band; brain-computer interface; electrocorticogram; high gamma; movement-phase related amplitude modulation.


Figures

Figure 1
Figure 1
ECoG and EEG envelopes of known oscillatory phenomena during single-trial motor behavior (idealized). The top plot shows a typical times series recorded from data glove sensors during, for example, index finger extension and flexion movements. Below characteristic γH (70–150 Hz) and μ/β (8–12 Hz/13–30 Hz) activities for invasive ECoG and noninvasive EEG, respectively, are shown. EEG βHL (24–40 Hz) MPA is shown in the dotted box. corr, Pearson Correlation Coefficient; ERD, Event-Related Desynchronization; MPA, Movement Phase related Amplitude modulation.
Figure 2
Figure 2
(A) Individual thumb and index finger trajectories recorded with the 5-DOF data-glove for one patient in a time window of 120 s. (B) Signal analysis pipeline.
Figure 3
Figure 3
Results for subject BP. (A) ERD/ERS time-frequency maps. The plots show, topographically arranged (8 × 8 grid), significant ERD and ERS activity plots for index finger (left) and thumb (right). Electrode locations are marked by star symbol on standard brain. (B) Correlation analysis and MPA. Significant z-score transformed Pearson correlation coefficients, computed between corresponding digit trajectory and ECoG envelope components, are displayed for index finger (left) and thumb (right) movements. Z-scores are topographically arranged for each condition (columns, sustained, dynamic, and standard) and frequency band (rows, β1 = 12 − 18 Hz, β2 = 18 − 24 Hz, β3 = 24 − 30 Hz, γ1 = 30 − 36 Hz, γ2 = 36 − 42 Hz, and γH = 70 − 150 Hz) independently. Size and color of bubbles correspond to z-score values. A black “x” symbol marks channels with z-scores below chance level. A black annulus marks channels with the highest absolute value for each frequency band. Blank spaces in the 8 × 8 electrode grid mark channels excluded from the analysis. Note that negative correlations were smaller than positive correlations. To enhance readability of the bubble plots negative correlations are doubled in size. For selected sensorimotor channels curves of averaged amplitude envelopes of filtered ECoG and averaged data-glove trajectory for β1 (bottom) and γH (top) frequency bands are plotted. The number next to the line connecting channels and plots are the corresponding z-scores. β1 MPAs are drawn with thicker lines and highlighted in gray background color.
Figure 4
Figure 4
Correlation analysis results and MPA for subjects CC, ES, and MN. Significant z-score transformed Pearson correlation coefficients for each channel, topographically arranged in bubble plots, for index finger (left) and thumb (right) are displayed. For each subject all conditions (columns, sustained, dynamic, and standard) of γH = 70 − 150Hz and the sub-band β1 = 12 − 18 Hz or β2 = 18 − 24 Hz with the highest significant z-scores are displayed. Bubble size and color is not directly comparable from subject to subject due to different color-bar ranges. For more detailed description see Figure 3.
Figure 5
Figure 5
Correlation analysis results and MPA for subjects OJ and DJ. Significant z-score transformed Pearson correlation coefficients for each channel, topographically arranged in bubble plots, for index finger (left) and thumb (right) are displayed. For each subject all conditions (columns, sustained, dynamic, and standard) of γH = 70 − 150Hz and the sub-band β1 = 12 − 18 Hz or β2 = 18 − 24 Hz with the highest significant z-scores are displayed. Bubble size and color is not directly comparable from subject to subject due to different color-bar ranges. For more detailed description see Figure 3.

References

    1. Ball T., Demandt E., Mutschler I., Neitzel E., Mehring C., Vogt K., et al. . (2008). Movement related activity in the high gamma range of the human EEG. Neuroimage 41, 302–310. 10.1016/j.neuroimage.2008.02.032 - DOI - PubMed
    1. Crone N. E., Miglioretti D. L., Gordon B., Lesser R. P. (1998). Functional mapping of human sensorimotor cortex with electrocorticographic spectral analysis. II. Event-related synchronization in the gamma band. Brain 121, 2301–2315. 10.1093/brain/121.12.2301 - DOI - PubMed
    1. Darvas F., Scherer R., Ojemann J. G., Rao R. P., Miller K. J., Sorensen L. B. (2010). High gamma mapping using EEG. Neuroimage 49, 930–938. 10.1016/j.neuroimage.2009.08.041 - DOI - PMC - PubMed
    1. Donner T. H., Siegel M. (2011). A framework for local cortical oscillation patterns. Trends Cogn. Sci. 15, 191–199. 10.1016/j.tics.2011.03.007 - DOI - PubMed
    1. Edwards E., Soltani M., Deouell L. Y., Berger M. S., Knight R. T. (2005). High gamma activity in response to deviant auditory stimuli recorded directly from human cortex. J. Neurophysiol. 94, 4269–4280. 10.1152/jn.00324.2005 - DOI - PubMed

LinkOut - more resources