. 2020 Feb 7:14:89.
doi: 10.3389/fnins.2020.00089. eCollection 2020.

Striatal Beta Oscillation and Neuronal Activity in the Primate Caudate Nucleus Differentially Represent Valence and Arousal Under Approach-Avoidance Conflict

Affiliations

Striatal Beta Oscillation and Neuronal Activity in the Primate Caudate Nucleus Differentially Represent Valence and Arousal Under Approach-Avoidance Conflict

Ken-Ichi Amemori et al. Front Neurosci. .

Abstract

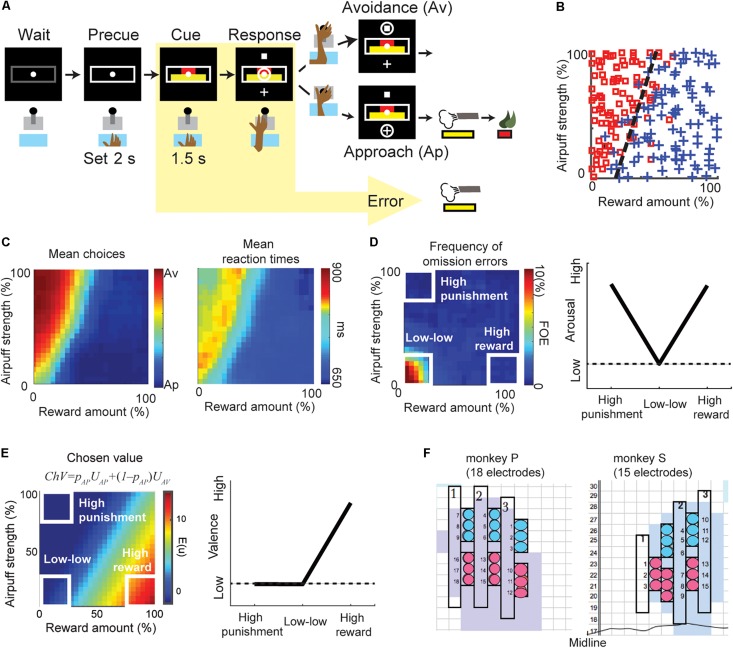
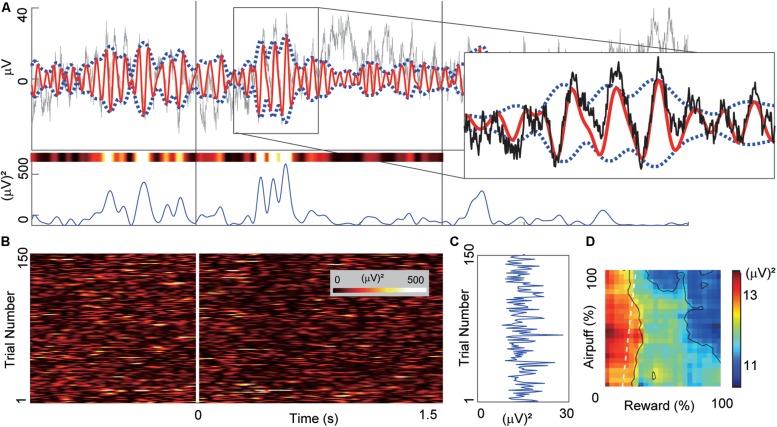
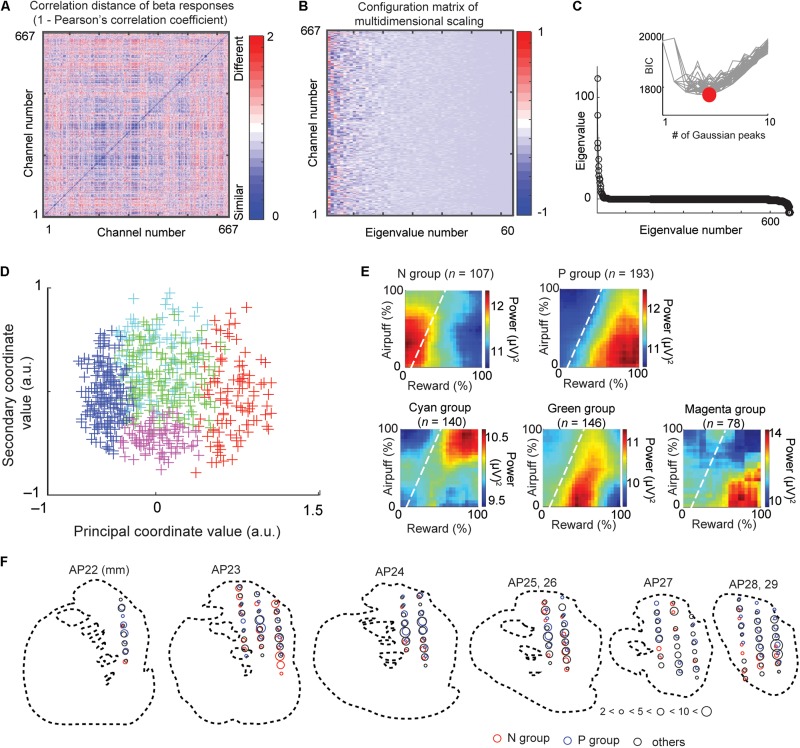
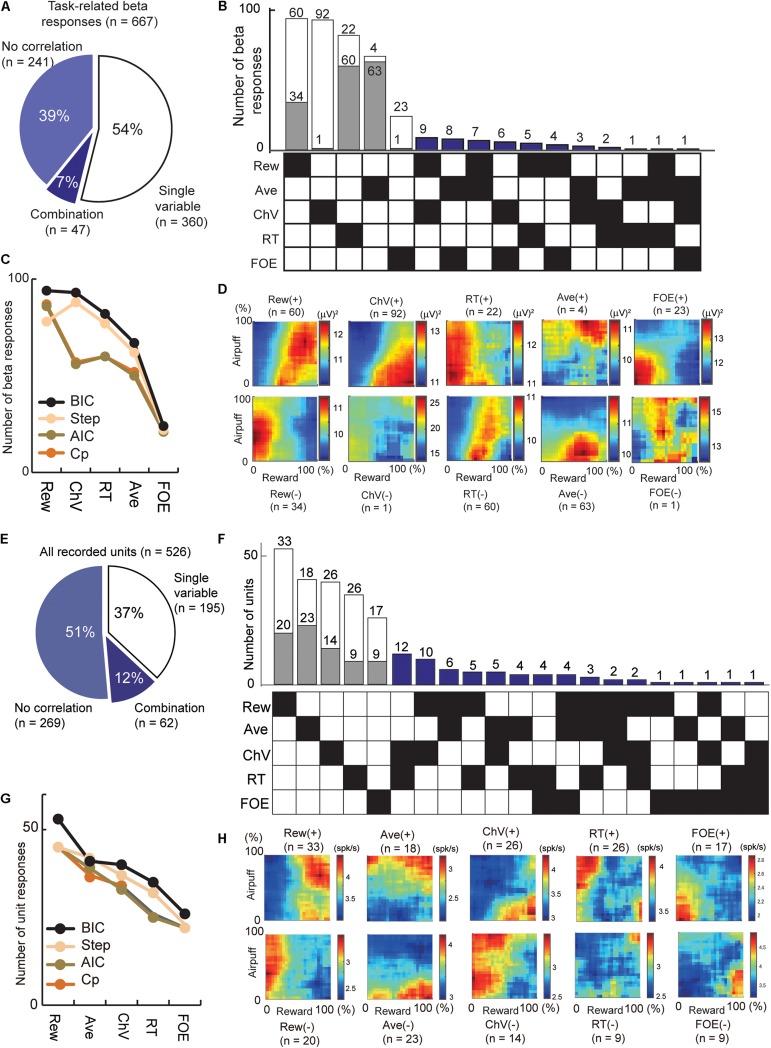
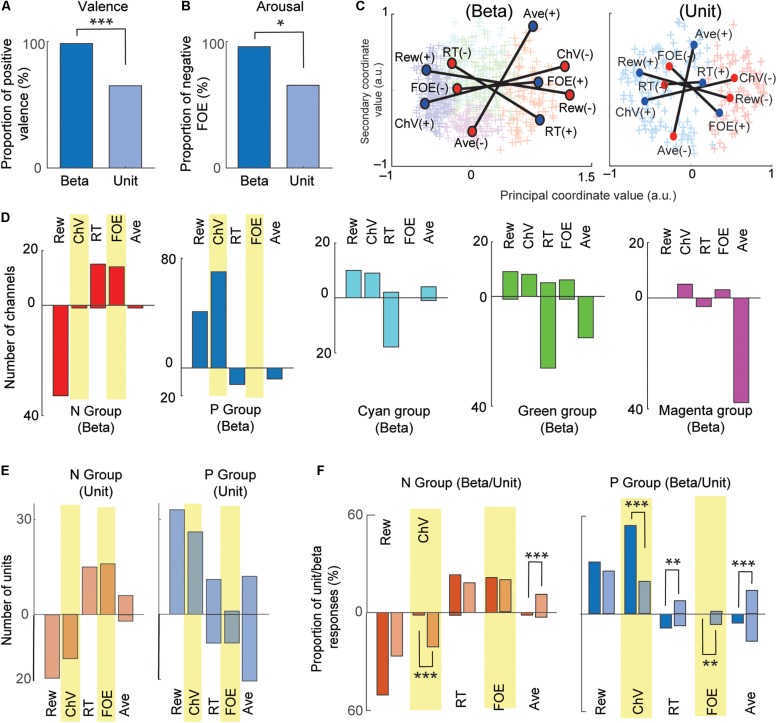
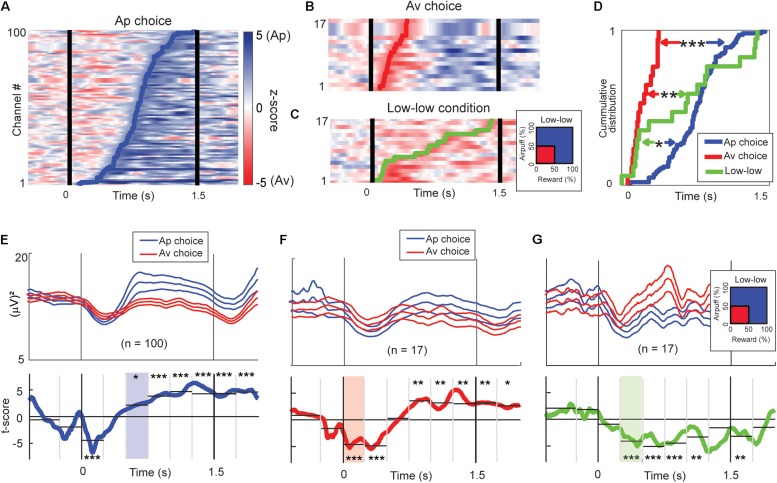
An approach-avoidance (Ap-Av) conflict arises when an individual has to decide whether to accept or reject a compound offer that has features indicating both reward and punishment. During value judgments of likes and dislikes, arousal responses simultaneously emerge and influence reaction times and the frequency of behavioral errors. In Ap-Av decision-making, reward and punishment differentially influence valence and arousal, allowing us to dissociate their neural processing. The primate caudate nucleus (CN) has been implicated in affective judgment, but it is still unclear how neural responses in the CN represent decision-related variables underlying choice. To address this issue, we recorded spikes and local field potentials (LFPs) from the CN while macaque monkeys performed an Ap-Av decision-making task. We analyzed 450 neuronal units and 667 beta oscillatory activities recorded during the performance of the task. To examine how these activities represented valence, we focused on beta-band responses and unit activities that encoded the chosen value (ChV) of the compound offer as derived from an econometric model. Unit activities exhibited either positive (65.0% = 26/40) or negative (35.0% = 14/40) correlations with the ChV, whereas beta responses exhibited almost exclusively positive correlations with the ChV (98.4% = 62/63). We examined arousal representation by focusing on beta responses and unit activities that encoded the frequency of omission errors (FOE), which were negatively correlated with arousal. The unit activities were either positively (65.3% = 17/26) or negatively (34.6% = 9/26) correlated with the FOE, whereas the beta responses were almost entirely positively correlated with the FOE (95.8% = 23/24). We found that the temporal onset of the beta-band responses occurred sequentially across conditions: first, the negative-value, then low-arousal, and finally, high-value conditions. These findings suggest the distinctive roles of CN beta oscillations that were sequentially activated for the valence and arousal conditions. By identifying dissociable groups of CN beta-band activity responding in relation to valence and arousal, we demonstrate that the beta responses mainly exhibited selective activation for the high-valence and low-arousal conditions, whereas the unit activities simultaneously recorded in the same experiments responded to chosen value and other features of decision-making under approach-avoidance conflict.

Keywords: approach–avoidance conflict; arousal; beta oscillation; caudate nucleus; cognitive engagement; decision-making; primate; valence.


Figures

FIGURE 1
FIGURE 1
The behaviors of the Ap–Av decision-making task. (A) Task procedure of the Ap–Av decision-making task. During the cue period, the red and yellow horizontal bars, respectively signaling the offered amounts of reward and punishment, appeared on the monitor. The monkeys decided between acceptance and rejection of the combined offer and reported it by choosing either of two targets (cross for Ap; square for Av) that appeared during the response period. Locations of the targets were alternated randomly. When the monkey did not respond during the response period, the trial was counted as an omission error. (B) The Ap–Av choice pattern in a single session. The x-axis indicates the offered reward amount, and the y-axis shows the offered airpuff strength. Blue crosses indicate Ap choice. Red squares indicate Av. (C) Mean Ap–Av choices (left). Mean reaction times (RTs) mapped onto the decision matrix (right). Each datum was spatially smoothed by a square window (20% by 20% in the decision matrix). (D) Frequency of omission errors (FOE) (left) and the schematic of arousal (right). When the monkey did not move the joystick during the 3-s response period, the trial was regarded as an omission error. To compare the valence and arousal, we focused on the “high-reward,” “high-punishment,” and “low–low” condition (right). We observed omissions almost exclusively at the “low–low” condition punishment offer, suggesting that both reward and punishment facilitated task engagement. Arousal level was thus defined as a V-shape relationship as it became high either in the “high-punishment” or in the “high-reward” condition (left). (E) The chosen value (ChV) (left) and the schematic of valence (right). The ChV corresponds to the expected outcome value associated with the selected option. We defined valence by the ChV. Valence became high in the “high-reward” condition and low in the “low–low” condition. It became zero in the “high-punishment” condition as the monkey always chose Av in the condition. (F) Positions of the implanted electrodes (circles) on the recording grid system for monkey P (left) and monkey S (right). Grids were placed on the skull with 5° tilt from the horizontal plane. Electrodes were implanted in the anterior portion of the CN (light blue shading). The numbers along the midline indicate the intra-aural anterior-posterior coordinates of the grid system in millimeter. The color of the circles indicates the group of electrodes that shared the same reference signal.
FIGURE 2
FIGURE 2
Example of beta oscillation recorded from a CN electrode. (A) Example of the LFP activity recorded from a CN electrode aligned to the onset of the cue period. The time scale is the same as in (B). Gray and red lines in the top panel indicate the LFP activity and the band-pass-filtered (13–28 Hz) activity. We derived the power magnitude using the difference between the upper and lower envelopes that were represented by blue dotted lines. The right inset shows a magnified view of the region inside the rectangle. The bottom panel shows the power magnitude of the envelopes. The variously colored bar above the power trace shows the same power data color-coded using the same color scale as in (B). (B) The trial-by-trial power magnitudes as a pseudo-colored raster plot (inset shows color scale). The x-axis indicates the time from the cue onset. Y-axis indicates the trial number. (C) The mean power of the beta magnitudes averaged over the 1.5-s cue period. (D) The beta response that was produced by mapping the cue-period mean power onto the decision matrix. The mapped data were spatially smoothed by a 20%-by-20% square window. X-axis and Y-axis indicate the offered sizes of reward and punishment, respectively.
FIGURE 3
FIGURE 3
Multidimensional scaling and clustering of beta responses. (A) Matrix of correlation distance between pairs of all beta response matrices (D = [dij]). The color of each element shows the correlation distance (dij = 1 - rij), where rij is the cross-correlation between decision matrices of beta response i and response j. (B) Configuration matrix derived from the multidimensional scaling. (C) Eigenvalues showing the explanatory power of each feature dimension. Inset shows the BIC values for different numbers of Gaussian peaks. Gray lines indicate the BIC values for each of many independent runs of a procedure that did the mixture-of-Gaussian fitting for each number of peaks from 1 to 10. The minimum BIC was given by five Gaussian peaks and denoted as a red circle. (D) Beta response matrices projected onto the first two dimensions of the MDS. Each cross indicates an individual channel. The color indicates the group that the channel belongs to (red: N group, blue: P group, green, cyan, and magenta: other groups). (E) The group means of beta responses in the decision matrix. Each group (N, P, cyan, green, or magenta group) was defined by the MDS clustering shown in (D). (F) Spatial distribution of sites at which we recorded LFPs classified as N (red), P (blue), and other (black) groups. The size of each circle indicates the number of LFPs at the location. Data from monkey S were projected onto outline drawings of the striatum of monkey P.
FIGURE 4
FIGURE 4
Regression analyses that extract the information encoded by the cue-period beta magnitudes and cue-period unit activities. (A) The number of beta responses classified by all-possible subset regression. The proportion of cue-period beta magnitudes explained by a single (54%) and combination (7%) of variables. (B) All-possible subset regression analysis of beta responses using the five explanatory variables (Rew, Ave, ChV, RT, and FOE), sorted in decreasing order of total number responses explained. The 360 responses explained by single variables were further separated into channels with responses that were correlated positively (white) or negatively (gray) with the variable. Forty-seven beta responses were characterized by particular combinations of variables indicated by black squares in the matrix on the bottom. (C) Classification of beta responses with all-possible subset regression analyses performed with different criteria (black, BIC; brown, AIC; orange, Mallow’s Cp), and stepwise regression analysis (cream). Y-axis is the number of beta responses where the best model was the single variable on the x-axis. (D) The population activity of the beta responses explained by single variables, sorted as in (B). Those correlated positively (+) and negatively (−) with the variables were separately categorized. (E) The number of unit activities classified by all-possible subset regression. The proportion of the cue-period unit activities explained by a single (37%) and combination (12%) of variables. (F) All-possible subset regression analysis of unit responses using the five explanatory variables (Rew, Ave, ChV, RT, and FOE), sorted in decreasing order of total number responses explained. The cue-period unit activities of 195 units were explained by single variables and were further separated into channels with responses that were correlated positively (white) or negatively (gray) with the variable. The activities of 62 units were characterized by particular combinations of variables indicated by black squares in the matrix on the bottom. (G) Classification of units with different criteria as in (C) (black, BIC; brown, AIC; orange, Mallow’s Cp; stepwise regression analyses, cream). (H) The population activity of the unit responses explained by single variables, sorted as in (F). Those correlated positively (+) and negatively (−) with the variables were separately categorized.
FIGURE 5
FIGURE 5
Comparison between beta and unit that encoded valence and arousal. (A) Comparison between valence-encoding beta and valence-encoding unit responses. The percentage of positive-valence beta responses was significantly larger than that of unit responses (Fisher’s exact test, ***P < 0.001). (B) Comparison between the arousal-encoding beta and unit responses. The percentage of the negative-arousal beta responses was significantly larger than that of unit responses (Fisher’s exact test, *P < 0.05). (C) MDS clustering for the beta (left) and unit (right) responses. The beta and unit responses were projected onto the first two dimensions of the MDS (MDS map). Each cross indicates an individual response. Two groups (P and N groups) were defined by the Gaussian mixture model. The positions of the five explanatory variables were projected onto the MDS map. Blue and red circles indicate, respectively, positive and negative correlation with the variables. (D) The representation of beta responses for each group identified by the MDS clustering. The number of beta responses encoding the five behavioral variables shown separately for each group. The stacked bars that go up indicated positive correlations, and those that go down indicated negative correlations. (E) The representation of unit responses for N and P groups identified by the MDS clustering. Stacked bars that go up and down indicate positive and negative correlations, respectively. (F) Comparison of beta and unit responses in the P and N groups (dark colors, beta; light colors, units). Stacked bars that go up and down indicate positive and negative correlations, respectively. Statistically significant differences between the proportion of units and proportion of beta are marked (Fisher’s exact test, ***P < 0.001, **P < 0.01).
FIGURE 6
FIGURE 6
Features of units encoding arousal and valence. (A) Population activity of the arousal-encoding units for the preferred (blue) and non-preferred (red) conditions. The time courses of the activities of the FOE unit were normalized by their precue period activities. Preferred and non-preferred conditions of arousal-positive or FOE(−) unit (top) and of arousal-negative or FOE(+) units (bottom) are shown on the left. (B) Mean of the differential activity relative to the “low–low” condition. Activities of FOE(−) units and the inverse of FOE(+) activities were mapped on the decision matrix (left). We compared the population mean activity in the “high-punishment,” “low–low,” and “high-reward” conditions (Paired t-test, ***P < 0.001; N.S.: P = 0.29 > 0.05). The arousal-encoding units did not discriminate between high-punishment and high-reward conditions. (C) Population activity of valence-encoding units. Preferred (blue) and non-preferred (red) conditions of the ChV(+) unit (top) and of ChV(−) units (bottom) are shown on the left. (D) Mean of the differential activity relative to the “low–low” condition. Activities of ChV(+) units and the inverse of ChV(−) activities were mapped on the decision matrix (left). We compared the population mean activity in the “high-punishment,” “low-low,” and “high-reward” conditions (Paired t-test, ***P < 0.001; N.S.: P = 0.87 > 0.05).
FIGURE 7
FIGURE 7
Features of beta responses encoding valence and arousal. (A) Features of valence-encoding beta responses. The left panel shows the mean of the differential activity from the “low–low” condition for the valence-encoding beta responses. Activities of valence-encoding beta responses were mapped onto the decision matrix. Those of ChV(+) beta responses were added, and those of ChV(−) were subtracted. The middle panel shows the mean increase in activities from the “low-low” condition. The valence-encoding beta responses discriminated the “high-punishment” and “high-reward” conditions (Paired t-test, ***P < 0.001), showing differential responses to reward and punishment. The right panel shows the mean (±SEM) power spectra of the valence-encoding beta responses (baseline-subtracted), peaking at 18.7 Hz. The light blue histogram indicates the distribution of peaks of power spectra. (B) Features of arousal-encoding beta responses. The left panel shows the mean of the differential activity from the “low–low” condition for arousal-encoding beta responses. Activities of FOE(−) beta responses were added, and those of FOE(+) were subtracted. The middle panel shows the mean increase in activities from the “low–low” conditions. The activities in the “high-punishment” and “high-reward” were significantly higher than those in the “low–low” condition (Paired t-test, ***P < 0.001). The arousal-encoding beta responses did not discriminate the “high-punishment” and “high-reward” conditions (N.S.: P = 0.47 > 0.05). The right panel shows the mean (±SEM) power spectra of the arousal-encoding beta responses (baseline-subtracted), peaking at 18.9 Hz. The light blue histogram indicates the distribution of peaks of power spectra.
FIGURE 8
FIGURE 8
Time-course of beta responses encoding valence and arousal. (A) The time-course of Ap–Av discrimination ability for each Ap-responding beta channel represented by z-score of the Wilcoxon rank-sum test. The z-scores are shown as pseudocolor rasters, with shades of blue indicating higher power for Ap choice, and red indicating higher power for Av choice. We defined the onset of choice discrimination as the earliest time at which the test returned P < 0.05 consecutively for more than 100 ms. The blue line indicates the onset of the increase of the beta magnitude for the Ap choice. (B) The time-course of Ap–Av discrimination ability for each Av-responding beta channel, as in (A). The red line indicates the onset of the increase of the beta magnitude for the Ap choice. (C) The time-course of discrimination ability for different arousal conditions. The z-scores are shown with shades of blue indicating higher power for high arousal conditions, and red indicating higher power for the “low–low” condition. The green line indicates the onset of the increase of the beta magnitude for the “low–low” condition. (D) The cumulative onset times at which beta responses discriminated between upcoming Ap and Av choices or between high and low arousal levels. The onsets of increase in the magnitude for the Av choice (red line) were significantly earlier than those for the “low–low” conditions (green line; **P < 0.01, Kolmogorov–Smirnov test) and for the Ap (blue line) choice (***P < 0.001). The onsets of increase for the “low–low” conditions were significantly earlier than those for the Ap choice (*P < 0.05). (E) Means (±SEM) of the beta power time course of the Ap-responding channels (top; blue traces = Ap, red traces = Av). Two-sided t-tests were performed for the time points to show the t-scores (bottom, blue line) of the differential activity between Ap and Av choices. We aggregated the activities into 250-ms bins to derive the significance level of the discrimination (*P < 0.05, **P < 0.01, ***P < 0.001, two-sample t-test). The light blue shows the first bin that showed a significant increase in the Ap condition. (F) Means (±SEM) of the beta power time course of the Av-responding channels (top; blue traces = Ap, red traces = Av). We also show the t-scores (bottom, red line) of the differential activity between Ap and Av choices (bottom). The light red indicates the first bin first, which showed a significant increase in the Av condition. (G) The group means (±SEM) of the beta power time course of the channels that showed an increase for the “low–low” condition (top; red traces = “low–low”). We also show the t-scores (green line) of the differential activity for the “low–low” and other conditions (bottom). The light green indicates the first bin that showed a significant increase in the “low–low” condition.

References

    1. Amemori K., Amemori S., Gibson D. J., Graybiel A. M. (2018). Striatal microstimulation induces persistent and repetitive negative decision-making predicted by striatal beta-band oscillation. Neuron 99 829–841. 10.1016/j.neuron.2018.07.022 - DOI - PMC - PubMed
    1. Amemori K., Amemori S., Graybiel A. M. (2015). Motivation and affective judgments differentially recruit neurons in the primate dorsolateral prefrontal and anterior cingulate cortex. J. Neurosci. 35 1939–1953. 10.1523/JNEUROSCI.1731-14.2015 - DOI - PMC - PubMed
    1. Amemori K., Graybiel A. M. (2012). Localized microstimulation of primate pregenual cingulate cortex induces negative decision-making. Nat. Neurosci. 15 776–785. 10.1038/nn.3088 - DOI - PMC - PubMed
    1. Aupperle R. L., Paulus M. P. (2010). Neural systems underlying approach and avoidance in anxiety disorders. Dialogues Clin. Neurosci. 12 517–531. - PMC - PubMed
    1. Belsley D. A., Kuh E., Welsch R. E. (1980). Regression Diagnostics: Identifying Influential Data and Sources of Collinearity. New York, NY: Wiley.